| Param | Original file | Final file |
|---|---|---|
| Filename | modeM0/AS1A11_032T04_9000005766_42180cztM0_level2.fits | modeM0/AS1A11_032T04_9000005766_42180cztM0_level2_quad_clean.evt |
| Size (bytes) | 314,841,600 | 90,984,960 |
| Size | 300.3 MB | 86.8 MB |
| Events in quadrant A | 3,199,709 | 605,139 |
| Events in quadrant B | 2,500,302 | 622,632 |
| Events in quadrant C | 2,531,439 | 594,971 |
| Events in quadrant D | 2,994,881 | 548,016 |
| Mode M0 | |||
|---|---|---|---|
| Quadrant | BADHDUFLAG | Total packets | Discarded packets |
| A | 0 | 12916 | 2 |
| B | 0 | 11300 | 2 |
| C | 0 | 11087 | 3 |
| D | 0 | 12771 | 2 |
| Mode M9 | |||
|---|---|---|---|
| Quadrant | BADHDUFLAG | Total packets | Discarded packets |
| A | 0 | 19 | 0 |
| B | 0 | 20 | 0 |
| C | 0 | 20 | 0 |
| D | 0 | 20 | 0 |
| Mode SS | |||
|---|---|---|---|
| Quadrant | BADHDUFLAG | Total packets | Discarded packets |
| A | 0 | 112 | 0 |
| B | 0 | 112 | 0 |
| C | 0 | 112 | 0 |
| D | 0 | 112 | 0 |
| Quadrant | Total seconds | Saturated seconds | Saturation percentage |
|---|---|---|---|
| A | 5491 | 85 | 1.547988% |
| B | 5491 | 11 | 0.200328% |
| C | 5490 | 5 | 0.091075% |
| D | 5490 | 81 | 1.475410% |
Noise dominated data is calculated using 1-second bins in cleaned event files. If a bin has >2000 counts, and if more than 50% of those come from <1% of pixels, then it is considered to be noise-dominated and hence unusable.
| Quadrant | # 1 sec bins | Bins with >0 counts | Bins with >2000 counts | High rate bins dominated by noise | Noise dominated (total time) | Noise dominated (detector-on time) | Marked lightcurve |
|---|---|---|---|---|---|---|---|
| A | 7194 | 5492 | 70 | 70 | 0.97% | 1.27% | 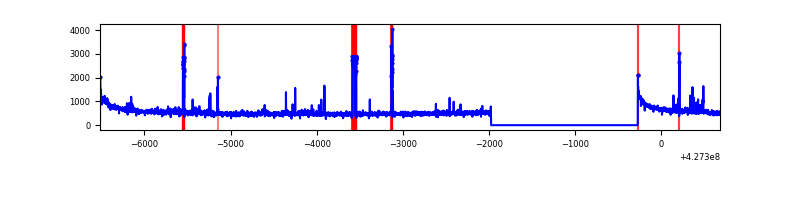 |
| B | 7194 | 5492 | 4 | 4 | 0.06% | 0.07% | 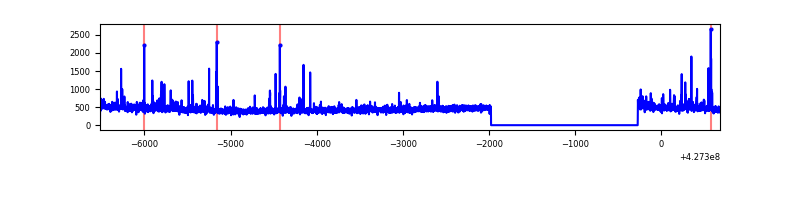 |
| C | 7193 | 5491 | 0 | 0 | 0.00% | 0.00% | 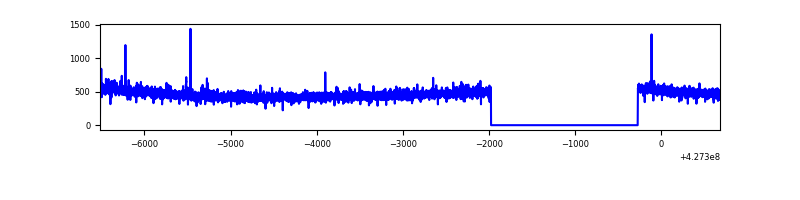 |
| D | 7193 | 5491 | 69 | 69 | 0.96% | 1.26% | 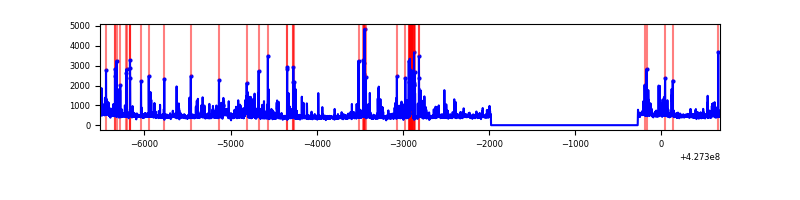 |
Top three noisy pixels from each quadrant. If the there are fewer than three noisy pixels in the level2.evt file, extra rows are filled as -1
| Pixel properties | Quadrant properties | ||||||
|---|---|---|---|---|---|---|---|
| Quadrant | DetID | PixID | Counts | Sigma | Mean | Median | Sigma |
| A | 10 | 83 | 576982 | 4671.49 | 597 | 585 | 123.4 |
| A | 15 | 222 | 174445 | 1409.07 | 597 | 585 | 123.4 |
| A | 14 | 24 | 41091 | 328.29 | 597 | 585 | 123.4 |
| B | 0 | 229 | 61826 | 533.88 | 595 | 580 | 114.7 |
| B | 5 | 255 | 44056 | 378.98 | 595 | 580 | 114.7 |
| B | 15 | 85 | 22576 | 191.74 | 595 | 580 | 114.7 |
| C | 15 | 214 | 230234 | 1676.56 | 586 | 589 | 137.0 |
| C | 15 | 159 | 9021 | 61.56 | 586 | 589 | 137.0 |
| C | 12 | 249 | 6146 | 40.57 | 586 | 589 | 137.0 |
| D | 1 | 52 | 162376 | 1121.08 | 587 | 570 | 144.3 |
| D | 13 | 249 | 122530 | 845.01 | 587 | 570 | 144.3 |
| D | 12 | 218 | 115554 | 796.67 | 587 | 570 | 144.3 |
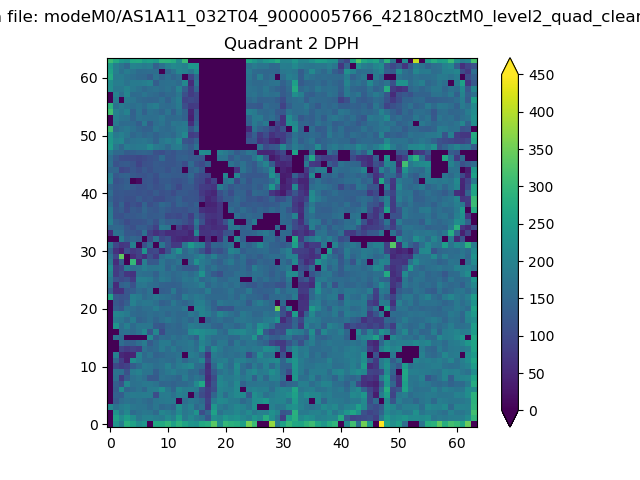
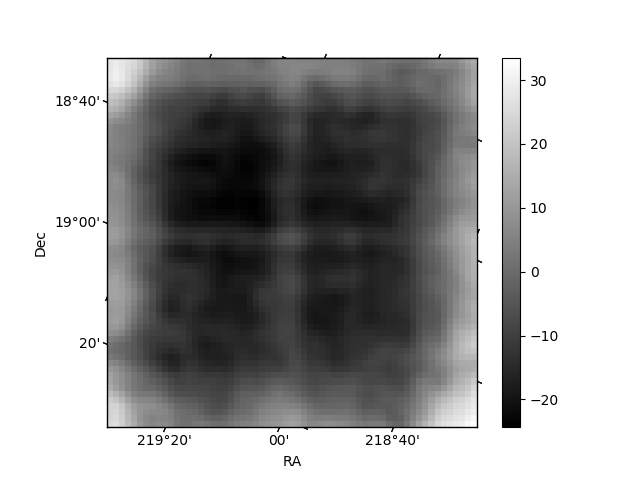
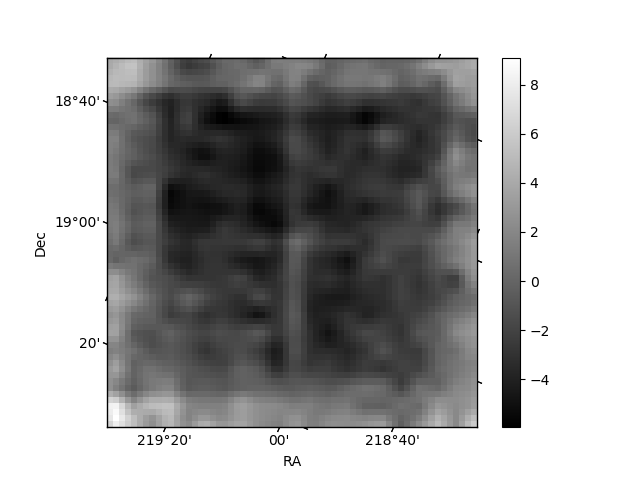
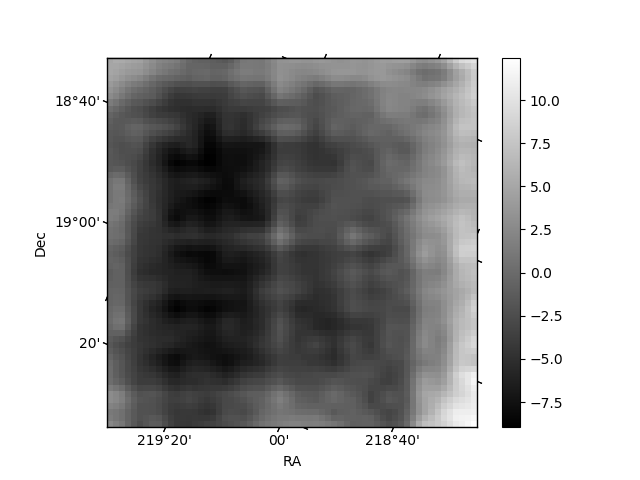
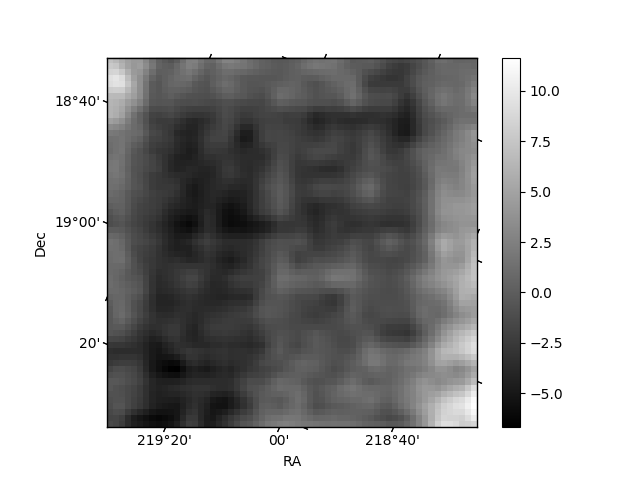
Histogram calculated using DETX and DETY for each event in the final _common_clean file
| Quadrant A | 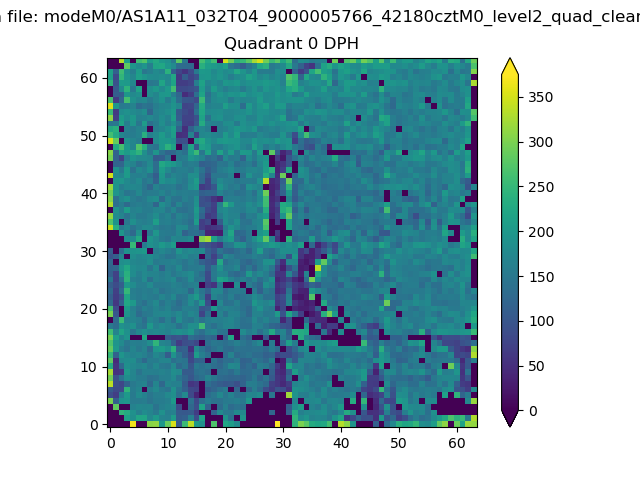 |
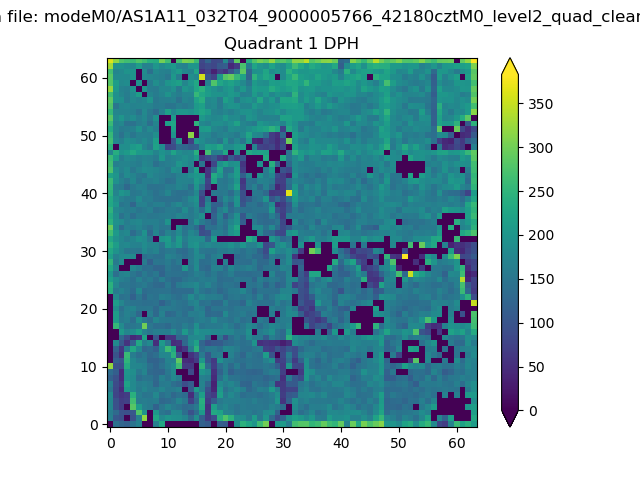 |
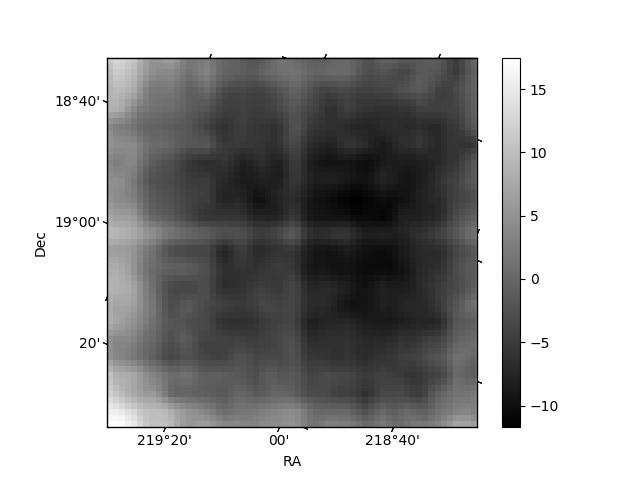
Quadrant B |
|---|---|---|---|
| Quadrant D | 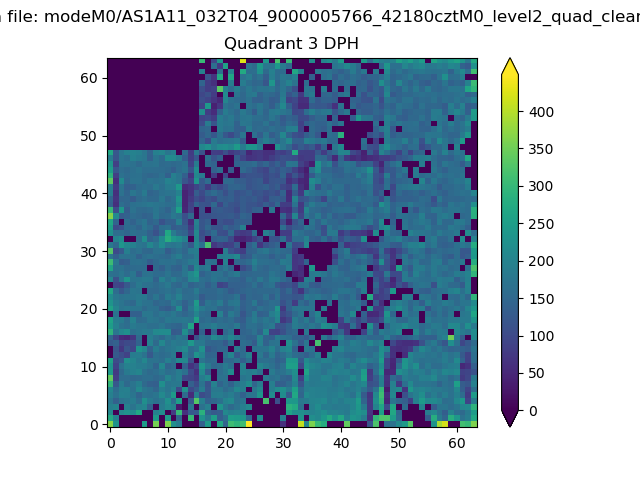 |
 |
Quadrant C |
| Plot type | Count rate plots | Images |
|---|---|---|
| Comparison with Poisson distribution Blue bars denote a histogram of data divided into 1 sec bins. Red curve is a Poisson curve with rate = median count rate of data. |
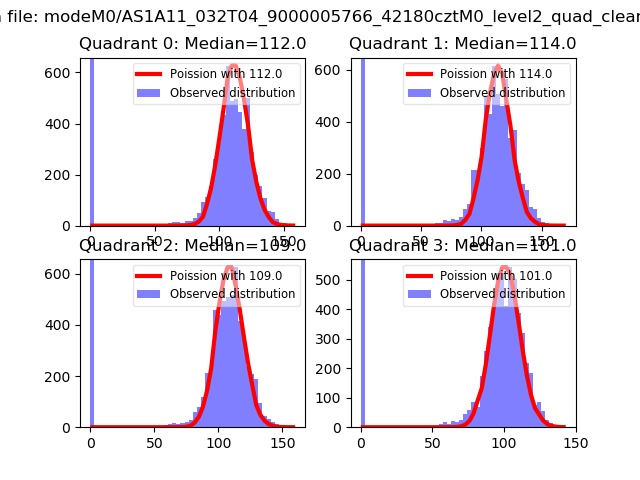 |
 |
| Quadrant-wise count rates Data is divided into 100 sec bins |
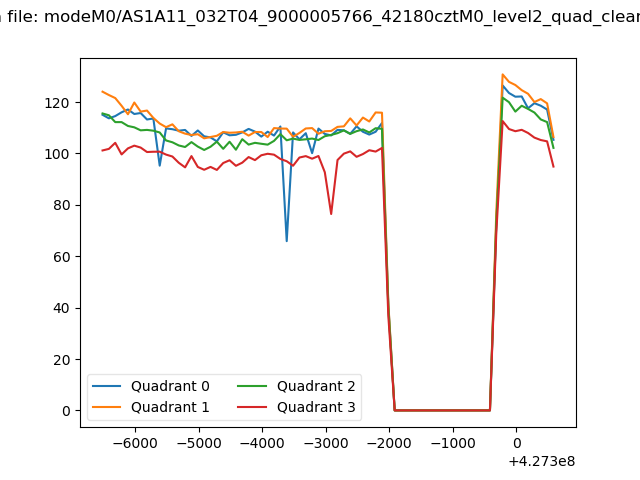 |
|
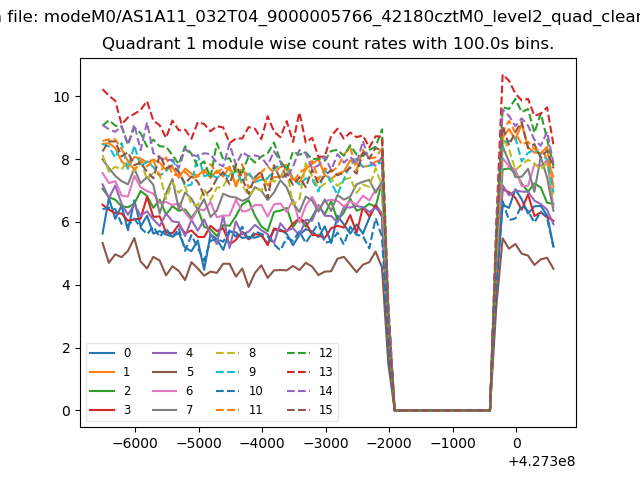
| Module-wise count rates for Quadrant A Data is divided into 100 sec bins |
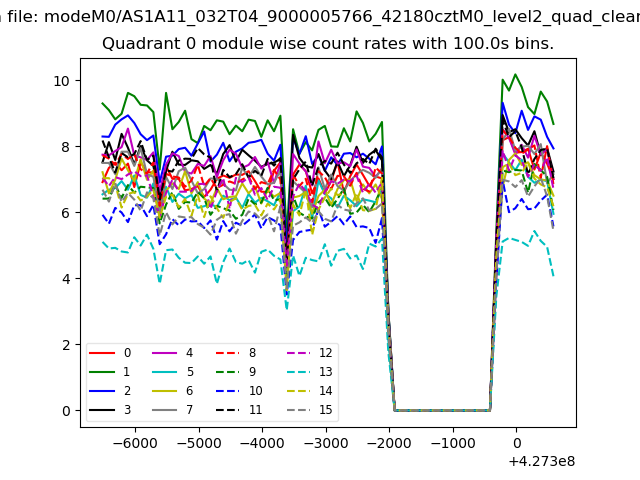 |
 |
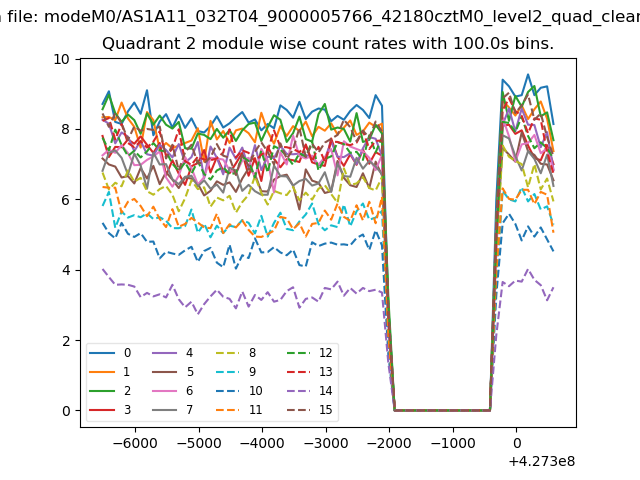
| Module-wise count rates for Quadrant B Data is divided into 100 sec bins |
 |
 |
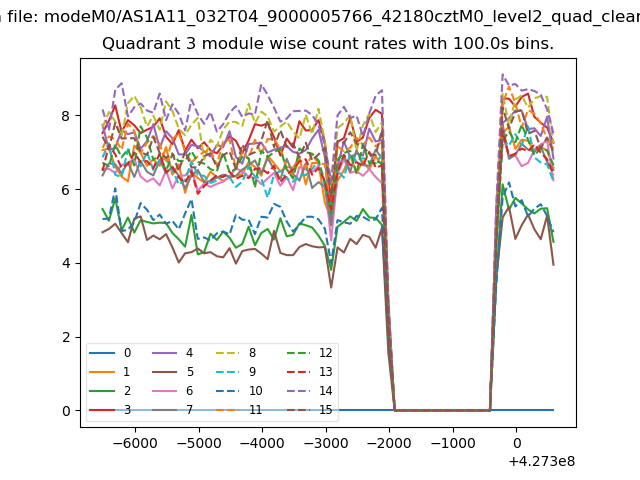
| Module-wise count rates for Quadrant C Data is divided into 100 sec bins |
 |
 |
| Module-wise count rates for Quadrant D Data is divided into 100 sec bins |
 |
 |
| Parameter | Plot |
|---|---|
| CZT HV Monitor | 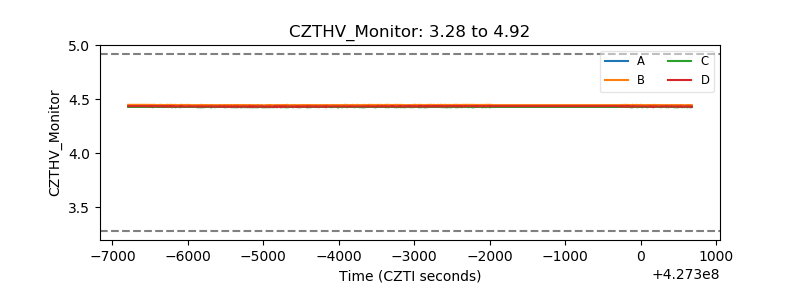 |
| D_VDD | 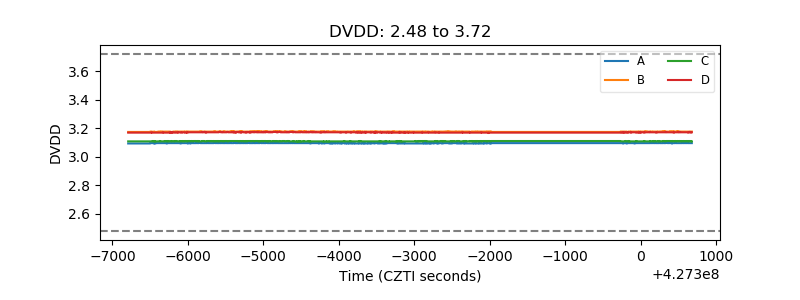 |
| Temperature 1 | 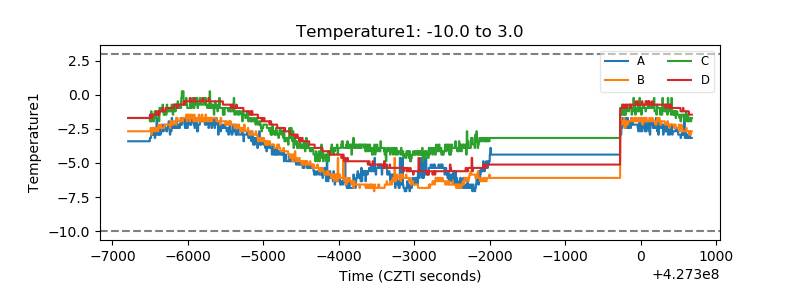 |
| Veto HV Monitor |  |
| Veto LLD | 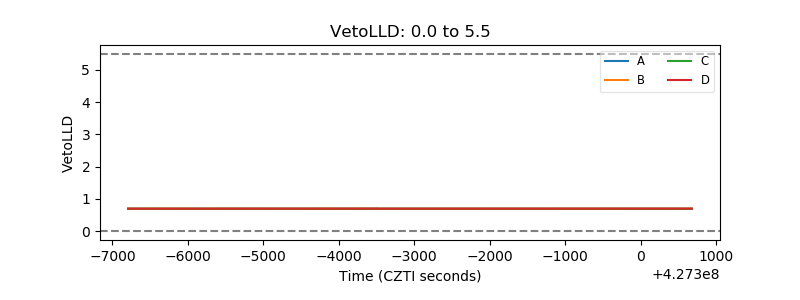 |
| Alpha Counter | 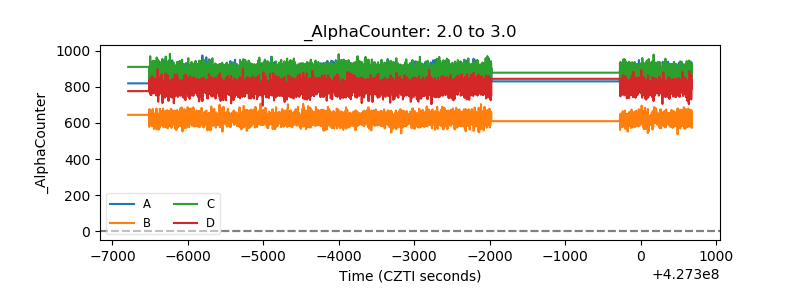 |
| _CPM_Rate | 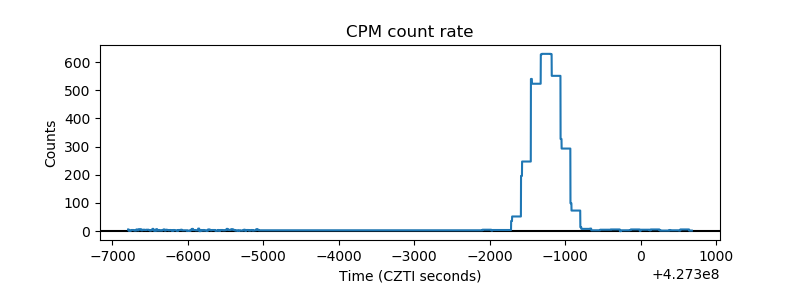 |
| CZT Counter | 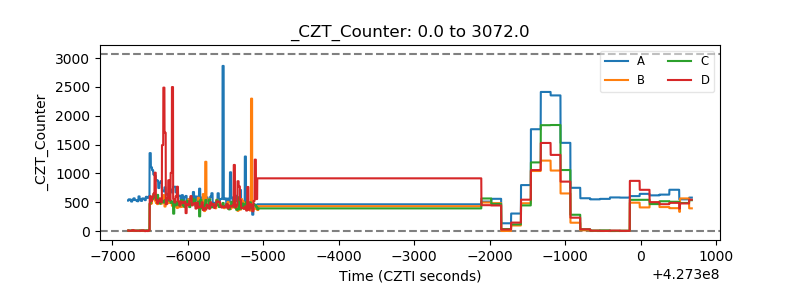 |
| +2.5 Volts monitor | 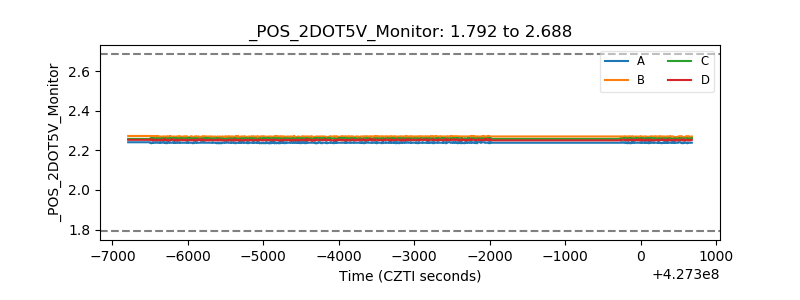 |
| +5 Volts monitor | 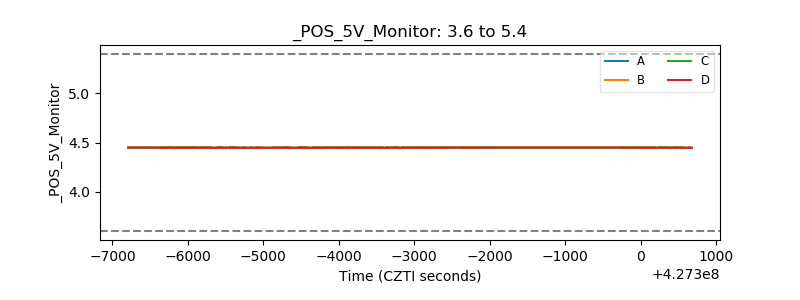 |
| _ROLL_ROT | 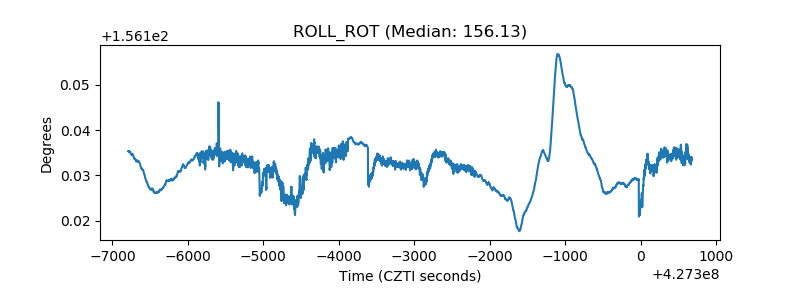 |
| _Roll_DEC | 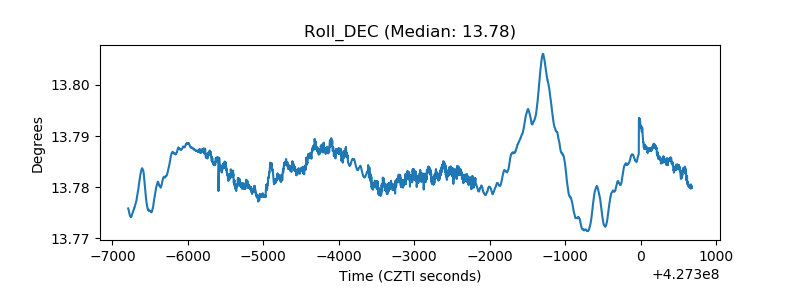 |
| _Roll_RA | 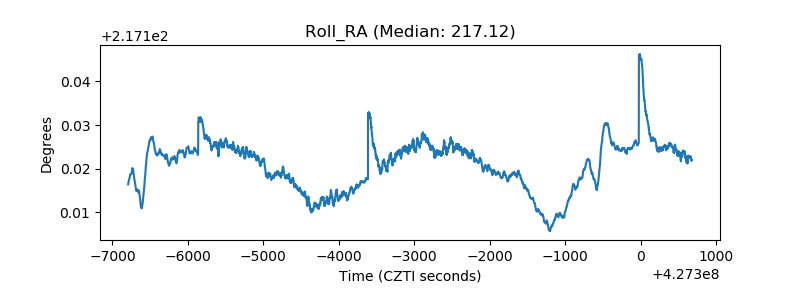 |
| Veto Counter | 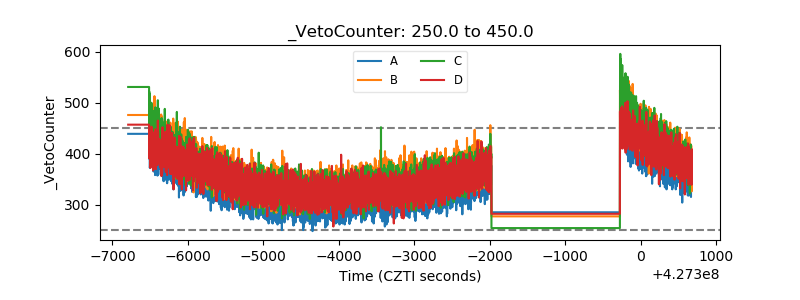 |