| Param | Original file | Final file |
|---|---|---|
| Filename | modeM0/AS1A11_032T04_9000005766_42182cztM0_level2.fits | modeM0/AS1A11_032T04_9000005766_42182cztM0_level2_quad_clean.evt |
| Size (bytes) | 1,056,732,480 | 293,083,200 |
| Size | 1007.8 MB | 279.5 MB |
| Events in quadrant A | 9,752,783 | 1,961,934 |
| Events in quadrant B | 8,862,231 | 1,998,609 |
| Events in quadrant C | 8,329,748 | 1,920,111 |
| Events in quadrant D | 10,772,981 | 1,749,109 |
| Mode M0 | |||
|---|---|---|---|
| Quadrant | BADHDUFLAG | Total packets | Discarded packets |
| A | 0 | 39605 | 5 |
| B | 0 | 39061 | 5 |
| C | 0 | 36319 | 5 |
| D | 0 | 44999 | 5 |
| Mode M9 | |||
|---|---|---|---|
| Quadrant | BADHDUFLAG | Total packets | Discarded packets |
| A | 0 | 49 | 0 |
| B | 0 | 50 | 0 |
| C | 0 | 51 | 0 |
| D | 0 | 51 | 0 |
| Mode SS | |||
|---|---|---|---|
| Quadrant | BADHDUFLAG | Total packets | Discarded packets |
| A | 0 | 366 | 0 |
| B | 0 | 366 | 0 |
| C | 0 | 366 | 0 |
| D | 0 | 366 | 0 |
| Quadrant | Total seconds | Saturated seconds | Saturation percentage |
|---|---|---|---|
| A | 18058 | 109 | 0.603611% |
| B | 18058 | 277 | 1.533946% |
| C | 18057 | 9 | 0.049842% |
| D | 18057 | 361 | 1.999225% |
Noise dominated data is calculated using 1-second bins in cleaned event files. If a bin has >2000 counts, and if more than 50% of those come from <1% of pixels, then it is considered to be noise-dominated and hence unusable.
| Quadrant | # 1 sec bins | Bins with >0 counts | Bins with >2000 counts | High rate bins dominated by noise | Noise dominated (total time) | Noise dominated (detector-on time) | Marked lightcurve |
|---|---|---|---|---|---|---|---|
| A | 44719 | 18062 | 74 | 74 | 0.17% | 0.41% | 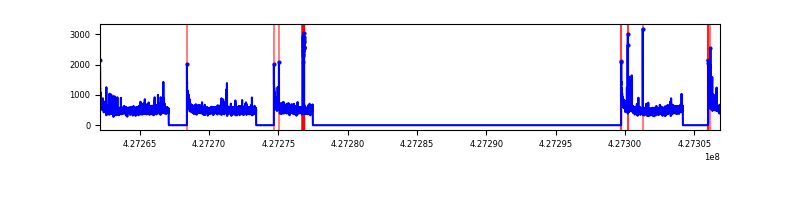 |
| B | 44719 | 18062 | 213 | 213 | 0.48% | 1.18% | 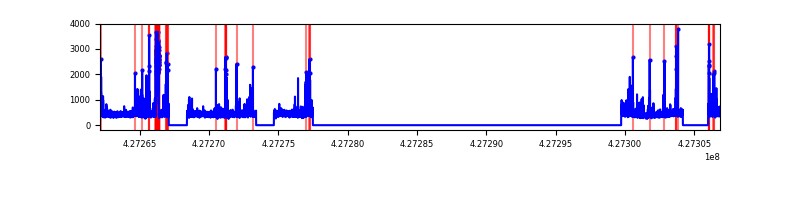 |
| C | 44718 | 18061 | 0 | 0 | 0.00% | 0.00% | 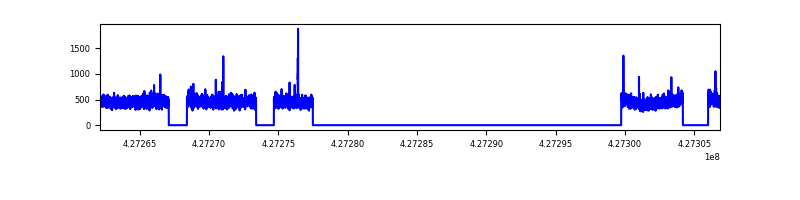 |
| D | 44718 | 18061 | 355 | 355 | 0.79% | 1.97% | 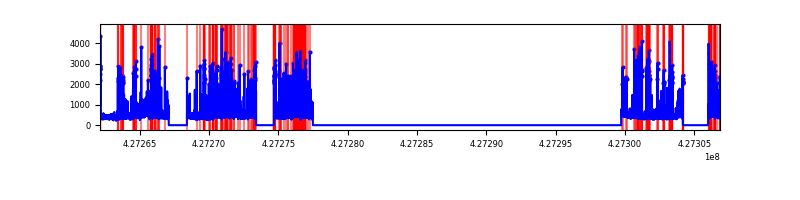 |
Top three noisy pixels from each quadrant. If the there are fewer than three noisy pixels in the level2.evt file, extra rows are filled as -1
| Pixel properties | Quadrant properties | ||||||
|---|---|---|---|---|---|---|---|
| Quadrant | DetID | PixID | Counts | Sigma | Mean | Median | Sigma |
| A | 10 | 83 | 1697141 | 4213.71 | 1969 | 1930 | 402.3 |
| A | 15 | 222 | 181593 | 446.58 | 1969 | 1930 | 402.3 |
| A | 15 | 223 | 95402 | 232.34 | 1969 | 1930 | 402.3 |
| B | 3 | 112 | 582885 | 1553.07 | 1944 | 1887 | 374.1 |
| B | 0 | 229 | 262604 | 696.93 | 1944 | 1887 | 374.1 |
| B | 5 | 255 | 212029 | 561.73 | 1944 | 1887 | 374.1 |
| C | 15 | 214 | 751655 | 1677.5 | 1923 | 1935 | 446.9 |
| C | 0 | 207 | 50770 | 109.27 | 1923 | 1935 | 446.9 |
| C | 7 | 220 | 24998 | 51.6 | 1923 | 1935 | 446.9 |
| D | 1 | 52 | 1035413 | 2201.53 | 1917 | 1861 | 469.5 |
| D | 12 | 233 | 540670 | 1147.7 | 1917 | 1861 | 469.5 |
| D | 10 | 199 | 287509 | 608.45 | 1917 | 1861 | 469.5 |
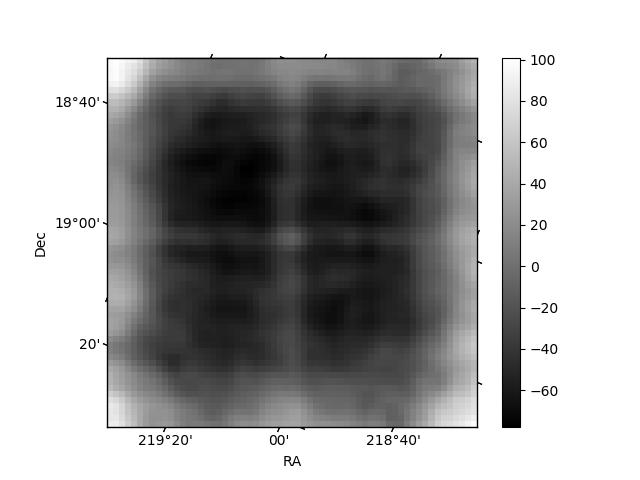
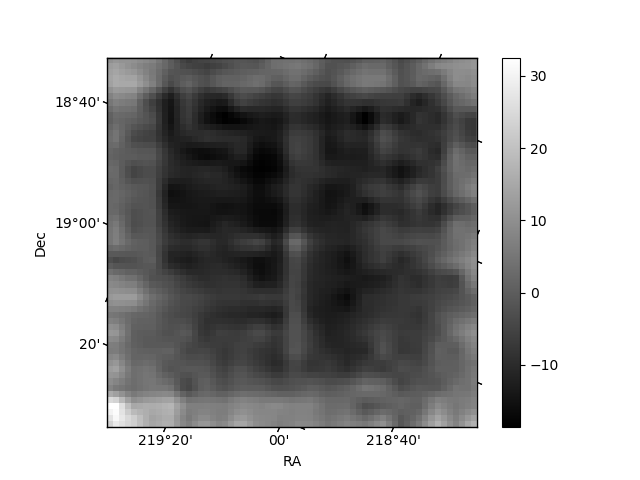
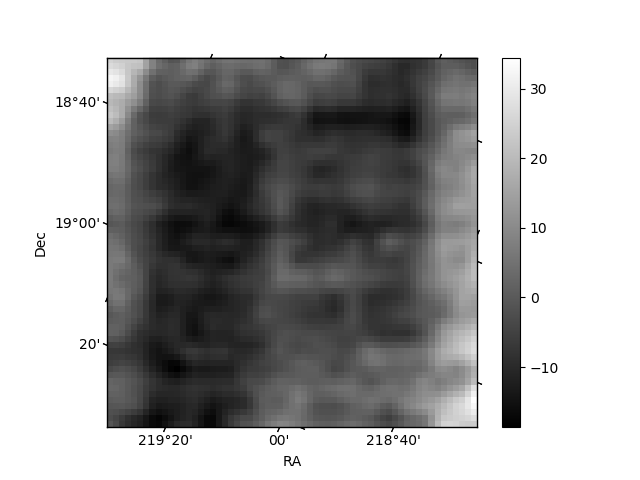
Histogram calculated using DETX and DETY for each event in the final _common_clean file
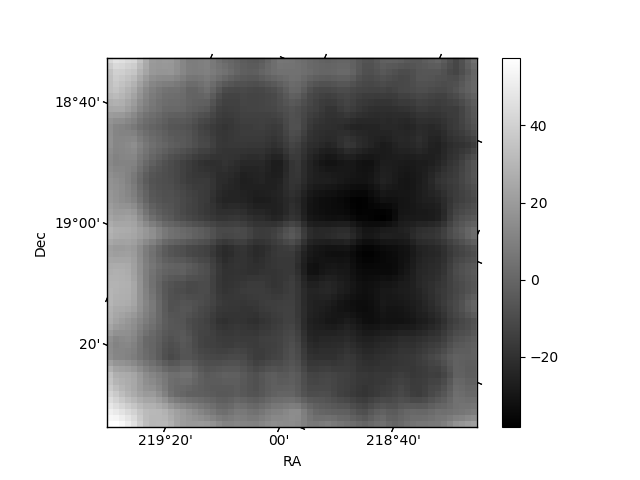
| Quadrant A | 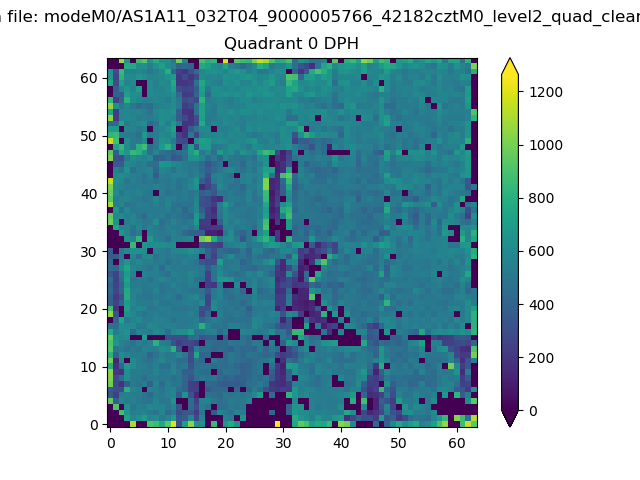 |
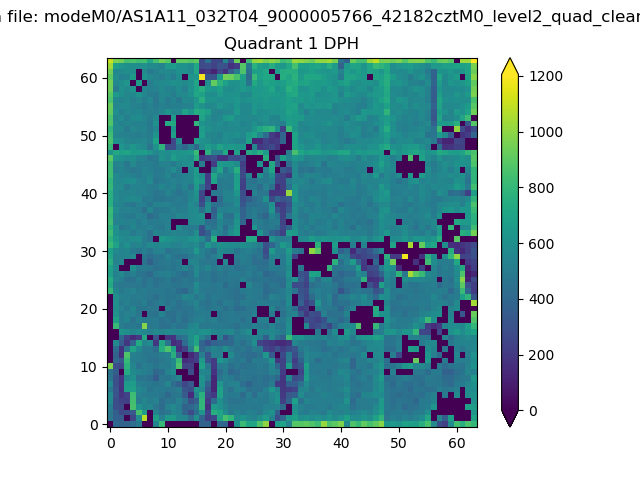 |
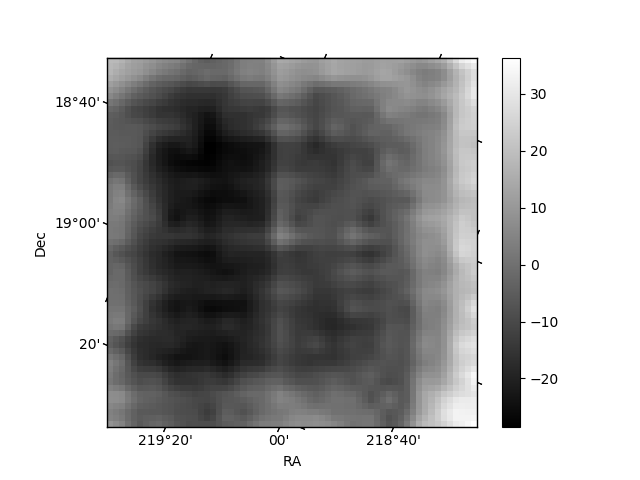
Quadrant B |
|---|---|---|---|
| Quadrant D | 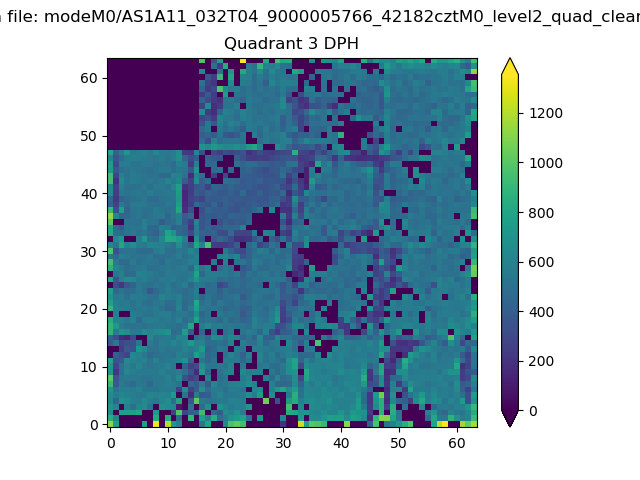 |
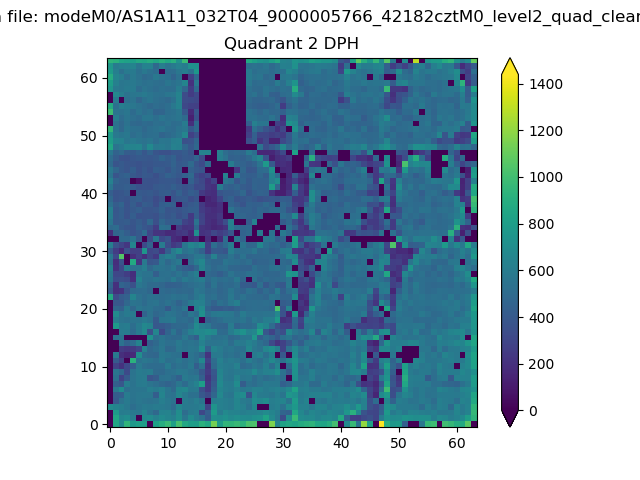 |
Quadrant C |
| Plot type | Count rate plots | Images |
|---|---|---|
| Comparison with Poisson distribution Blue bars denote a histogram of data divided into 1 sec bins. Red curve is a Poisson curve with rate = median count rate of data. |
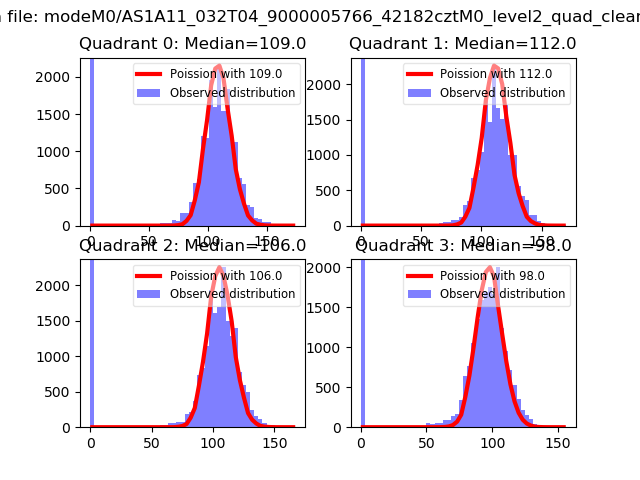 |
 |
| Quadrant-wise count rates Data is divided into 100 sec bins |
 |
|
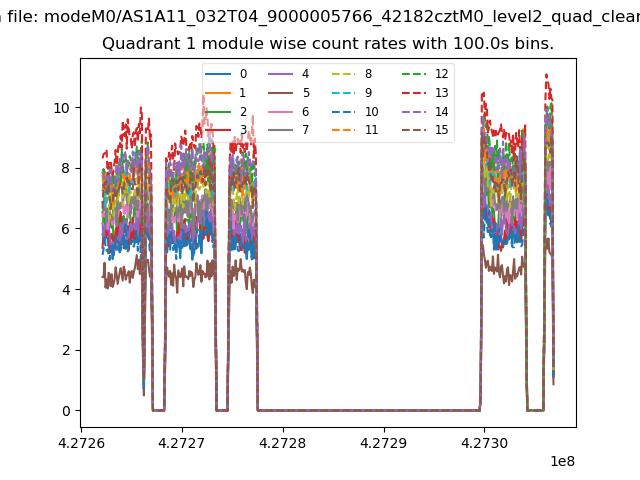
| Module-wise count rates for Quadrant A Data is divided into 100 sec bins |
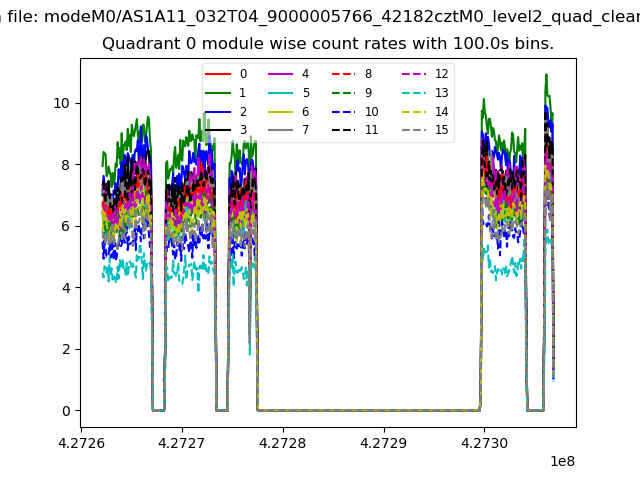 |
 |
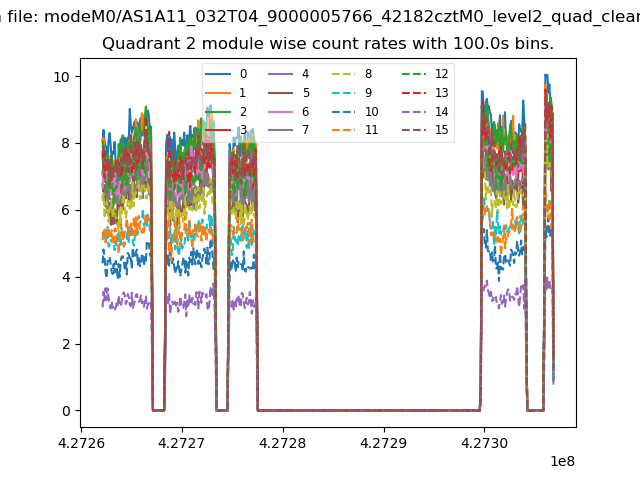
| Module-wise count rates for Quadrant B Data is divided into 100 sec bins |
 |
 |
| Module-wise count rates for Quadrant C Data is divided into 100 sec bins |
 |
 |
| Module-wise count rates for Quadrant D Data is divided into 100 sec bins |
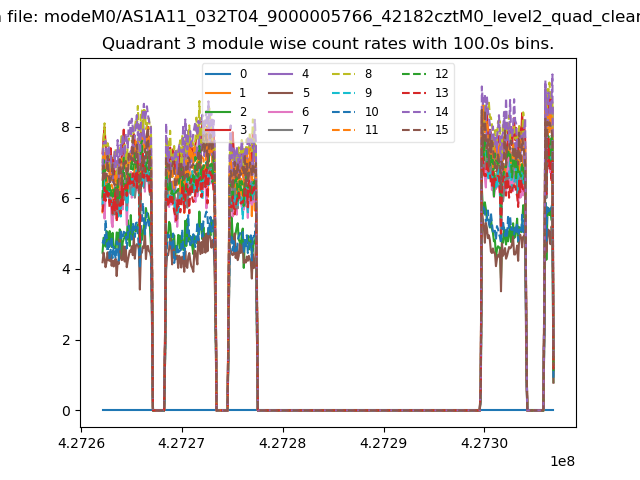 |
 |
| Parameter | Plot |
|---|---|
| CZT HV Monitor | 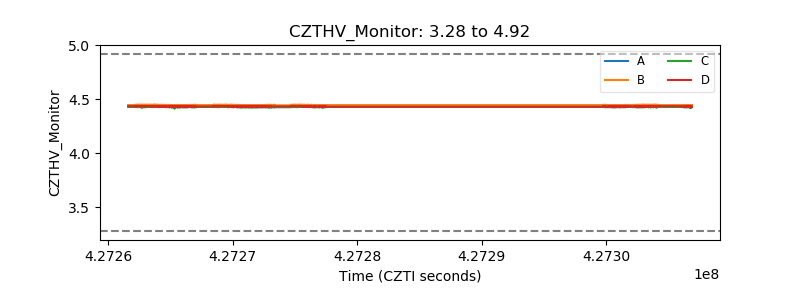 |
| D_VDD | 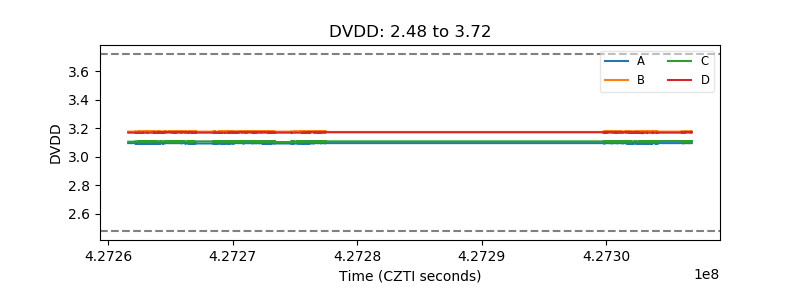 |
| Temperature 1 | 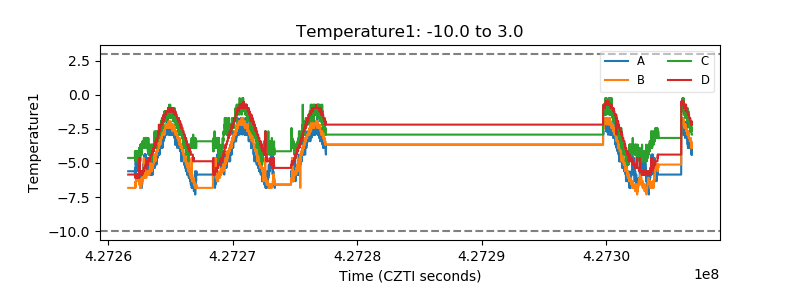 |
| Veto HV Monitor | 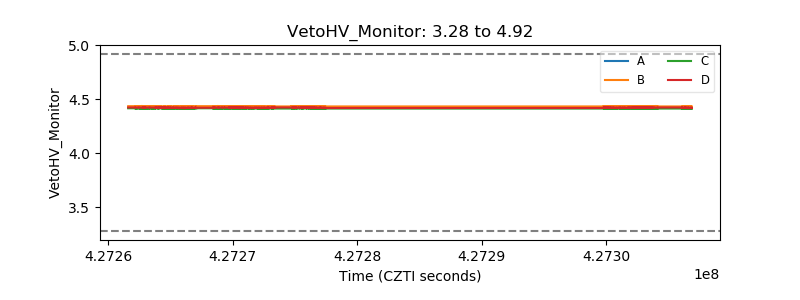 |
| Veto LLD | 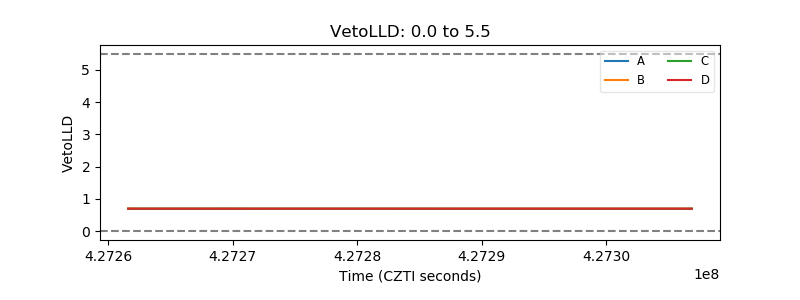 |
| Alpha Counter |  |
| _CPM_Rate |  |
| CZT Counter | 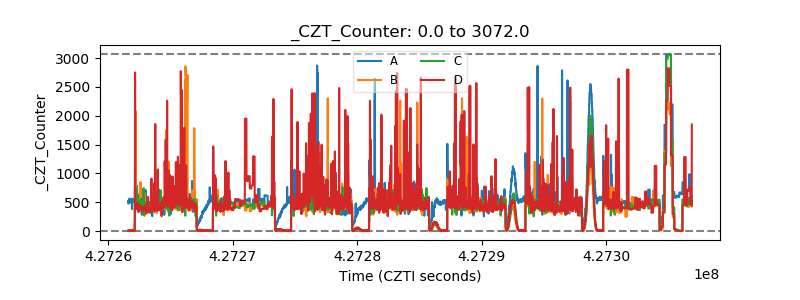 |
| +2.5 Volts monitor | 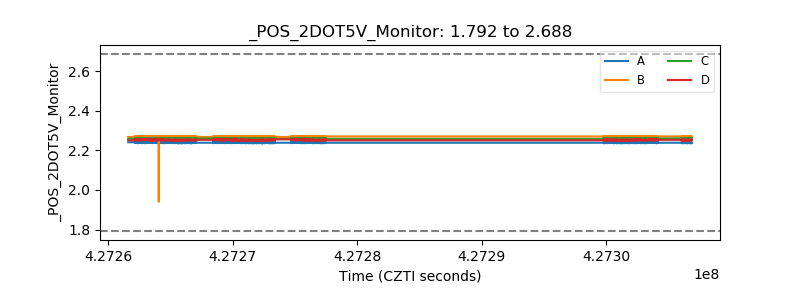 |
| +5 Volts monitor |  |
| _ROLL_ROT |  |
| _Roll_DEC | 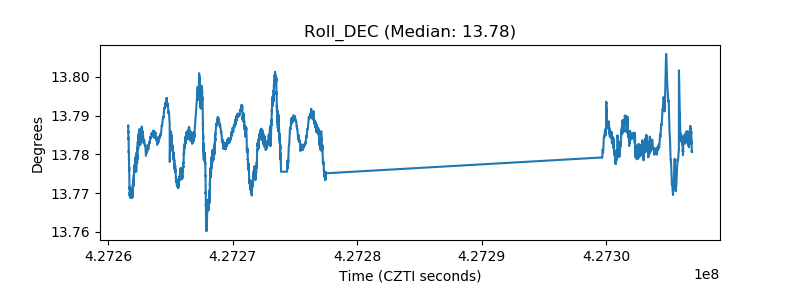 |
| _Roll_RA | 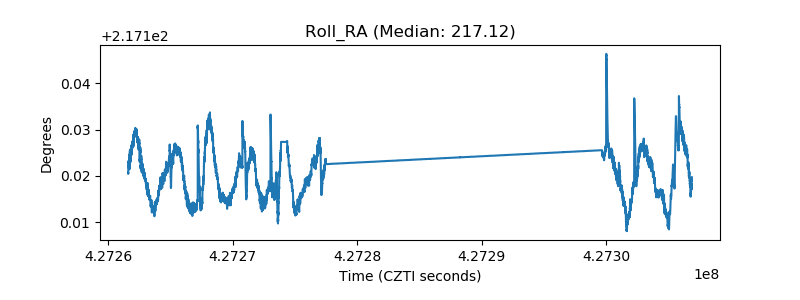 |
| Veto Counter | 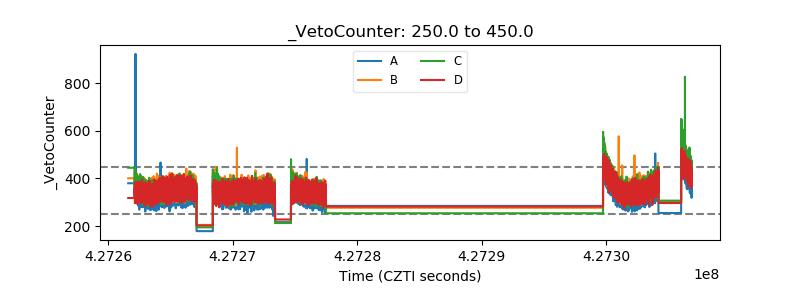 |