| Param | Original file | Final file |
|---|---|---|
| Filename | modeM0/AS1A11_032T04_9000005766_42183cztM0_level2.fits | modeM0/AS1A11_032T04_9000005766_42183cztM0_level2_quad_clean.evt |
| Size (bytes) | 317,211,840 | 88,989,120 |
| Size | 302.5 MB | 84.9 MB |
| Events in quadrant A | 2,918,597 | 603,275 |
| Events in quadrant B | 2,916,394 | 608,545 |
| Events in quadrant C | 2,413,905 | 590,552 |
| Events in quadrant D | 3,095,012 | 534,409 |
| Mode M0 | |||
|---|---|---|---|
| Quadrant | BADHDUFLAG | Total packets | Discarded packets |
| A | 0 | 11824 | 2 |
| B | 0 | 12122 | 2 |
| C | 0 | 10321 | 2 |
| D | 0 | 12787 | 2 |
| Mode M9 | |||
|---|---|---|---|
| Quadrant | BADHDUFLAG | Total packets | Discarded packets |
| A | 0 | 28 | 0 |
| B | 0 | 29 | 0 |
| C | 0 | 29 | 0 |
| D | 0 | 29 | 0 |
| Mode SS | |||
|---|---|---|---|
| Quadrant | BADHDUFLAG | Total packets | Discarded packets |
| A | 0 | 104 | 0 |
| B | 0 | 104 | 0 |
| C | 0 | 104 | 0 |
| D | 0 | 104 | 0 |
| Quadrant | Total seconds | Saturated seconds | Saturation percentage |
|---|---|---|---|
| A | 5108 | 29 | 0.567737% |
| B | 5108 | 180 | 3.523884% |
| C | 5107 | 3 | 0.058743% |
| D | 5107 | 140 | 2.741335% |
Noise dominated data is calculated using 1-second bins in cleaned event files. If a bin has >2000 counts, and if more than 50% of those come from <1% of pixels, then it is considered to be noise-dominated and hence unusable.
| Quadrant | # 1 sec bins | Bins with >0 counts | Bins with >2000 counts | High rate bins dominated by noise | Noise dominated (total time) | Noise dominated (detector-on time) | Marked lightcurve |
|---|---|---|---|---|---|---|---|
| A | 7081 | 5109 | 19 | 19 | 0.27% | 0.37% | 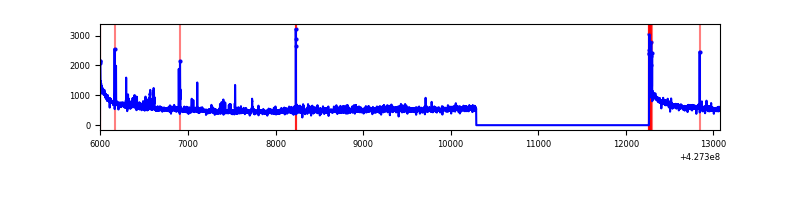 |
| B | 7081 | 5109 | 136 | 136 | 1.92% | 2.66% | 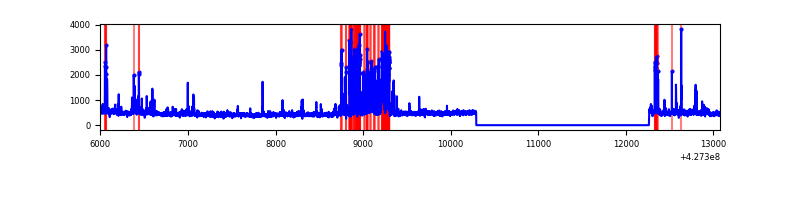 |
| C | 7080 | 5108 | 0 | 0 | 0.00% | 0.00% | 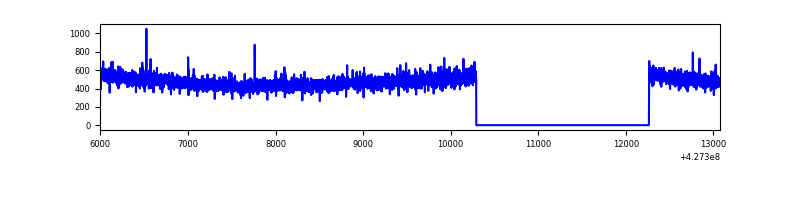 |
| D | 7080 | 5108 | 143 | 143 | 2.02% | 2.80% | 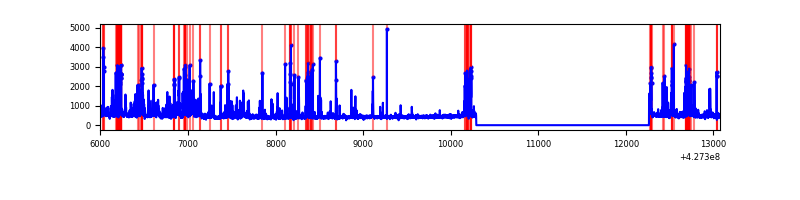 |
Top three noisy pixels from each quadrant. If the there are fewer than three noisy pixels in the level2.evt file, extra rows are filled as -1
| Pixel properties | Quadrant properties | ||||||
|---|---|---|---|---|---|---|---|
| Quadrant | DetID | PixID | Counts | Sigma | Mean | Median | Sigma |
| A | 10 | 83 | 546251 | 4651.44 | 571 | 560 | 117.3 |
| A | 15 | 223 | 109847 | 931.56 | 571 | 560 | 117.3 |
| A | 13 | 248 | 51218 | 431.81 | 571 | 560 | 117.3 |
| B | 5 | 255 | 485315 | 4494.55 | 565 | 551 | 107.9 |
| B | 0 | 229 | 104873 | 967.23 | 565 | 551 | 107.9 |
| B | 3 | 112 | 66747 | 613.74 | 565 | 551 | 107.9 |
| C | 15 | 214 | 211738 | 1602.98 | 560 | 565 | 131.7 |
| C | 0 | 207 | 11694 | 84.48 | 560 | 565 | 131.7 |
| C | 12 | 249 | 5511 | 37.54 | 560 | 565 | 131.7 |
| D | 12 | 218 | 311211 | 2302.02 | 552 | 536 | 135.0 |
| D | 1 | 47 | 177361 | 1310.23 | 552 | 536 | 135.0 |
| D | 12 | 6 | 152175 | 1123.6 | 552 | 536 | 135.0 |
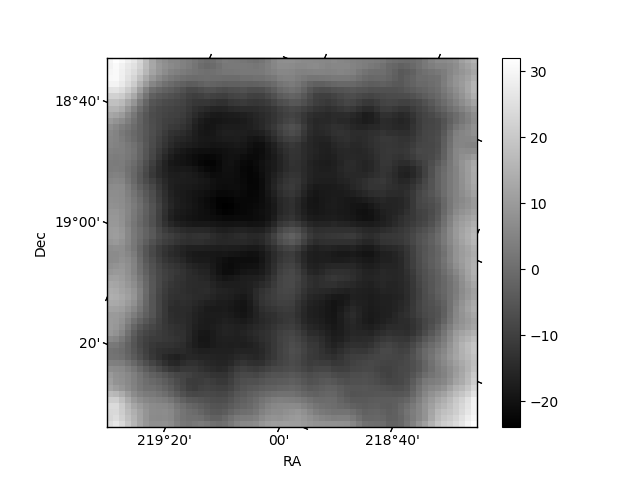
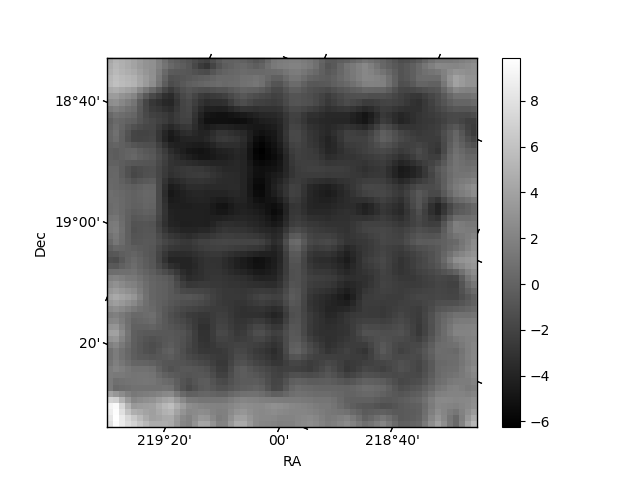
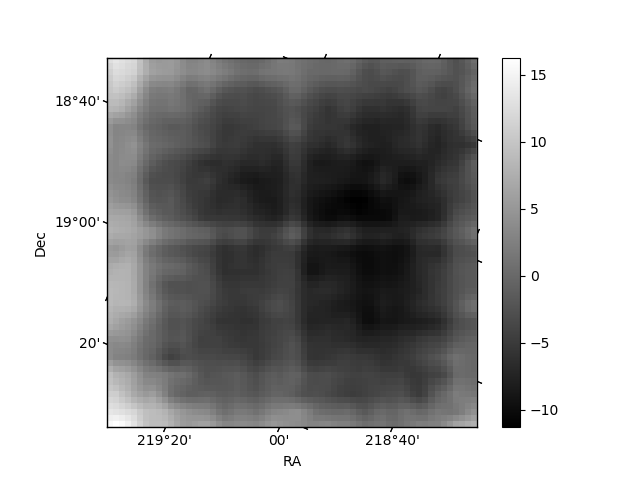
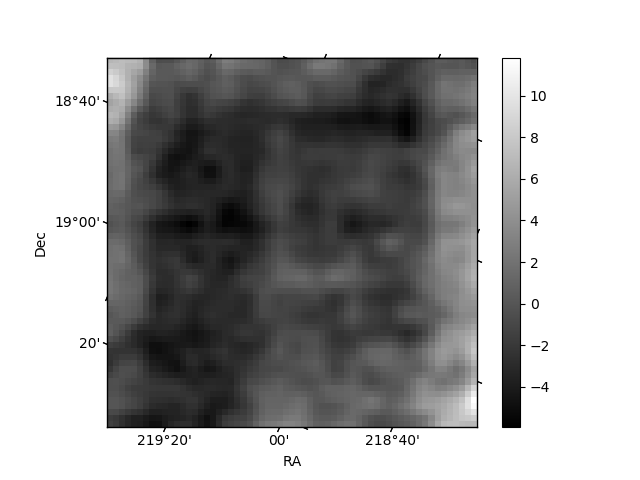
Histogram calculated using DETX and DETY for each event in the final _common_clean file
| Quadrant A | 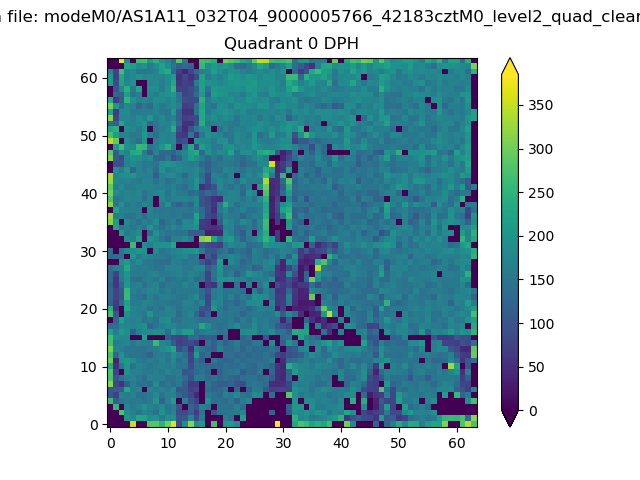 |
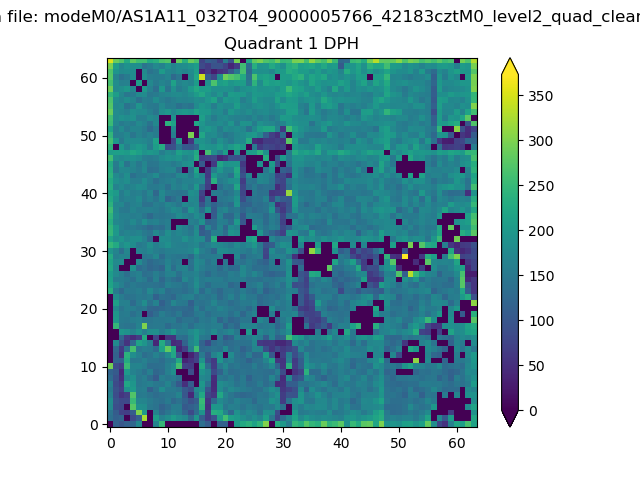 |
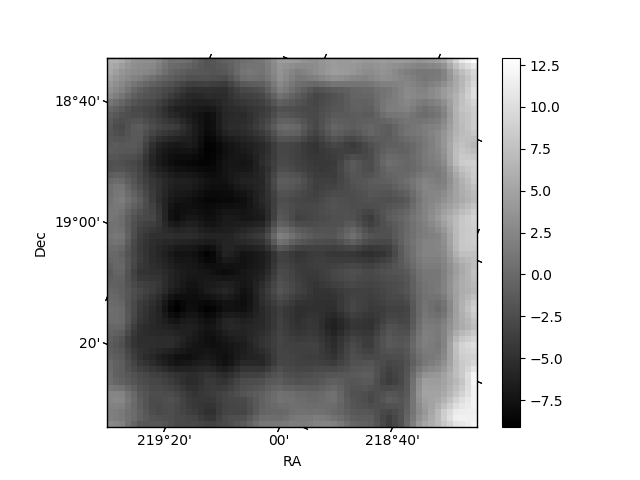
Quadrant B |
|---|---|---|---|
| Quadrant D |  |
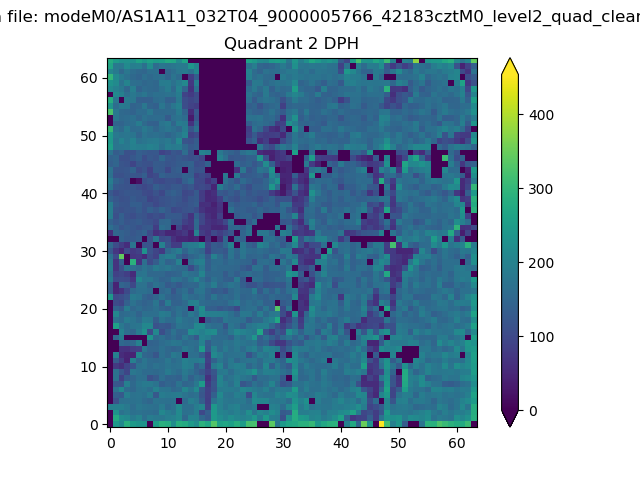 |
Quadrant C |
| Plot type | Count rate plots | Images |
|---|---|---|
| Comparison with Poisson distribution Blue bars denote a histogram of data divided into 1 sec bins. Red curve is a Poisson curve with rate = median count rate of data. |
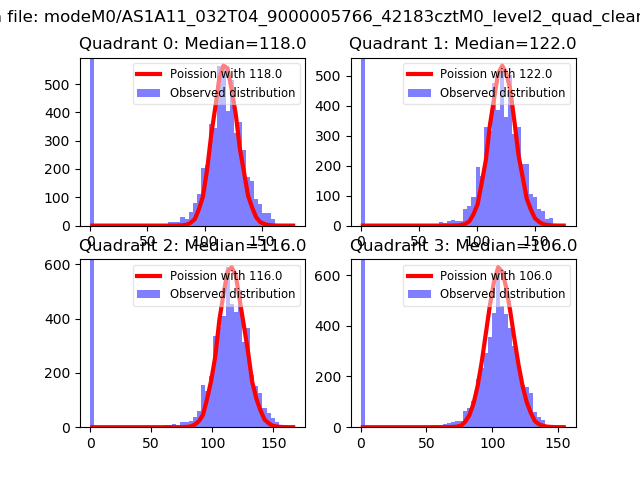 |
 |
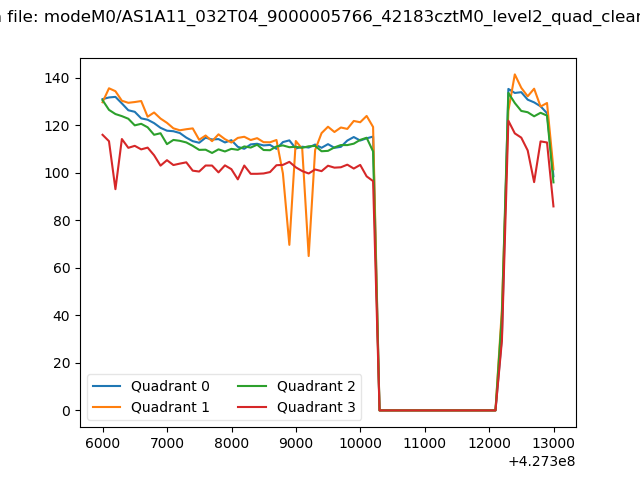
| Quadrant-wise count rates Data is divided into 100 sec bins |
 |
|
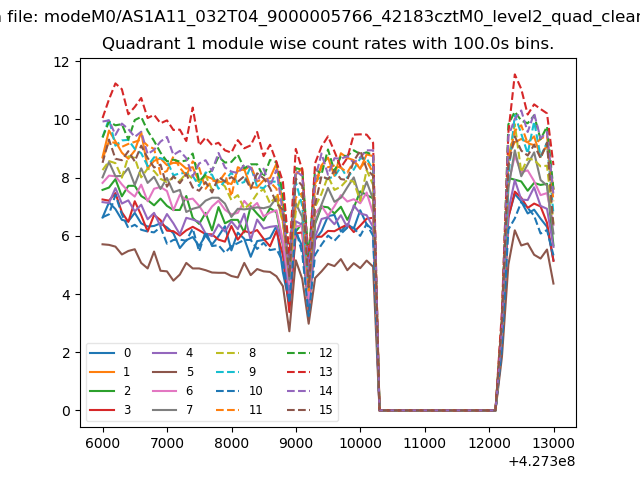
| Module-wise count rates for Quadrant A Data is divided into 100 sec bins |
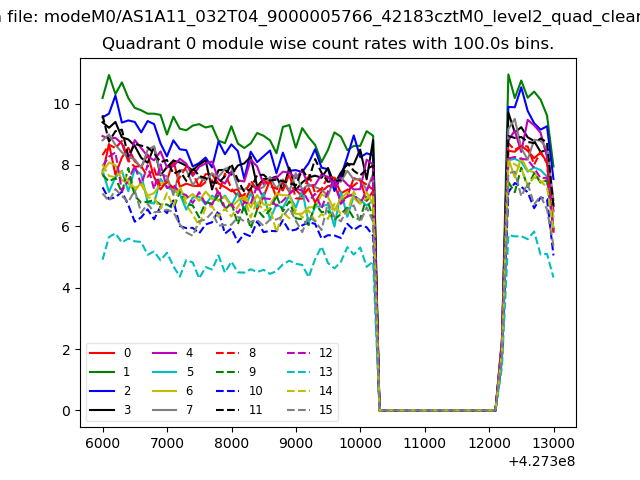 |
 |
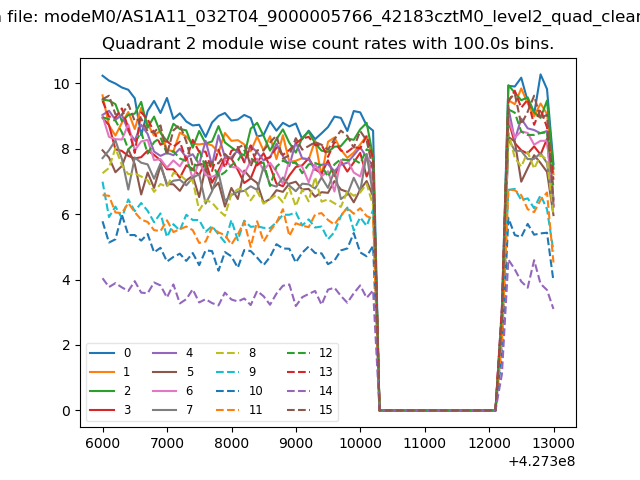
| Module-wise count rates for Quadrant B Data is divided into 100 sec bins |
 |
 |
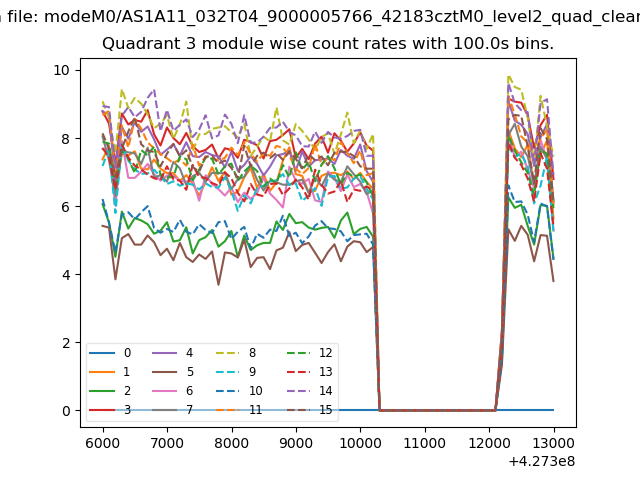
| Module-wise count rates for Quadrant C Data is divided into 100 sec bins |
 |
 |
| Module-wise count rates for Quadrant D Data is divided into 100 sec bins |
 |
 |
| Parameter | Plot |
|---|---|
| CZT HV Monitor | 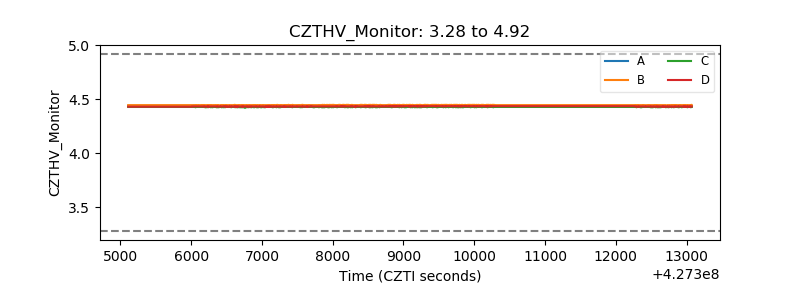 |
| D_VDD | 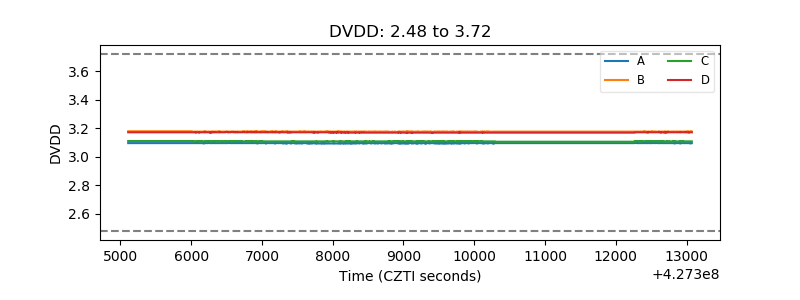 |
| Temperature 1 | 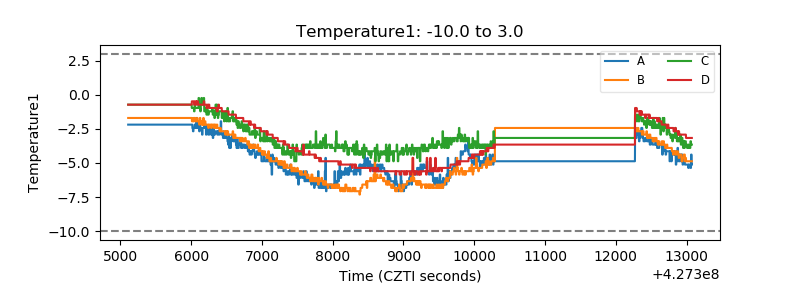 |
| Veto HV Monitor | 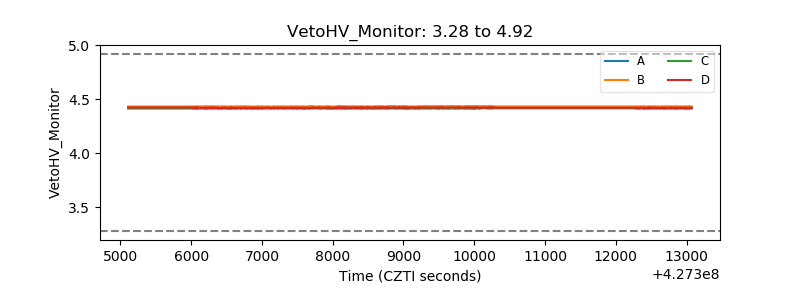 |
| Veto LLD | 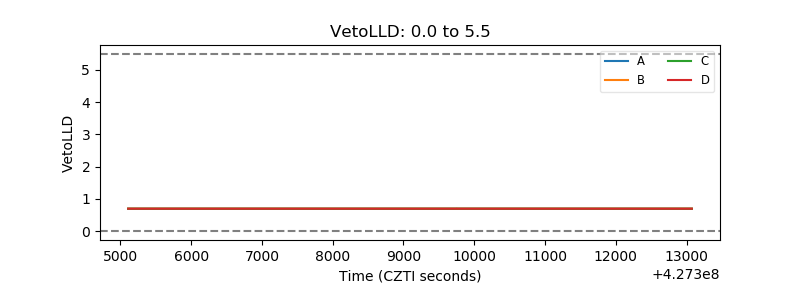 |
| Alpha Counter | 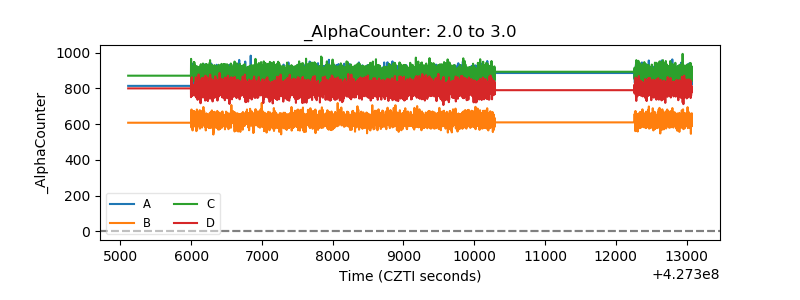 |
| _CPM_Rate | 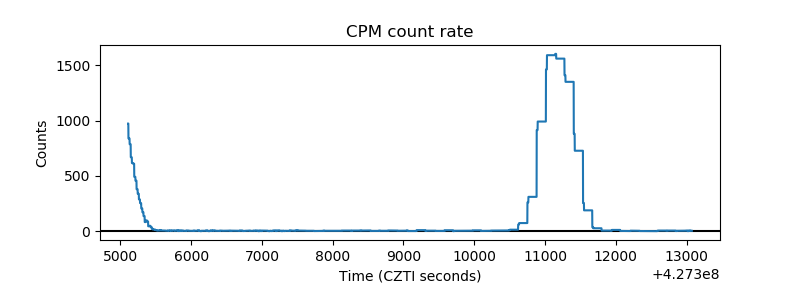 |
| CZT Counter | 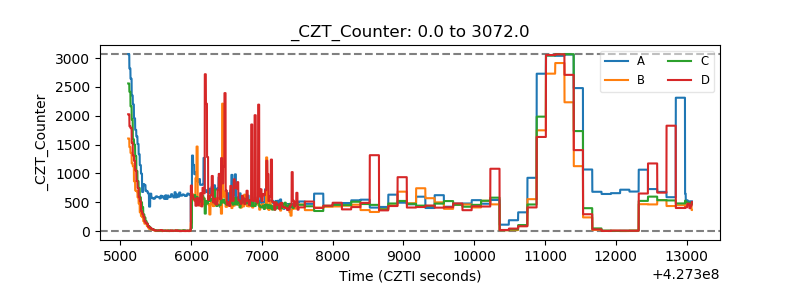 |
| +2.5 Volts monitor | 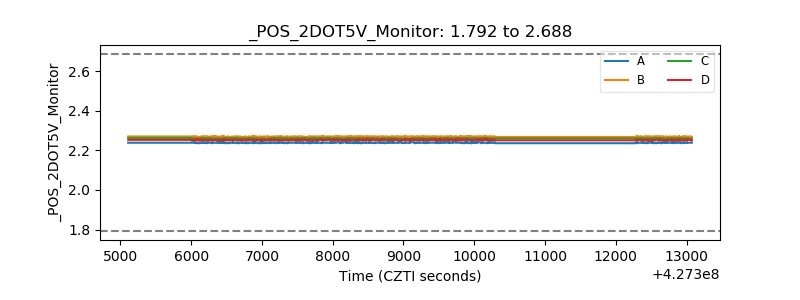 |
| +5 Volts monitor | 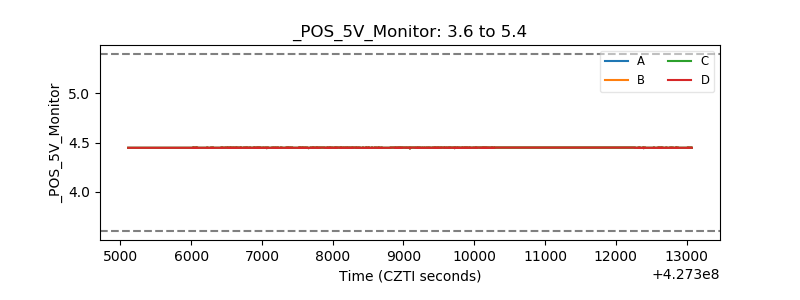 |
| _ROLL_ROT | 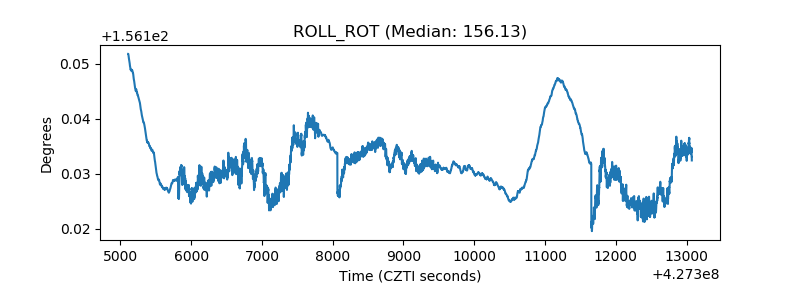 |
| _Roll_DEC | 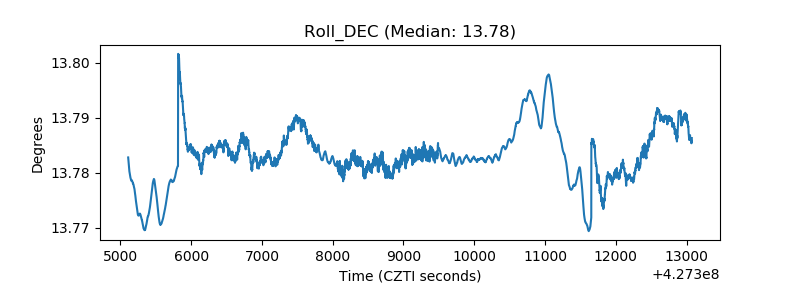 |
| _Roll_RA | 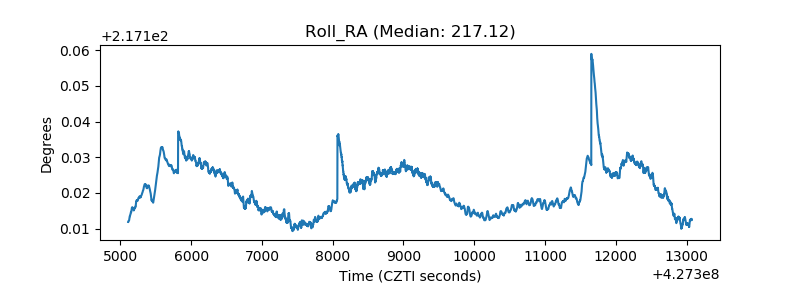 |
| Veto Counter | 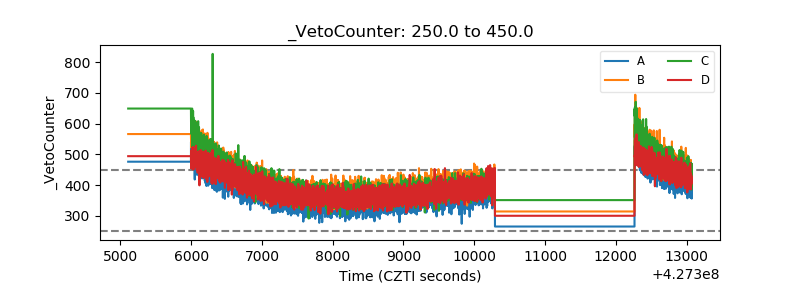 |