| Param | Original file | Final file |
|---|---|---|
| Filename | modeM0/AS1A11_032T04_9000005766_42184cztM0_level2.fits | modeM0/AS1A11_032T04_9000005766_42184cztM0_level2_quad_clean.evt |
| Size (bytes) | 87,897,600 | 25,940,160 |
| Size | 83.8 MB | 24.7 MB |
| Events in quadrant A | 862,189 | 176,327 |
| Events in quadrant B | 717,938 | 179,281 |
| Events in quadrant C | 671,463 | 171,155 |
| Events in quadrant D | 890,060 | 154,405 |
| Mode M0 | |||
|---|---|---|---|
| Quadrant | BADHDUFLAG | Total packets | Discarded packets |
| A | 0 | 3455 | 1 |
| B | 0 | 3063 | 1 |
| C | 0 | 2836 | 1 |
| D | 0 | 3590 | 1 |
| Mode M9 | |||
|---|---|---|---|
| Quadrant | BADHDUFLAG | Total packets | Discarded packets |
| A | 0 | 7 | 0 |
| B | 0 | 8 | 0 |
| C | 0 | 8 | 0 |
| D | 0 | 8 | 0 |
| Mode SS | |||
|---|---|---|---|
| Quadrant | BADHDUFLAG | Total packets | Discarded packets |
| A | 0 | 28 | 0 |
| B | 0 | 28 | 0 |
| C | 0 | 28 | 0 |
| D | 0 | 28 | 0 |
| Quadrant | Total seconds | Saturated seconds | Saturation percentage |
|---|---|---|---|
| A | 1401 | 14 | 0.999286% |
| B | 1401 | 18 | 1.284797% |
| C | 1401 | 1 | 0.071378% |
| D | 1401 | 48 | 3.426124% |
Noise dominated data is calculated using 1-second bins in cleaned event files. If a bin has >2000 counts, and if more than 50% of those come from <1% of pixels, then it is considered to be noise-dominated and hence unusable.
| Quadrant | # 1 sec bins | Bins with >0 counts | Bins with >2000 counts | High rate bins dominated by noise | Noise dominated (total time) | Noise dominated (detector-on time) | Marked lightcurve |
|---|---|---|---|---|---|---|---|
| A | 1401 | 1401 | 12 | 12 | 0.86% | 0.86% | 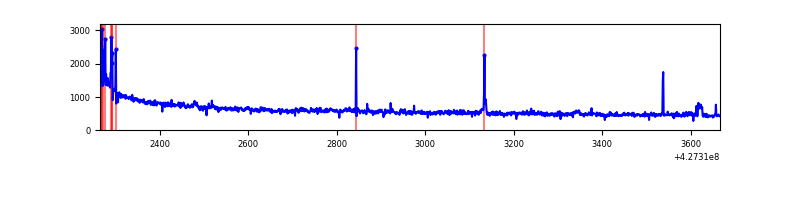 |
| B | 1401 | 1401 | 16 | 16 | 1.14% | 1.14% | 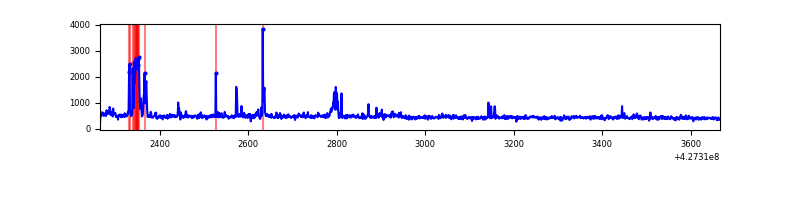 |
| C | 1401 | 1401 | 0 | 0 | 0.00% | 0.00% | 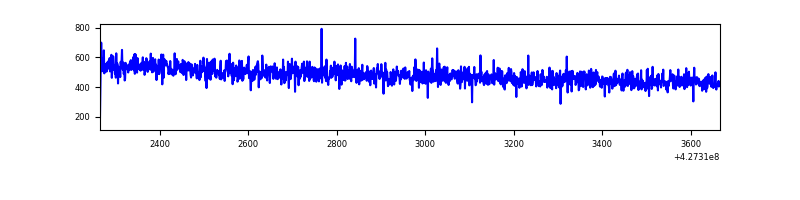 |
| D | 1401 | 1401 | 51 | 51 | 3.64% | 3.64% | 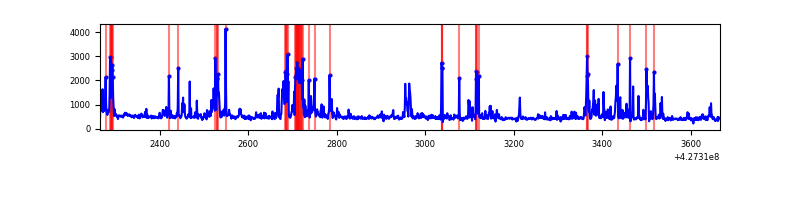 |
Top three noisy pixels from each quadrant. If the there are fewer than three noisy pixels in the level2.evt file, extra rows are filled as -1
| Pixel properties | Quadrant properties | ||||||
|---|---|---|---|---|---|---|---|
| Quadrant | DetID | PixID | Counts | Sigma | Mean | Median | Sigma |
| A | 10 | 83 | 201589 | 5978.87 | 157 | 154 | 33.7 |
| A | 15 | 223 | 39795 | 1176.6 | 157 | 154 | 33.7 |
| A | 13 | 248 | 7462 | 216.91 | 157 | 154 | 33.7 |
| B | 3 | 112 | 65400 | 2058.42 | 158 | 154 | 31.7 |
| B | 0 | 229 | 22649 | 709.68 | 158 | 154 | 31.7 |
| B | 15 | 35 | 6350 | 195.47 | 158 | 154 | 31.7 |
| C | 15 | 214 | 61112 | 1610.15 | 155 | 157 | 37.9 |
| C | 0 | 207 | 2336 | 57.56 | 155 | 157 | 37.9 |
| C | 13 | 61 | 1046 | 23.48 | 155 | 157 | 37.9 |
| D | 1 | 47 | 133533 | 3440.38 | 152 | 148 | 38.8 |
| D | 12 | 218 | 39996 | 1027.79 | 152 | 148 | 38.8 |
| D | 12 | 233 | 39945 | 1026.48 | 152 | 148 | 38.8 |
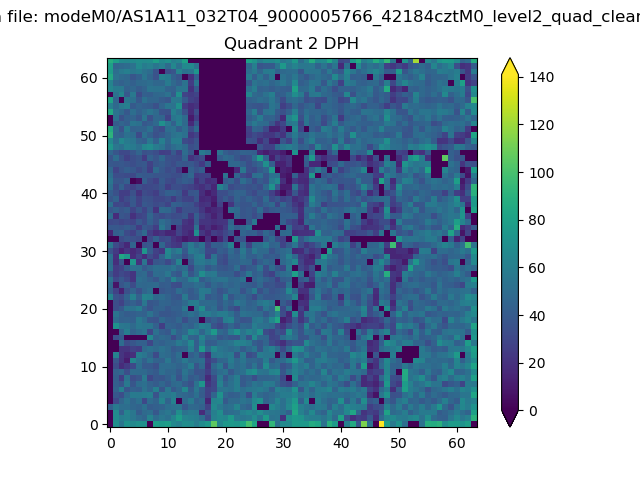
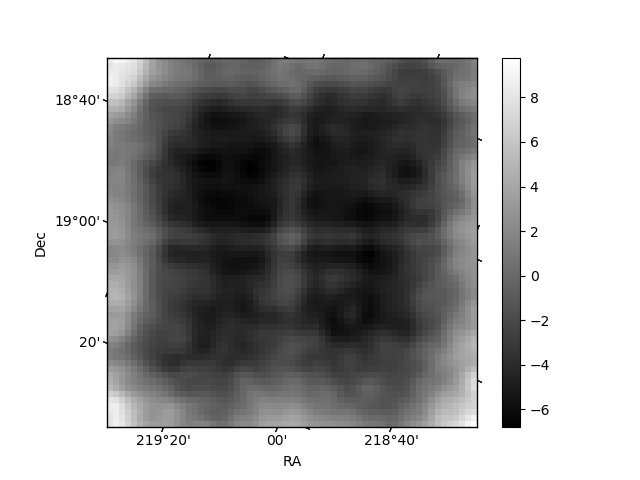
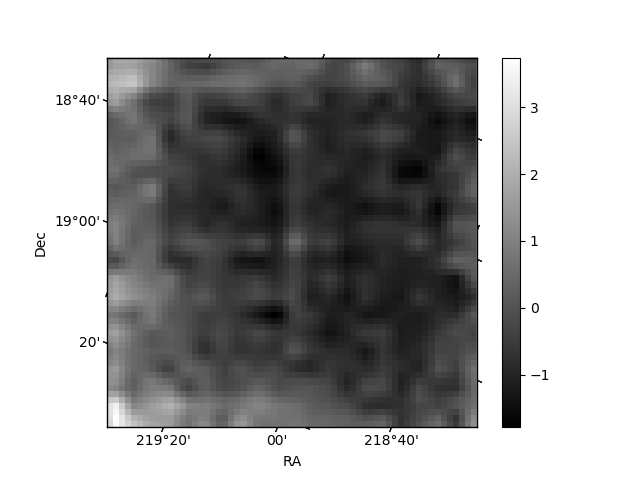
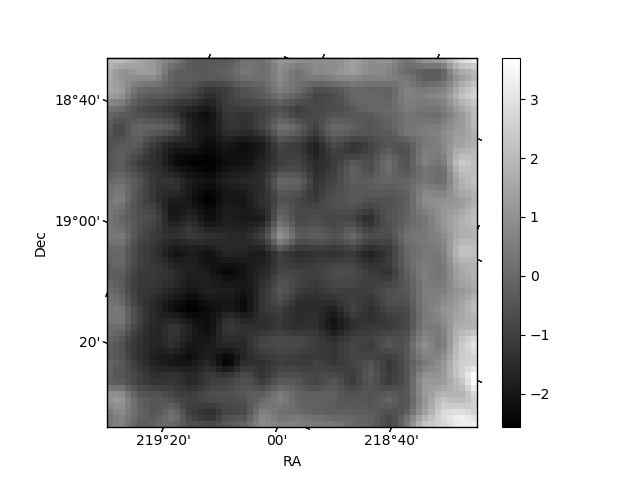
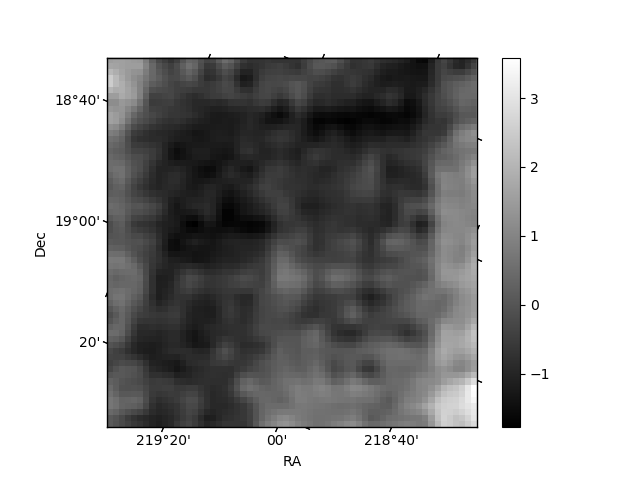
Histogram calculated using DETX and DETY for each event in the final _common_clean file
| Quadrant A | 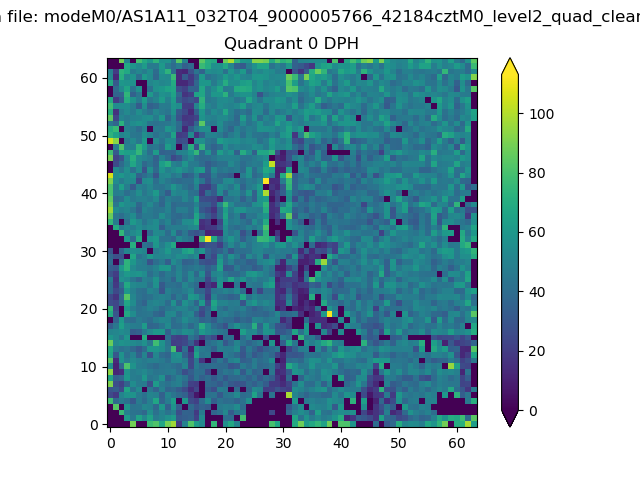 |
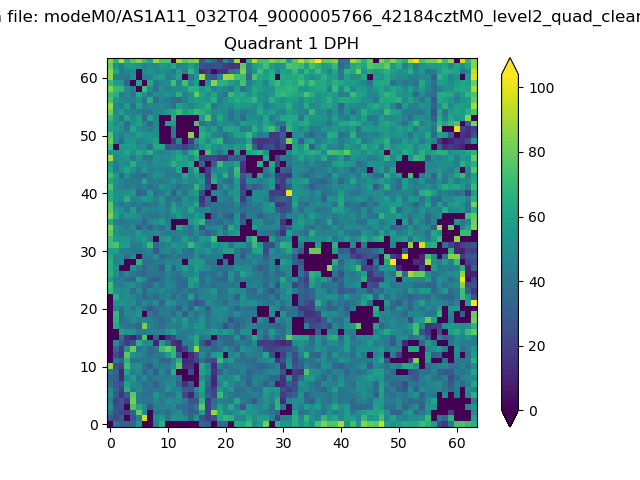 |
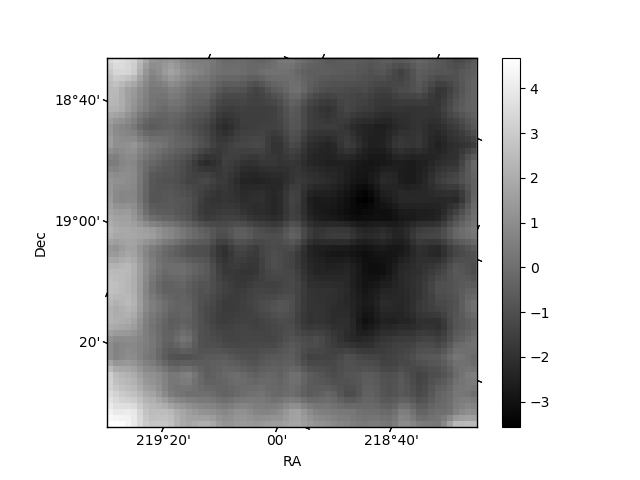
Quadrant B |
|---|---|---|---|
| Quadrant D | 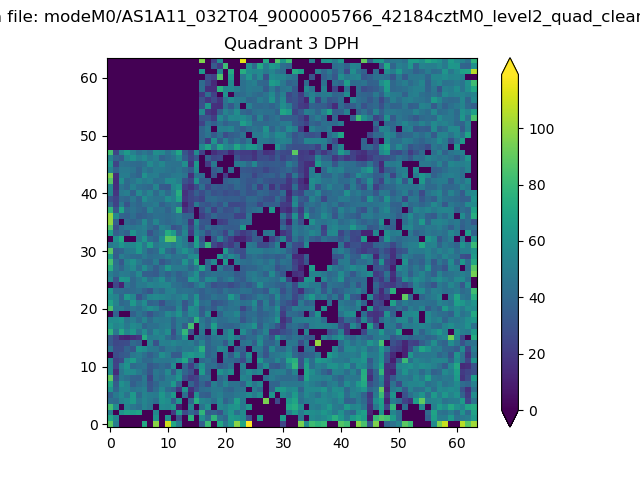 |
 |
Quadrant C |
| Plot type | Count rate plots | Images |
|---|---|---|
| Comparison with Poisson distribution Blue bars denote a histogram of data divided into 1 sec bins. Red curve is a Poisson curve with rate = median count rate of data. |
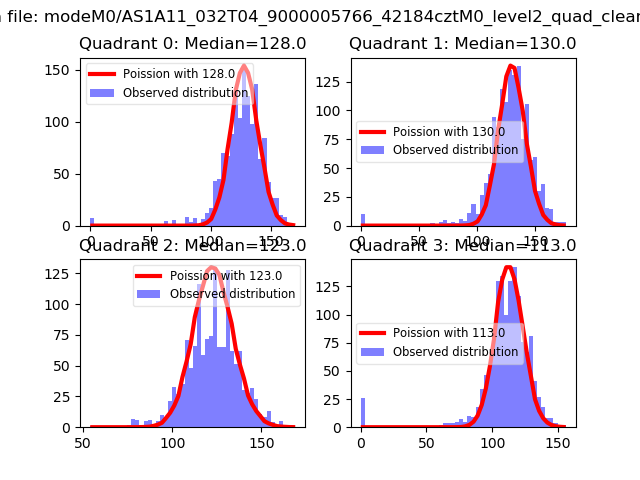 |
 |
| Quadrant-wise count rates Data is divided into 100 sec bins |
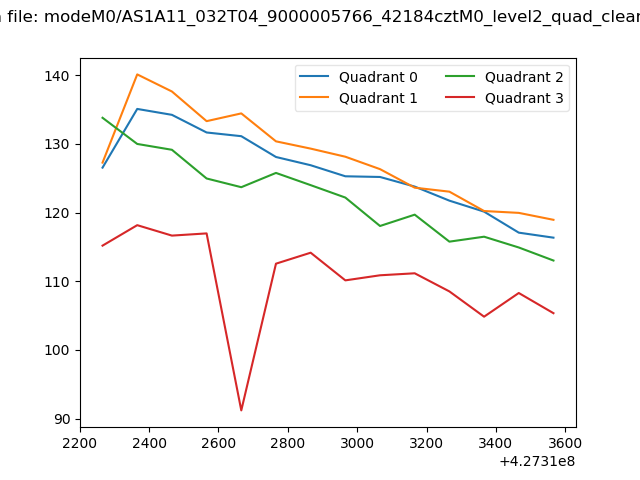 |
|
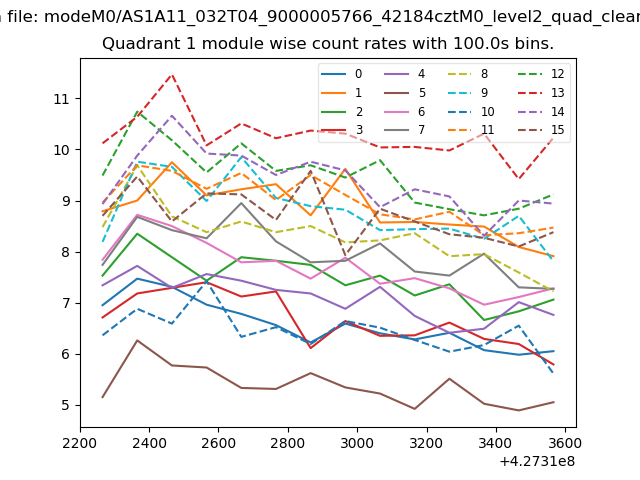
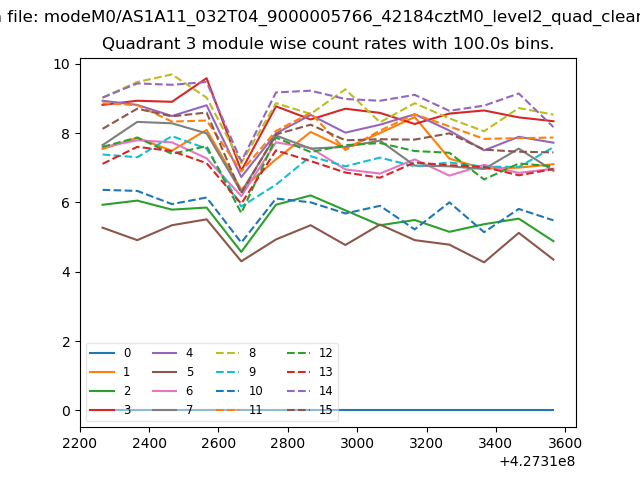
| Module-wise count rates for Quadrant A Data is divided into 100 sec bins |
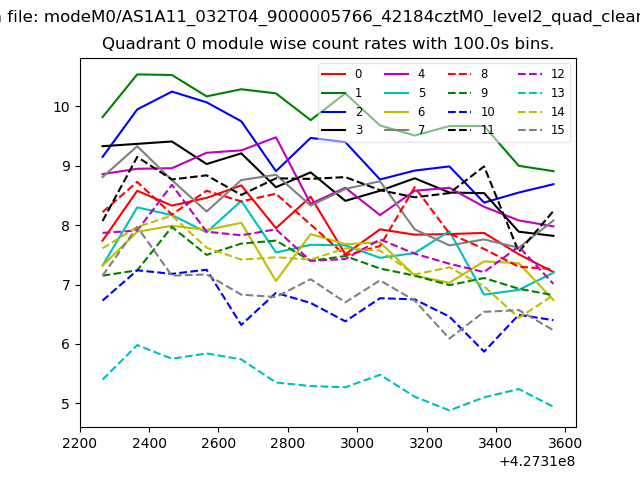 |
 |
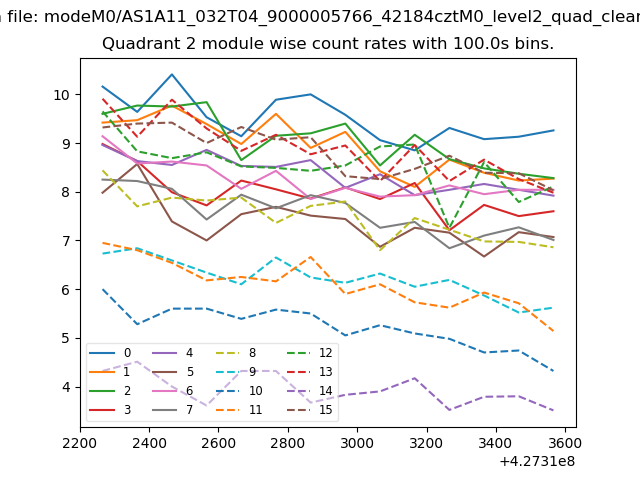
| Module-wise count rates for Quadrant B Data is divided into 100 sec bins |
 |
 |
| Module-wise count rates for Quadrant C Data is divided into 100 sec bins |
 |
 |
| Module-wise count rates for Quadrant D Data is divided into 100 sec bins |
 |
 |
| Parameter | Plot |
|---|---|
| CZT HV Monitor | 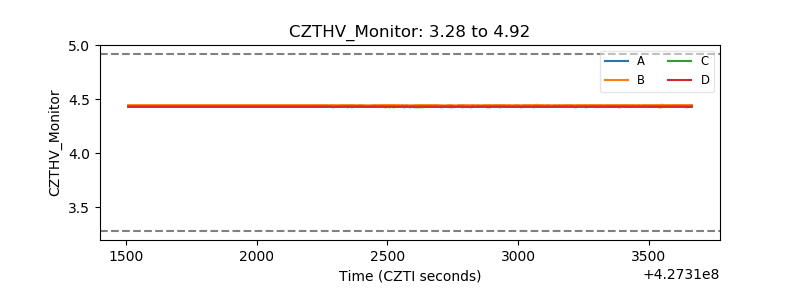 |
| D_VDD | 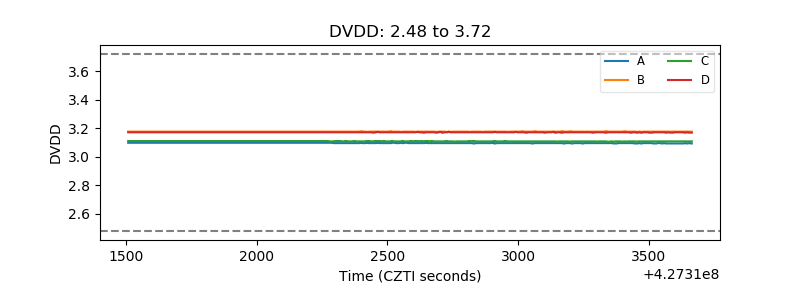 |
| Temperature 1 | 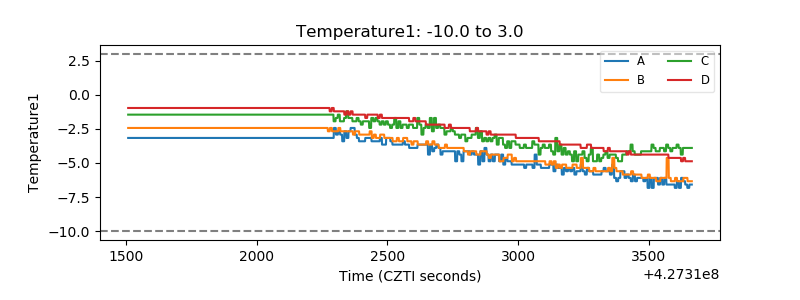 |
| Veto HV Monitor | 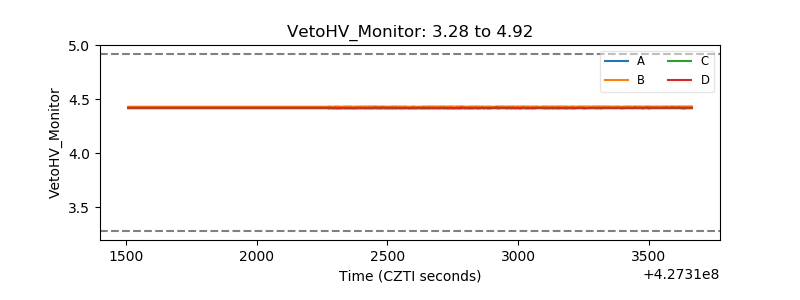 |
| Veto LLD | 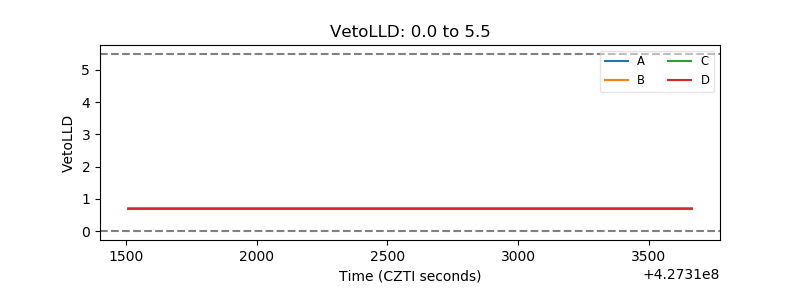 |
| Alpha Counter | 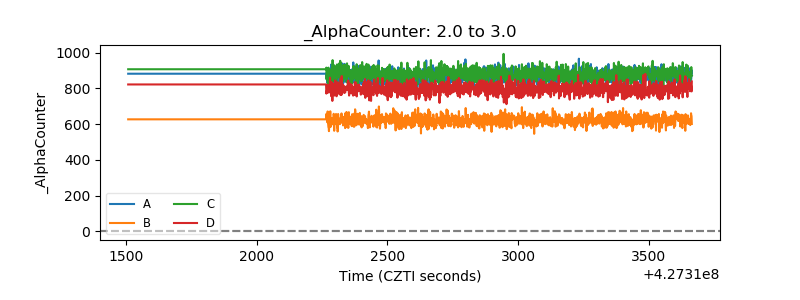 |
| _CPM_Rate |  |
| CZT Counter | 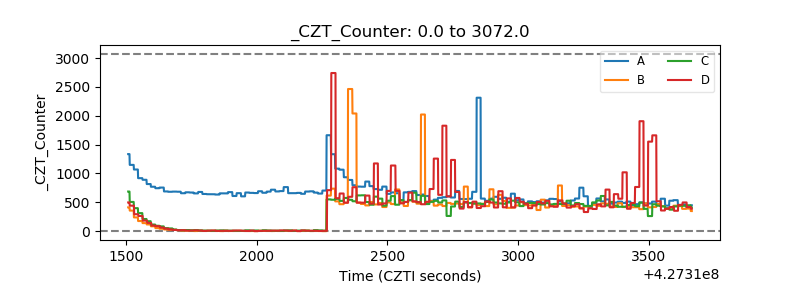 |
| +2.5 Volts monitor | 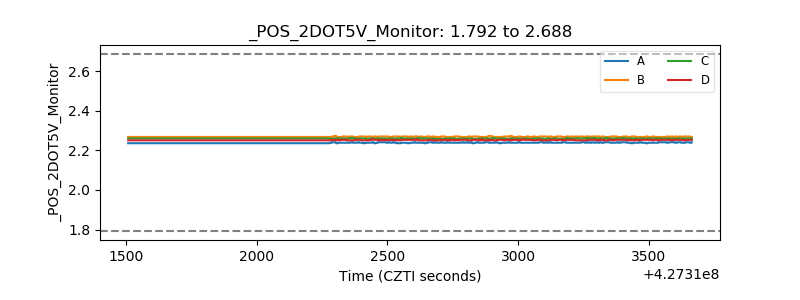 |
| +5 Volts monitor | 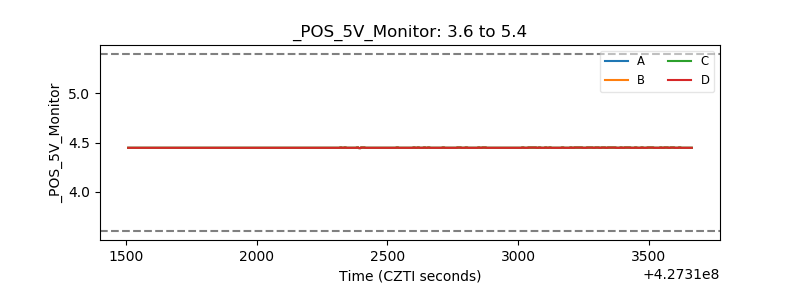 |
| _ROLL_ROT | 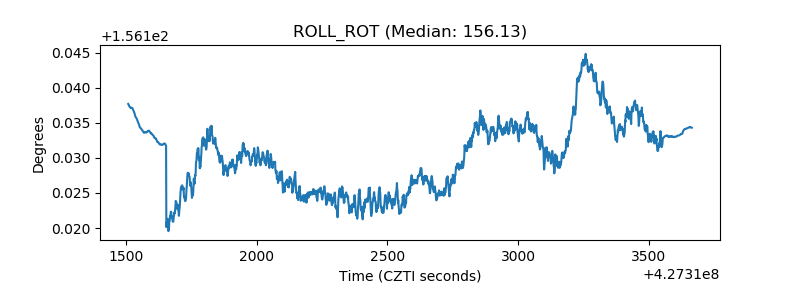 |
| _Roll_DEC | 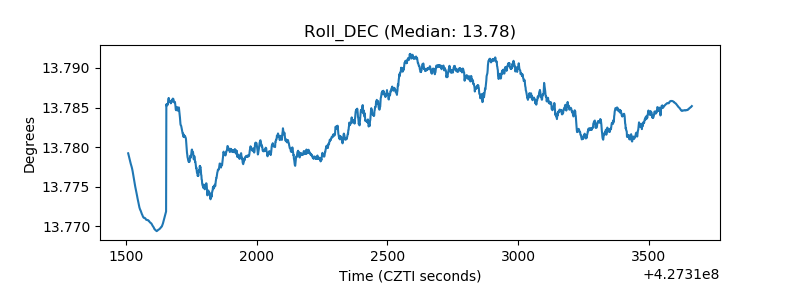 |
| _Roll_RA | 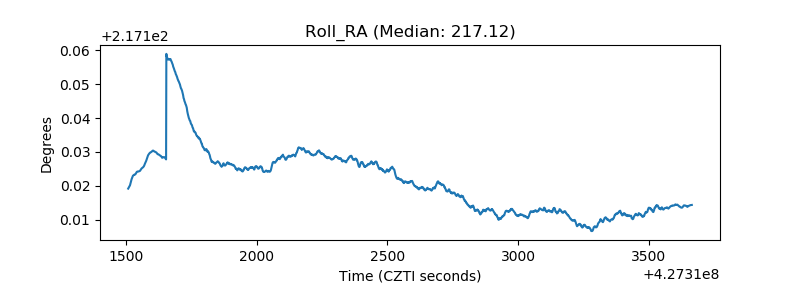 |
| Veto Counter | 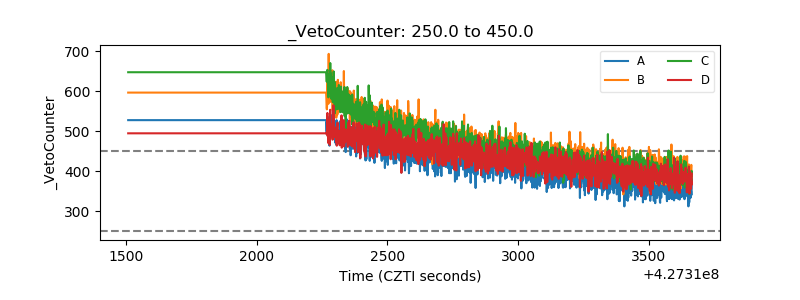 |