| Param | Original file | Final file |
|---|---|---|
| Filename | modeM0/AS1A12_088T21_9000005764_42158cztM0_level2.fits | modeM0/AS1A12_088T21_9000005764_42158cztM0_level2_quad_clean.evt |
| Size (bytes) | 15,310,080 | 4,348,800 |
| Size | 14.6 MB | 4.1 MB |
| Events in quadrant A | 136,285 | 27,249 |
| Events in quadrant B | 127,956 | 27,193 |
| Events in quadrant C | 120,909 | 26,018 |
| Events in quadrant D | 156,057 | 23,696 |
| Mode M0 | |||
|---|---|---|---|
| Quadrant | BADHDUFLAG | Total packets | Discarded packets |
| A | 0 | 561 | 0 |
| B | 0 | 577 | 0 |
| C | 0 | 556 | 0 |
| D | 0 | 662 | 0 |
| Mode SS | |||
|---|---|---|---|
| Quadrant | BADHDUFLAG | Total packets | Discarded packets |
| A | 0 | 6 | 0 |
| B | 0 | 6 | 0 |
| C | 0 | 6 | 0 |
| D | 0 | 6 | 0 |
| Quadrant | Total seconds | Saturated seconds | Saturation percentage |
|---|---|---|---|
| A | 278 | 0 | 0.000000% |
| B | 278 | 0 | 0.000000% |
| C | 278 | 0 | 0.000000% |
| D | 278 | 2 | 0.719424% |
Noise dominated data is calculated using 1-second bins in cleaned event files. If a bin has >2000 counts, and if more than 50% of those come from <1% of pixels, then it is considered to be noise-dominated and hence unusable.
| Quadrant | # 1 sec bins | Bins with >0 counts | Bins with >2000 counts | High rate bins dominated by noise | Noise dominated (total time) | Noise dominated (detector-on time) | Marked lightcurve |
|---|---|---|---|---|---|---|---|
| A | 278 | 278 | 0 | 0 | 0.00% | 0.00% | 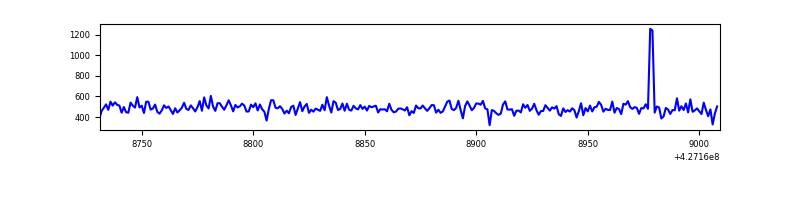 |
| B | 278 | 278 | 0 | 0 | 0.00% | 0.00% | 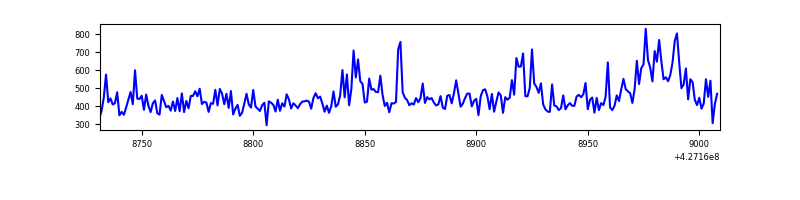 |
| C | 278 | 278 | 0 | 0 | 0.00% | 0.00% | 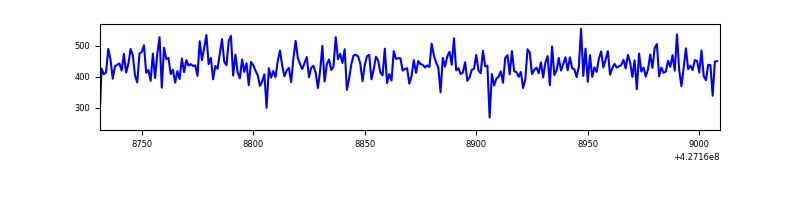 |
| D | 278 | 278 | 3 | 3 | 1.08% | 1.08% | 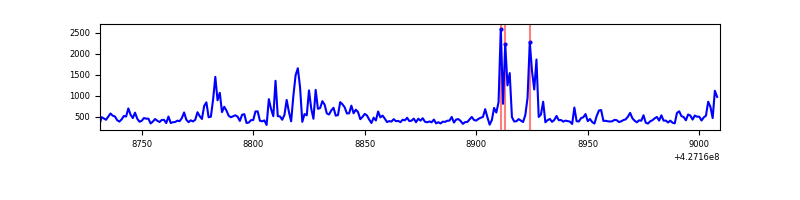 |
Top three noisy pixels from each quadrant. If the there are fewer than three noisy pixels in the level2.evt file, extra rows are filled as -1
| Pixel properties | Quadrant properties | ||||||
|---|---|---|---|---|---|---|---|
| Quadrant | DetID | PixID | Counts | Sigma | Mean | Median | Sigma |
| A | 10 | 83 | 23684 | 2944.14 | 28 | 27 | 8.0 |
| A | 13 | 248 | 1737 | 212.81 | 28 | 27 | 8.0 |
| A | 15 | 223 | 921 | 111.26 | 28 | 27 | 8.0 |
| B | 5 | 255 | 6767 | 850.08 | 28 | 27 | 7.9 |
| B | 15 | 35 | 3354 | 419.62 | 28 | 27 | 7.9 |
| B | 0 | 229 | 3135 | 392.0 | 28 | 27 | 7.9 |
| C | 15 | 214 | 11053 | 1294.46 | 28 | 28 | 8.5 |
| C | 13 | 61 | 196 | 19.73 | 28 | 28 | 8.5 |
| C | 0 | 239 | 125 | 11.39 | 28 | 28 | 8.5 |
| D | 12 | 6 | 30833 | 3577.39 | 27 | 26 | 8.6 |
| D | 12 | 33 | 10119 | 1172.03 | 27 | 26 | 8.6 |
| D | 6 | 252 | 3336 | 384.37 | 27 | 26 | 8.6 |
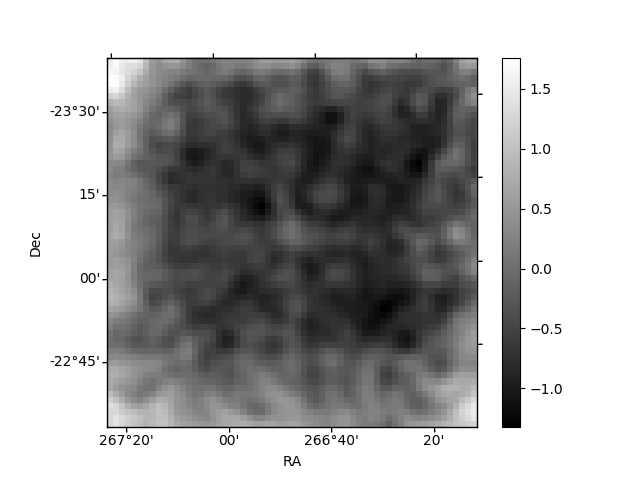
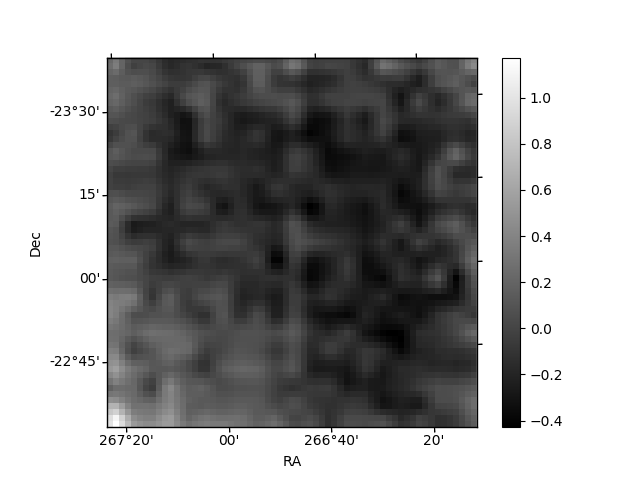
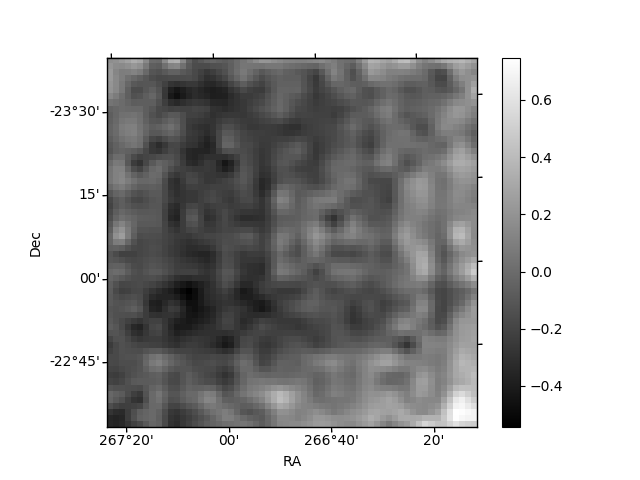
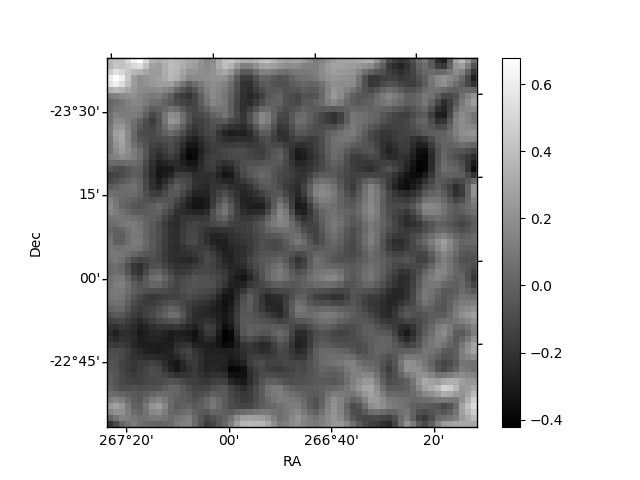
Histogram calculated using DETX and DETY for each event in the final _common_clean file
| Quadrant A | 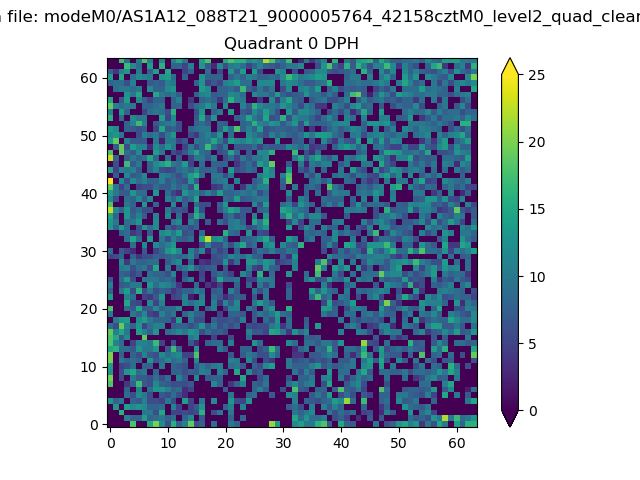 |
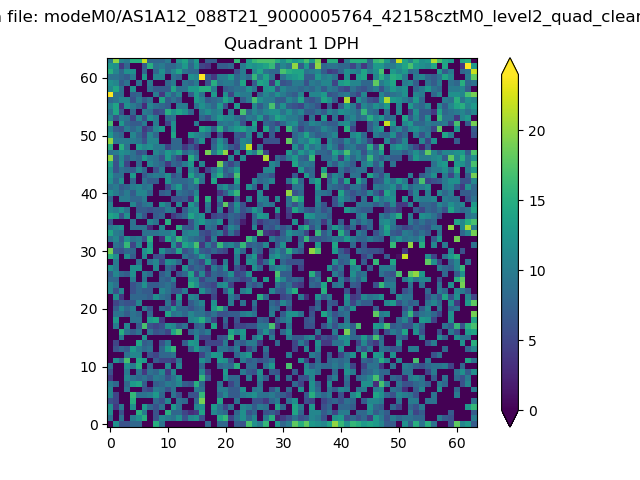 |
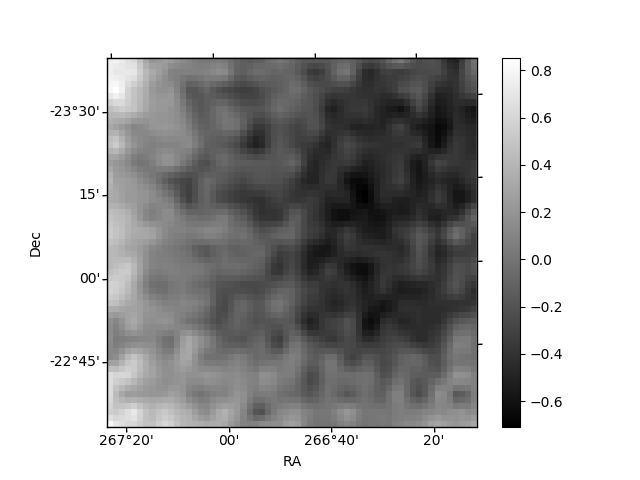
Quadrant B |
|---|---|---|---|
| Quadrant D | 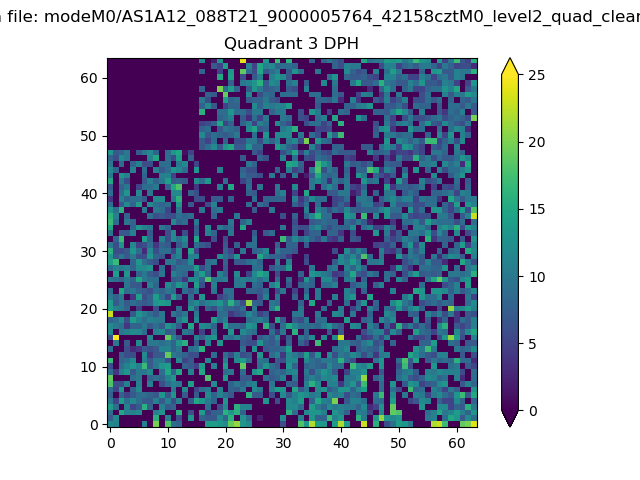 |
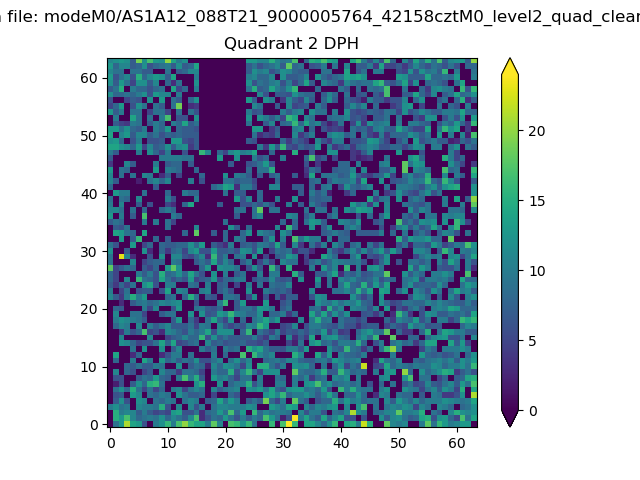 |
Quadrant C |
| Plot type | Count rate plots | Images |
|---|---|---|
| Comparison with Poisson distribution Blue bars denote a histogram of data divided into 1 sec bins. Red curve is a Poisson curve with rate = median count rate of data. |
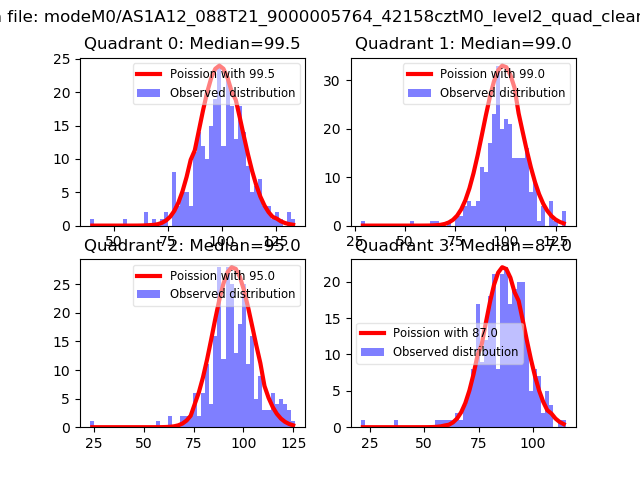 |
 |
| Quadrant-wise count rates Data is divided into 100 sec bins |
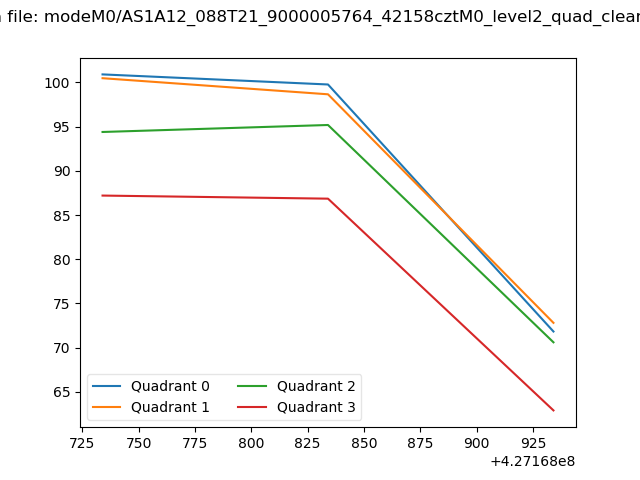 |
|
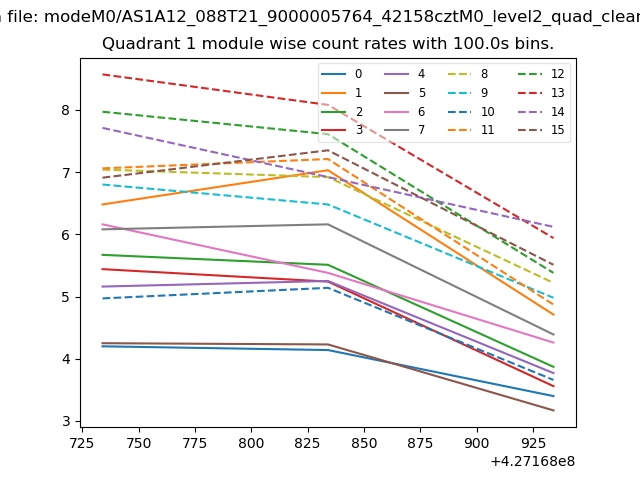
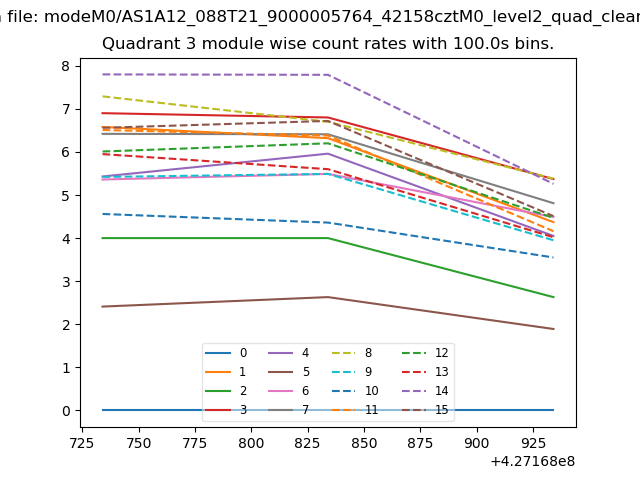
| Module-wise count rates for Quadrant A Data is divided into 100 sec bins |
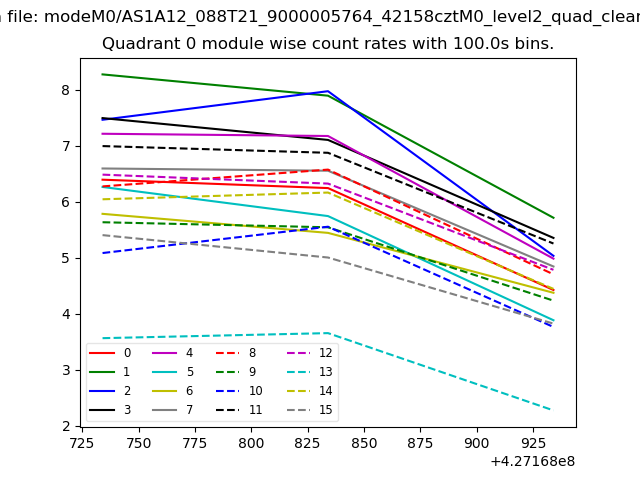 |
 |
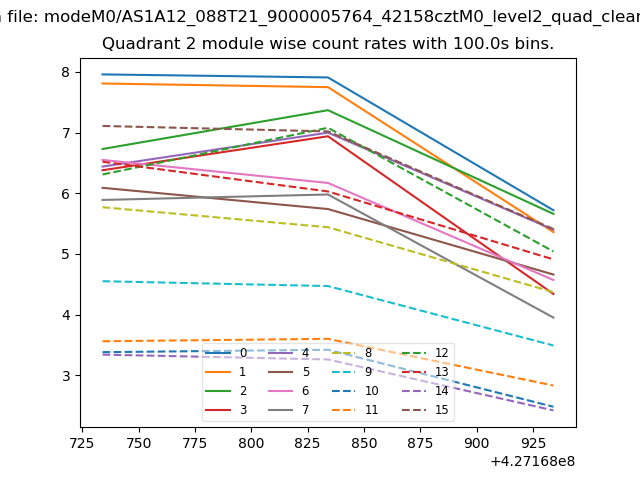
| Module-wise count rates for Quadrant B Data is divided into 100 sec bins |
 |
 |
| Module-wise count rates for Quadrant C Data is divided into 100 sec bins |
 |
 |
| Module-wise count rates for Quadrant D Data is divided into 100 sec bins |
 |
 |
| Parameter | Plot |
|---|---|
| CZT HV Monitor | 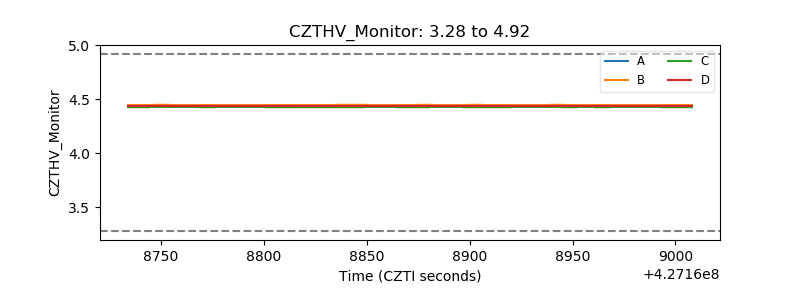 |
| D_VDD | 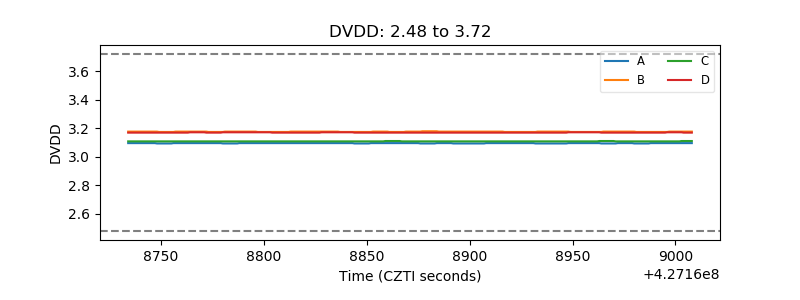 |
| Temperature 1 | 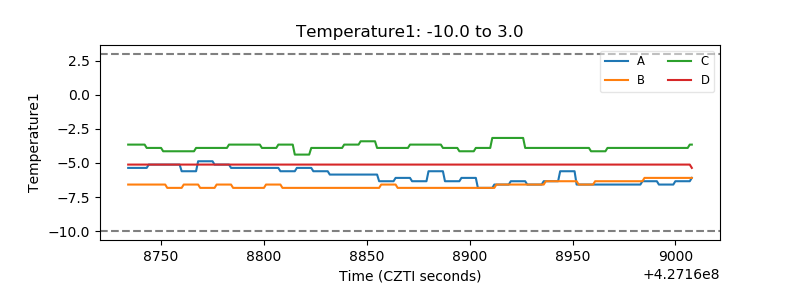 |
| Veto HV Monitor | 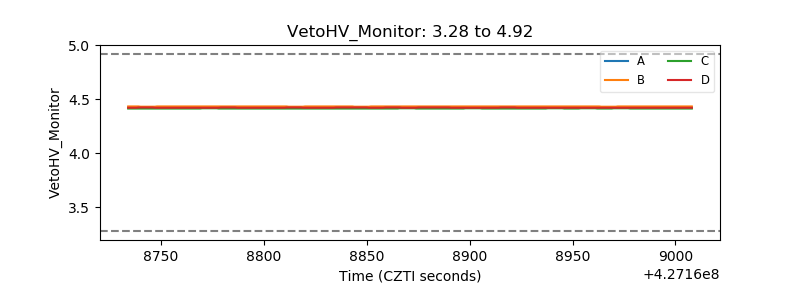 |
| Veto LLD |  |
| Alpha Counter |  |
| _CPM_Rate |  |
| CZT Counter | 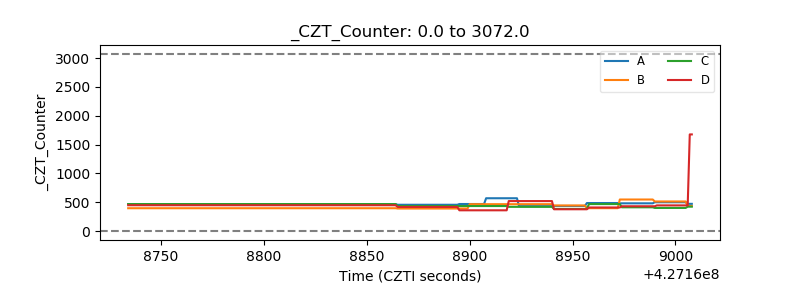 |
| +2.5 Volts monitor | 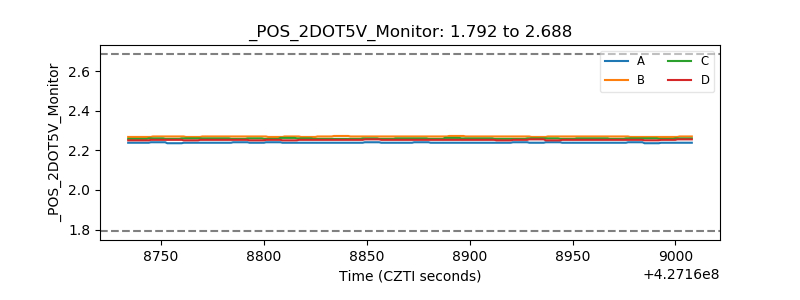 |
| +5 Volts monitor |  |
| _ROLL_ROT | 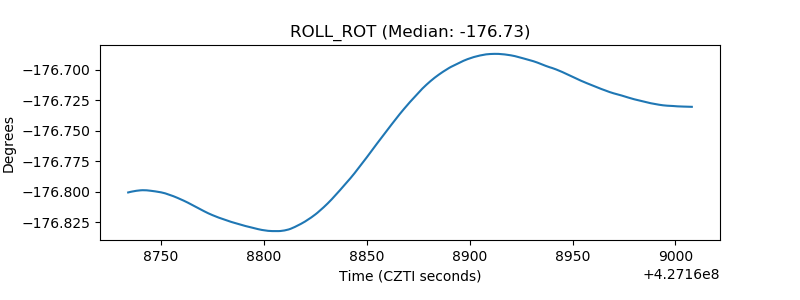 |
| _Roll_DEC | 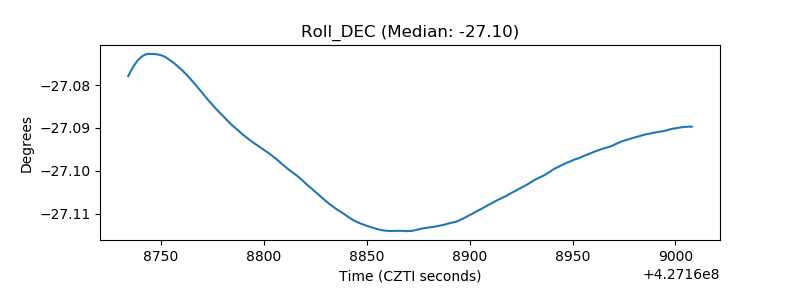 |
| _Roll_RA | 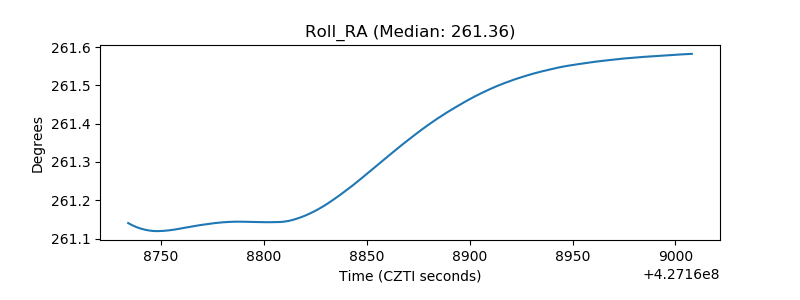 |
| Veto Counter | 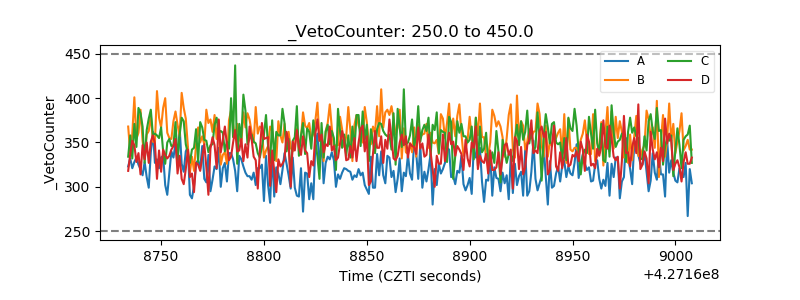 |