| Param | Original file | Final file |
|---|---|---|
| Filename | modeM0/AS1A12_088T21_9000005764_42159cztM0_level2.fits | modeM0/AS1A12_088T21_9000005764_42159cztM0_level2_quad_clean.evt |
| Size (bytes) | 326,669,760 | 77,002,560 |
| Size | 311.5 MB | 73.4 MB |
| Events in quadrant A | 2,943,268 | 516,520 |
| Events in quadrant B | 2,435,247 | 531,835 |
| Events in quadrant C | 2,221,216 | 508,658 |
| Events in quadrant D | 4,116,257 | 436,284 |
| Mode M0 | |||
|---|---|---|---|
| Quadrant | BADHDUFLAG | Total packets | Discarded packets |
| A | 0 | 11772 | 1 |
| B | 0 | 10596 | 1 |
| C | 0 | 9722 | 1 |
| D | 0 | 15615 | 2 |
| Mode M9 | |||
|---|---|---|---|
| Quadrant | BADHDUFLAG | Total packets | Discarded packets |
| A | 0 | 17 | 0 |
| B | 0 | 17 | 0 |
| C | 0 | 17 | 0 |
| D | 0 | 17 | 0 |
| Mode SS | |||
|---|---|---|---|
| Quadrant | BADHDUFLAG | Total packets | Discarded packets |
| A | 0 | 96 | 0 |
| B | 0 | 96 | 0 |
| C | 0 | 96 | 0 |
| D | 0 | 96 | 0 |
| Quadrant | Total seconds | Saturated seconds | Saturation percentage |
|---|---|---|---|
| A | 4828 | 92 | 1.905551% |
| B | 4828 | 86 | 1.781276% |
| C | 4828 | 1 | 0.020713% |
| D | 4827 | 443 | 9.177543% |
Noise dominated data is calculated using 1-second bins in cleaned event files. If a bin has >2000 counts, and if more than 50% of those come from <1% of pixels, then it is considered to be noise-dominated and hence unusable.
| Quadrant | # 1 sec bins | Bins with >0 counts | Bins with >2000 counts | High rate bins dominated by noise | Noise dominated (total time) | Noise dominated (detector-on time) | Marked lightcurve |
|---|---|---|---|---|---|---|---|
| A | 6471 | 4829 | 85 | 85 | 1.31% | 1.76% | 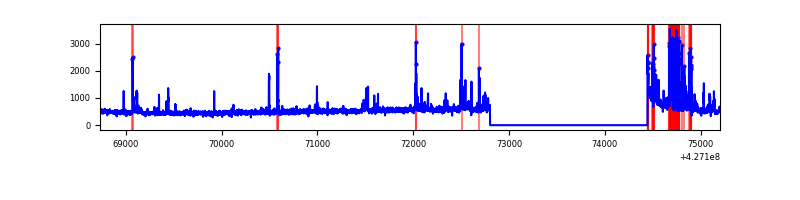 |
| B | 6471 | 4829 | 48 | 48 | 0.74% | 0.99% | 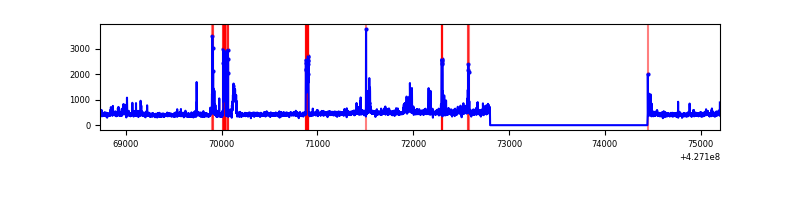 |
| C | 6471 | 4829 | 0 | 0 | 0.00% | 0.00% | 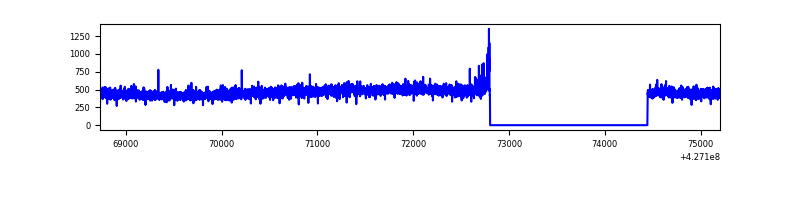 |
| D | 6469 | 4827 | 388 | 388 | 6.00% | 8.04% | 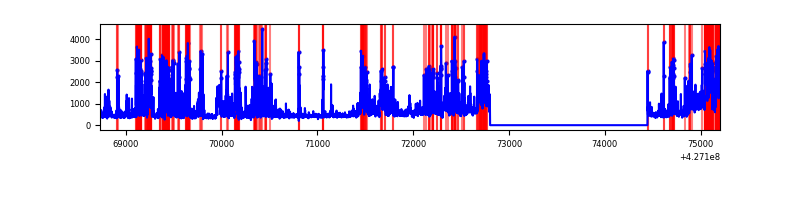 |
Top three noisy pixels from each quadrant. If the there are fewer than three noisy pixels in the level2.evt file, extra rows are filled as -1
| Pixel properties | Quadrant properties | ||||||
|---|---|---|---|---|---|---|---|
| Quadrant | DetID | PixID | Counts | Sigma | Mean | Median | Sigma |
| A | 10 | 83 | 412759 | 3800.25 | 521 | 509 | 108.5 |
| A | 15 | 222 | 389656 | 3587.28 | 521 | 509 | 108.5 |
| A | 12 | 189 | 67485 | 617.41 | 521 | 509 | 108.5 |
| B | 15 | 35 | 189519 | 1853.63 | 520 | 506 | 102.0 |
| B | 0 | 229 | 66074 | 643.02 | 520 | 506 | 102.0 |
| B | 5 | 255 | 45945 | 445.62 | 520 | 506 | 102.0 |
| C | 15 | 214 | 197507 | 1628.62 | 513 | 516 | 121.0 |
| C | 15 | 111 | 15873 | 126.96 | 513 | 516 | 121.0 |
| C | 13 | 61 | 3519 | 24.83 | 513 | 516 | 121.0 |
| D | 12 | 6 | 898036 | 7393.09 | 492 | 478 | 121.4 |
| D | 1 | 52 | 392865 | 3232.05 | 492 | 478 | 121.4 |
| D | 12 | 33 | 337631 | 2777.09 | 492 | 478 | 121.4 |
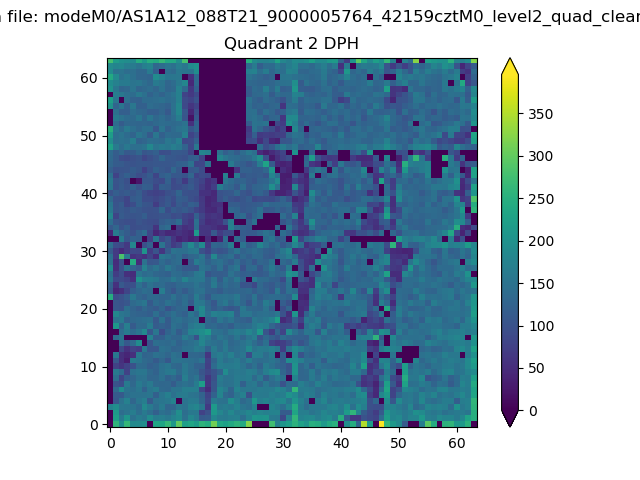
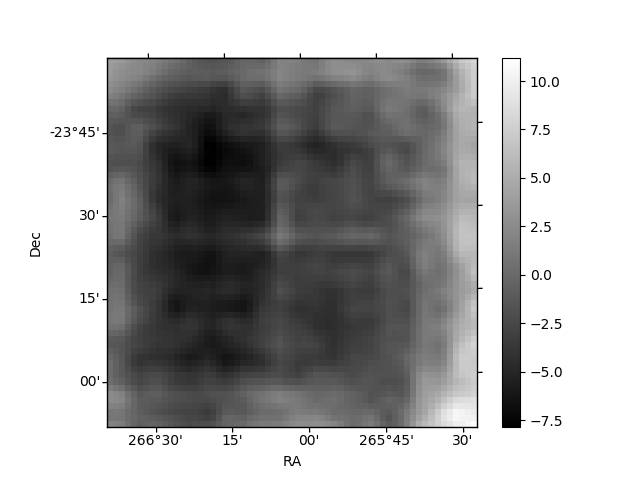
Histogram calculated using DETX and DETY for each event in the final _common_clean file
| Quadrant A | 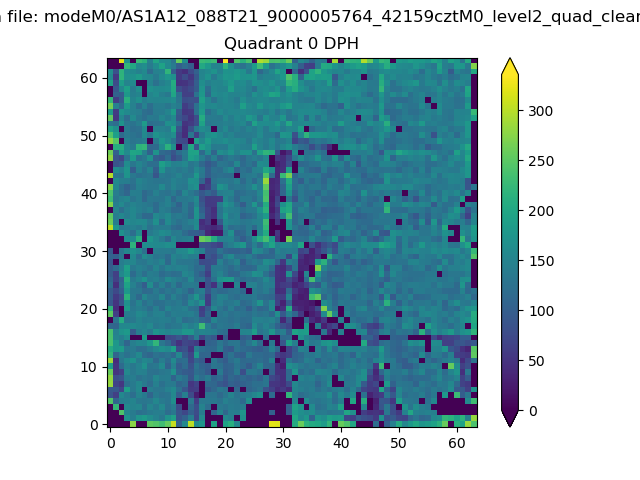 |
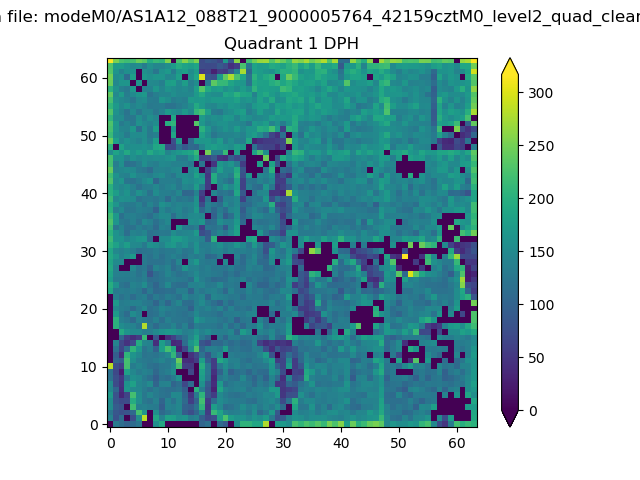 |
Quadrant B |
|---|---|---|---|
| Quadrant D | 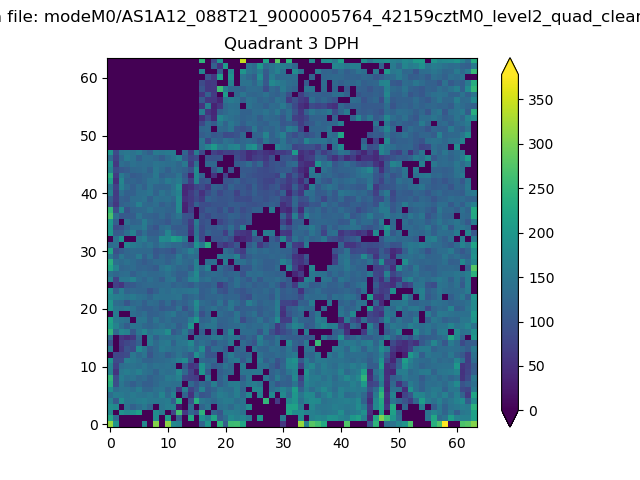 |
 |
Quadrant C |
| Plot type | Count rate plots | Images |
|---|---|---|
| Comparison with Poisson distribution Blue bars denote a histogram of data divided into 1 sec bins. Red curve is a Poisson curve with rate = median count rate of data. |
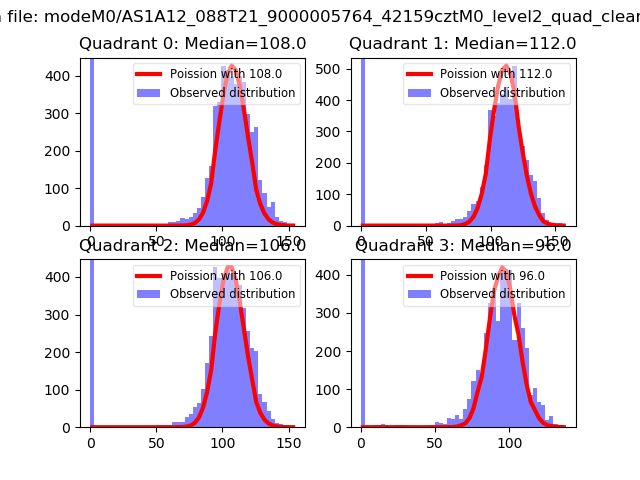 |
 |
| Quadrant-wise count rates Data is divided into 100 sec bins |
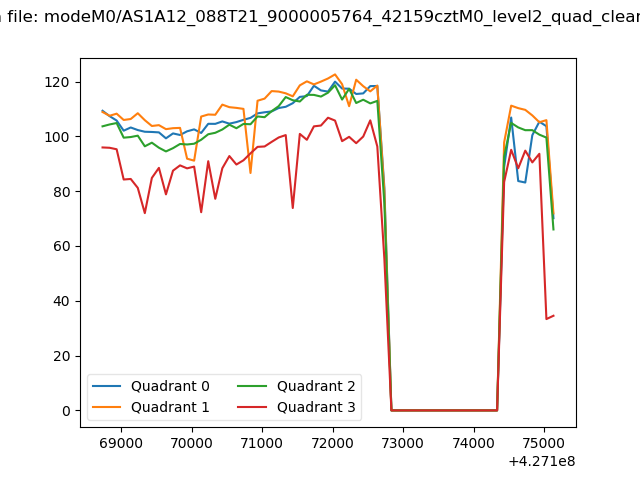 |
|
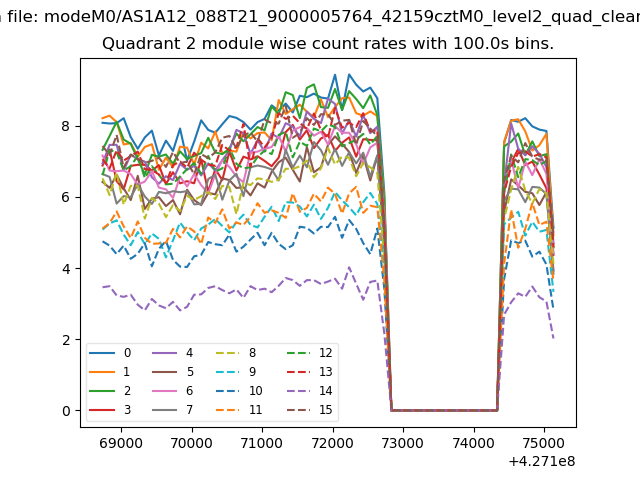
| Module-wise count rates for Quadrant A Data is divided into 100 sec bins |
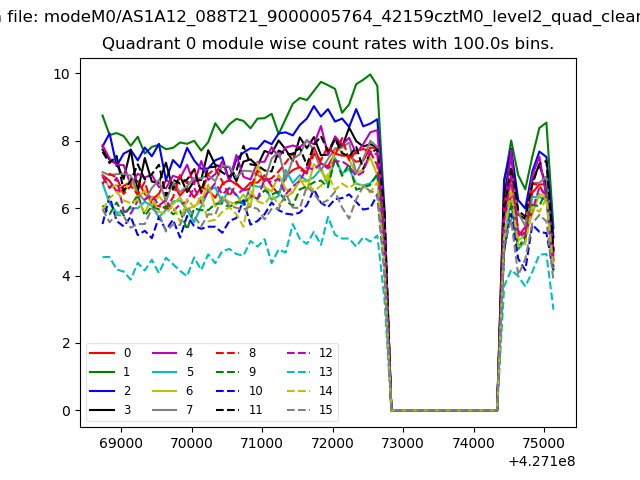 |
 |
| Module-wise count rates for Quadrant B Data is divided into 100 sec bins |
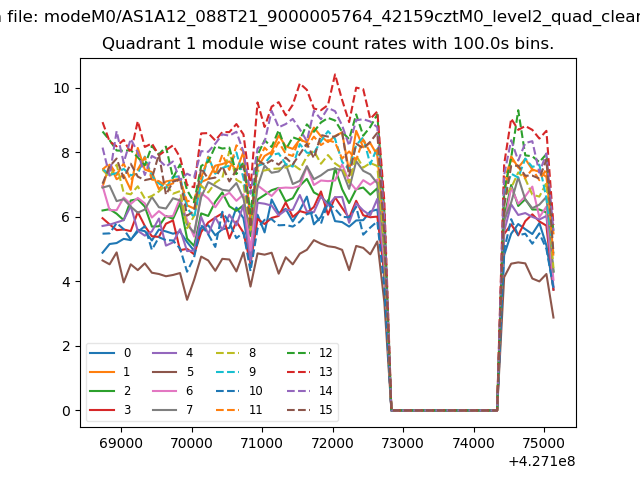 |
 |
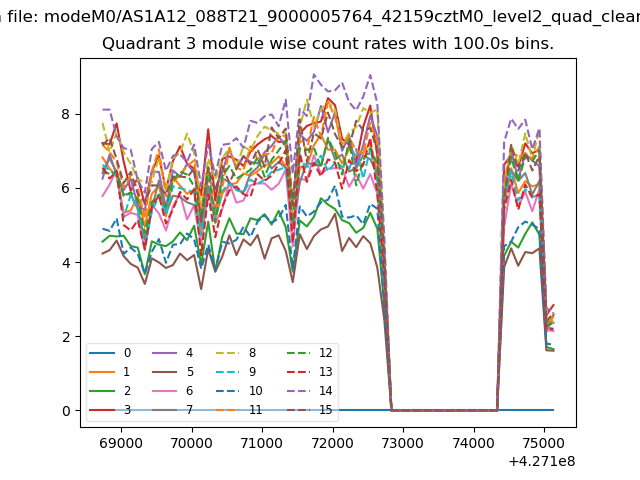
| Module-wise count rates for Quadrant C Data is divided into 100 sec bins |
 |
 |
| Module-wise count rates for Quadrant D Data is divided into 100 sec bins |
 |
 |
| Parameter | Plot |
|---|---|
| CZT HV Monitor | 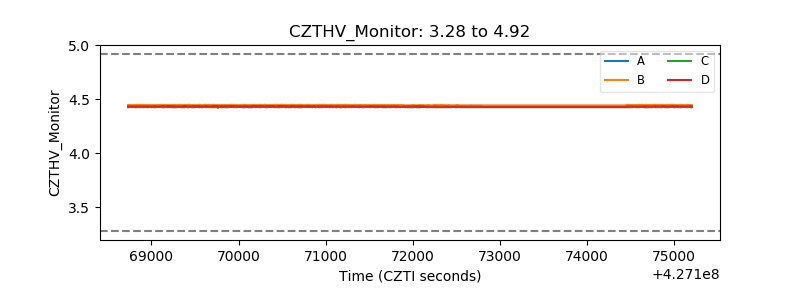 |
| D_VDD | 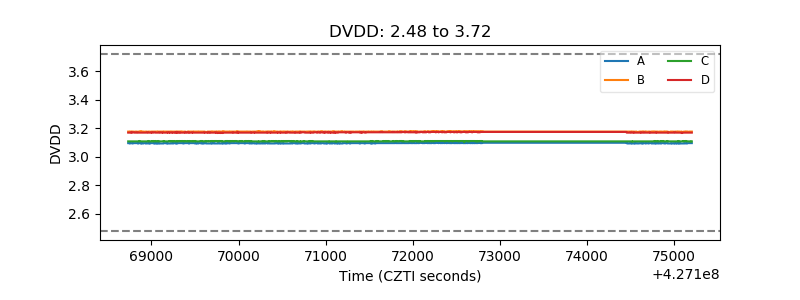 |
| Temperature 1 | 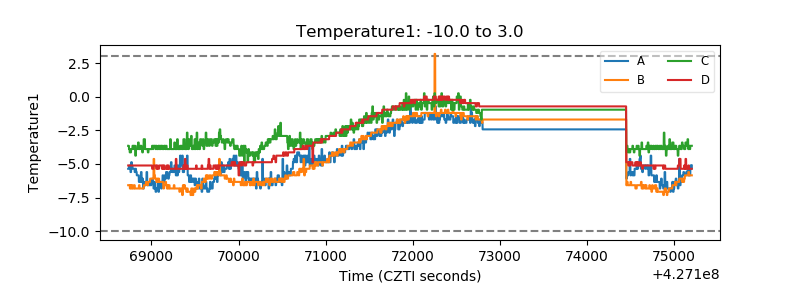 |
| Veto HV Monitor | 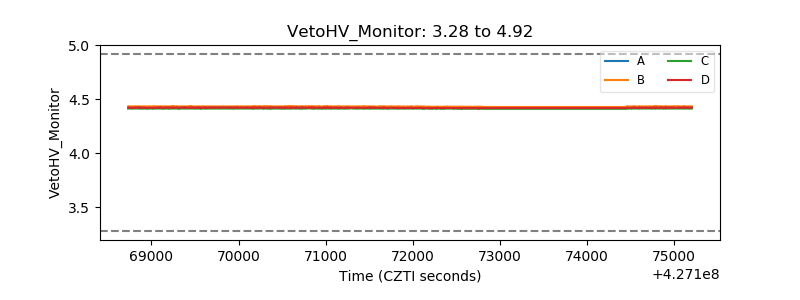 |
| Veto LLD | 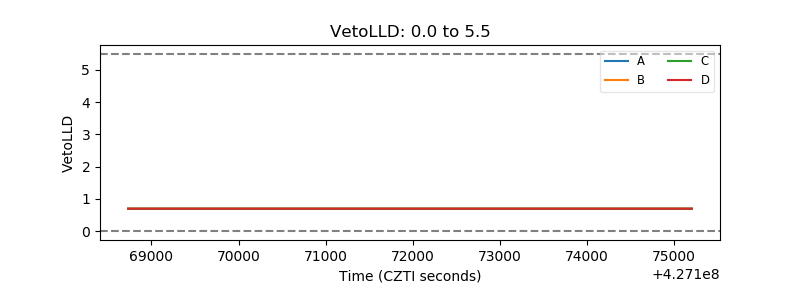 |
| Alpha Counter | 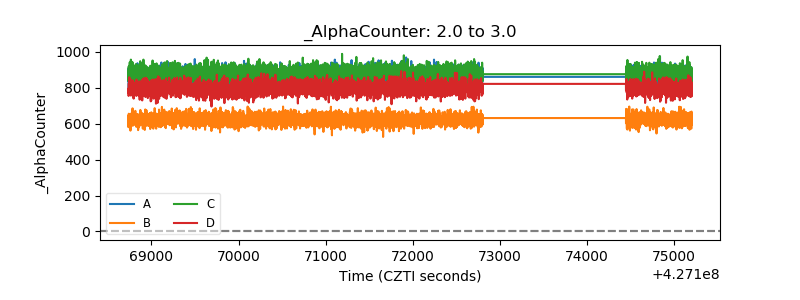 |
| _CPM_Rate | 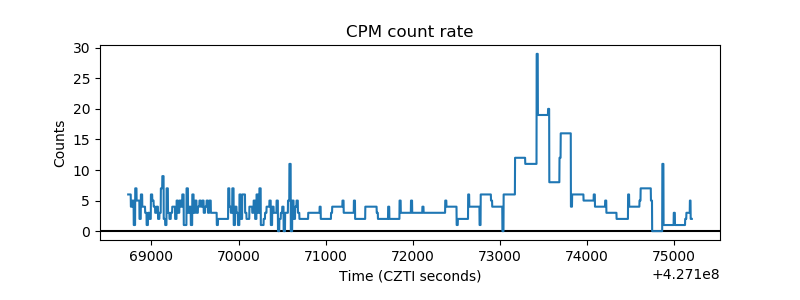 |
| CZT Counter | 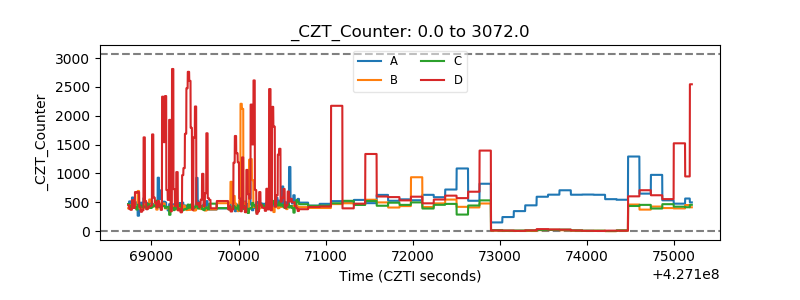 |
| +2.5 Volts monitor | 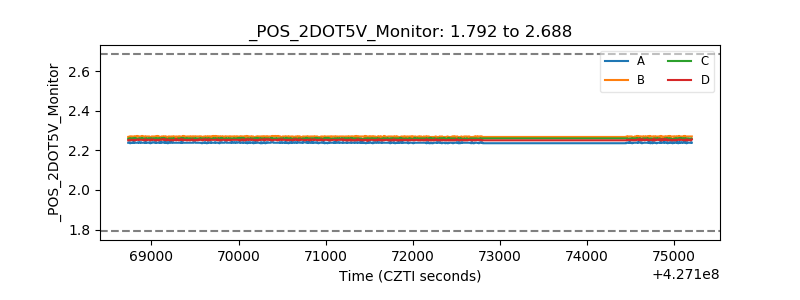 |
| +5 Volts monitor | 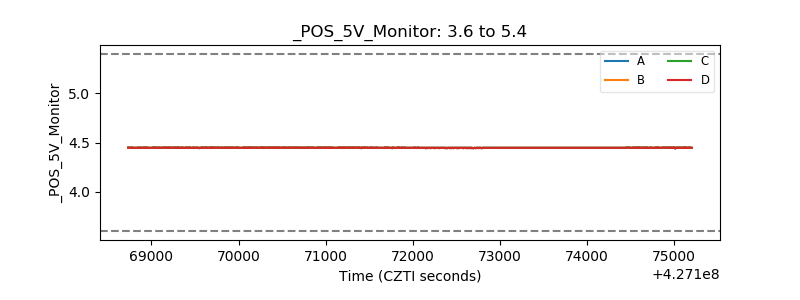 |
| _ROLL_ROT | 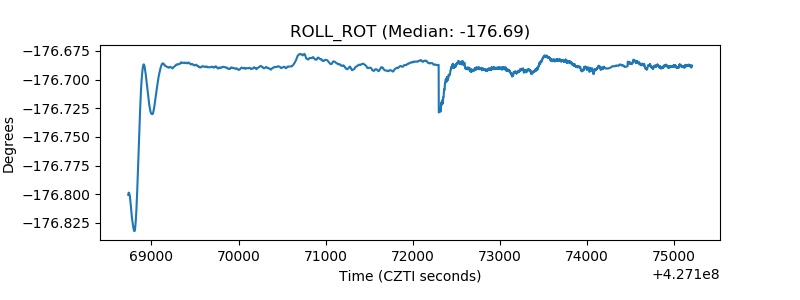 |
| _Roll_DEC | 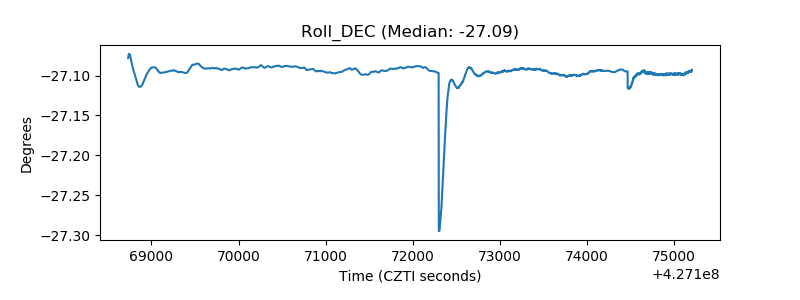 |
| _Roll_RA |  |
| Veto Counter | 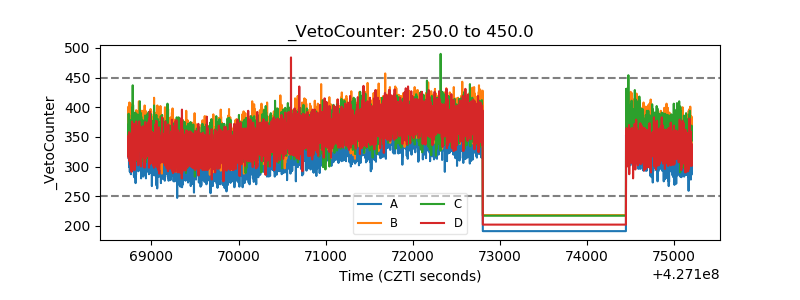 |