| Param | Original file | Final file |
|---|---|---|
| Filename | modeM0/AS1A12_088T21_9000005764_42161cztM0_level2.fits | modeM0/AS1A12_088T21_9000005764_42161cztM0_level2_quad_clean.evt |
| Size (bytes) | 403,300,800 | 97,943,040 |
| Size | 384.6 MB | 93.4 MB |
| Events in quadrant A | 3,650,002 | 651,979 |
| Events in quadrant B | 2,836,972 | 676,335 |
| Events in quadrant C | 2,812,858 | 639,487 |
| Events in quadrant D | 5,148,592 | 566,283 |
| Mode M0 | |||
|---|---|---|---|
| Quadrant | BADHDUFLAG | Total packets | Discarded packets |
| A | 0 | 14526 | 2 |
| B | 0 | 12725 | 2 |
| C | 0 | 12395 | 2 |
| D | 0 | 19660 | 2 |
| Mode M9 | |||
|---|---|---|---|
| Quadrant | BADHDUFLAG | Total packets | Discarded packets |
| A | 0 | 27 | 0 |
| B | 0 | 27 | 0 |
| C | 0 | 27 | 0 |
| D | 0 | 27 | 0 |
| Mode SS | |||
|---|---|---|---|
| Quadrant | BADHDUFLAG | Total packets | Discarded packets |
| A | 0 | 128 | 0 |
| B | 0 | 128 | 0 |
| C | 0 | 128 | 0 |
| D | 0 | 128 | 0 |
| Quadrant | Total seconds | Saturated seconds | Saturation percentage |
|---|---|---|---|
| A | 6178 | 43 | 0.696018% |
| B | 6178 | 15 | 0.242797% |
| C | 6178 | 6 | 0.097119% |
| D | 6178 | 298 | 4.823567% |
Noise dominated data is calculated using 1-second bins in cleaned event files. If a bin has >2000 counts, and if more than 50% of those come from <1% of pixels, then it is considered to be noise-dominated and hence unusable.
| Quadrant | # 1 sec bins | Bins with >0 counts | Bins with >2000 counts | High rate bins dominated by noise | Noise dominated (total time) | Noise dominated (detector-on time) | Marked lightcurve |
|---|---|---|---|---|---|---|---|
| A | 8864 | 6180 | 39 | 39 | 0.44% | 0.63% | 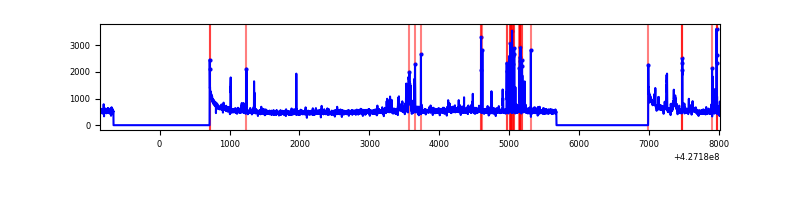 |
| B | 8864 | 6180 | 5 | 5 | 0.06% | 0.08% | 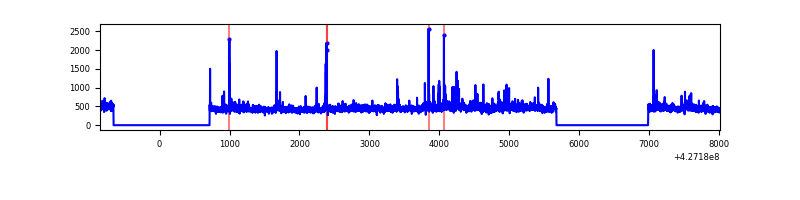 |
| C | 8864 | 6180 | 1 | 1 | 0.01% | 0.02% | 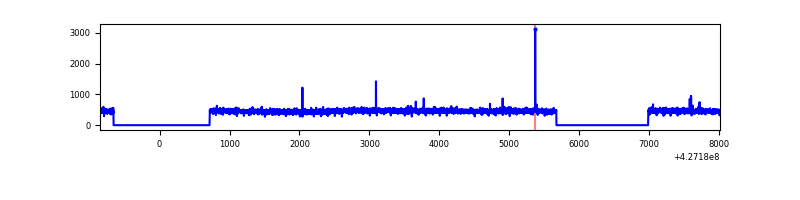 |
| D | 8864 | 6179 | 308 | 308 | 3.47% | 4.98% | 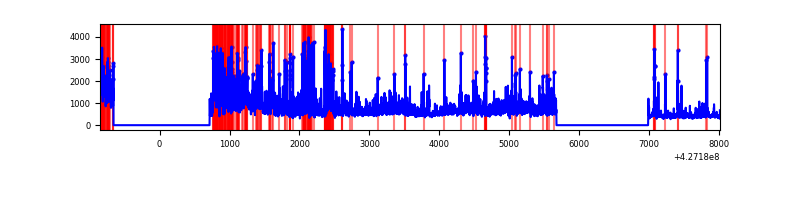 |
Top three noisy pixels from each quadrant. If the there are fewer than three noisy pixels in the level2.evt file, extra rows are filled as -1
| Pixel properties | Quadrant properties | ||||||
|---|---|---|---|---|---|---|---|
| Quadrant | DetID | PixID | Counts | Sigma | Mean | Median | Sigma |
| A | 10 | 83 | 625161 | 4497.18 | 665 | 652 | 138.9 |
| A | 15 | 222 | 165442 | 1186.68 | 665 | 652 | 138.9 |
| A | 15 | 223 | 146705 | 1051.75 | 665 | 652 | 138.9 |
| B | 0 | 229 | 113014 | 863.92 | 667 | 649 | 130.1 |
| B | 5 | 255 | 38218 | 288.85 | 667 | 649 | 130.1 |
| B | 0 | 156 | 33751 | 254.5 | 667 | 649 | 130.1 |
| C | 15 | 214 | 261002 | 1705.86 | 650 | 655 | 152.6 |
| C | 12 | 249 | 12590 | 78.2 | 650 | 655 | 152.6 |
| C | 13 | 61 | 4575 | 25.68 | 650 | 655 | 152.6 |
| D | 12 | 33 | 1237267 | 7899.44 | 635 | 616 | 156.5 |
| D | 12 | 6 | 540155 | 3446.45 | 635 | 616 | 156.5 |
| D | 1 | 52 | 373663 | 2382.94 | 635 | 616 | 156.5 |
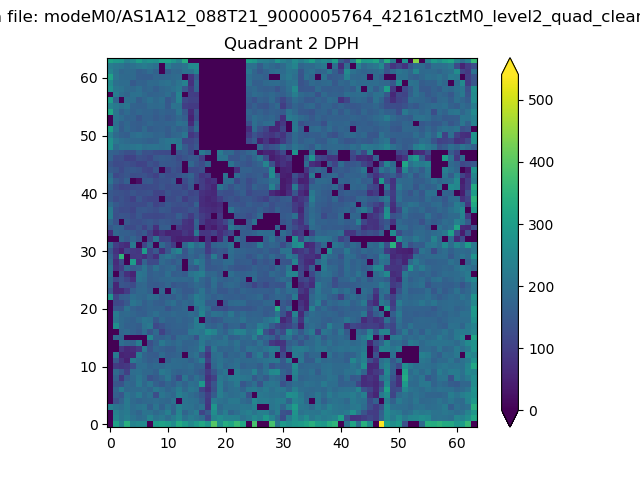
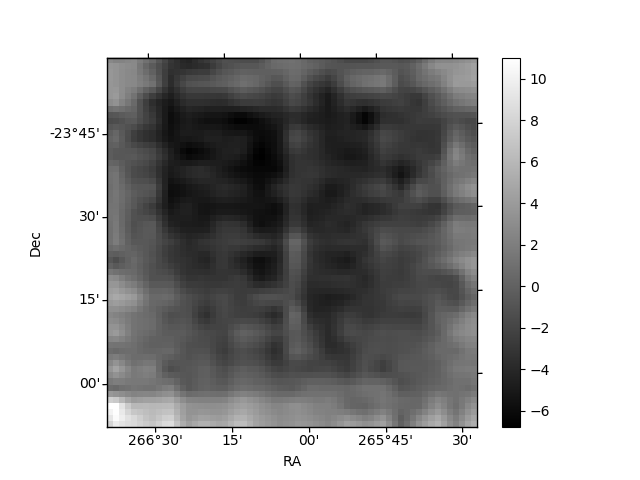
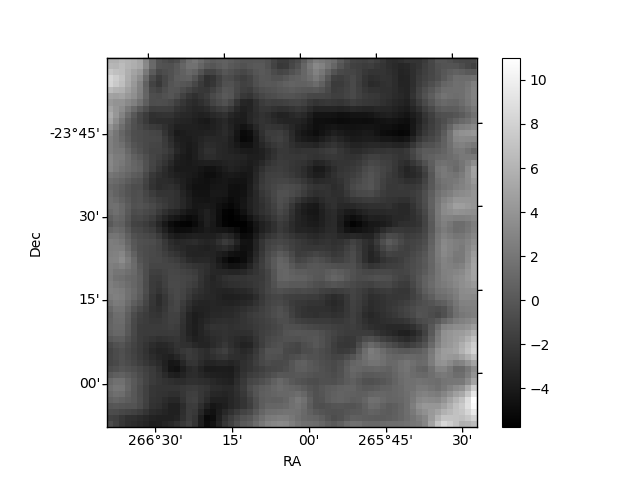
Histogram calculated using DETX and DETY for each event in the final _common_clean file
| Quadrant A | 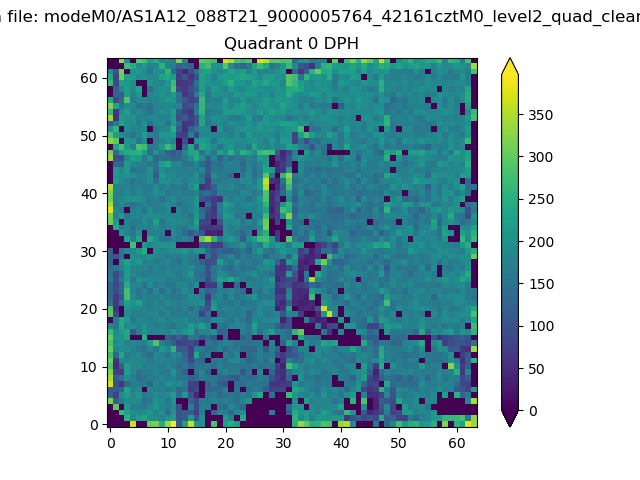 |
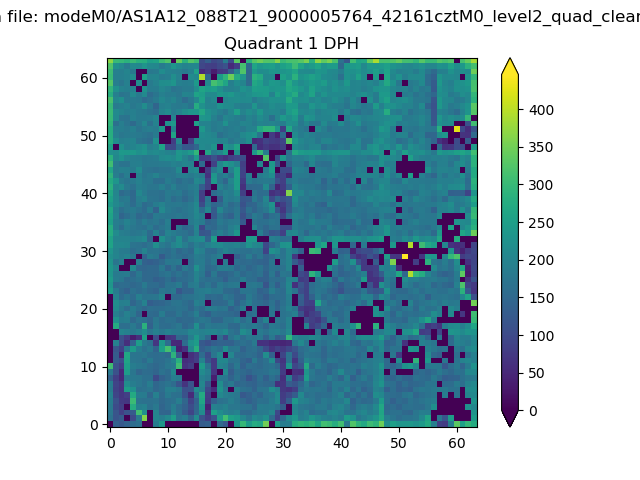 |
Quadrant B |
|---|---|---|---|
| Quadrant D | 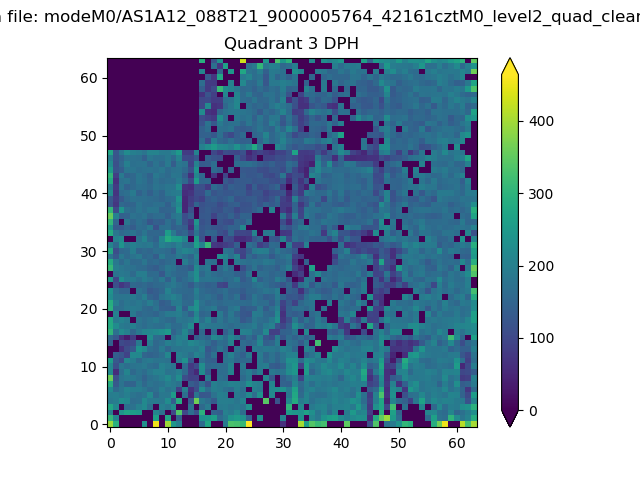 |
 |
Quadrant C |
| Plot type | Count rate plots | Images |
|---|---|---|
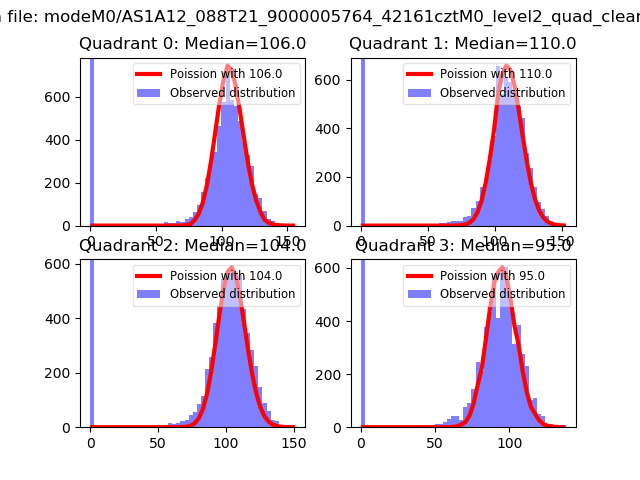
| Comparison with Poisson distribution Blue bars denote a histogram of data divided into 1 sec bins. Red curve is a Poisson curve with rate = median count rate of data. |
 |
 |
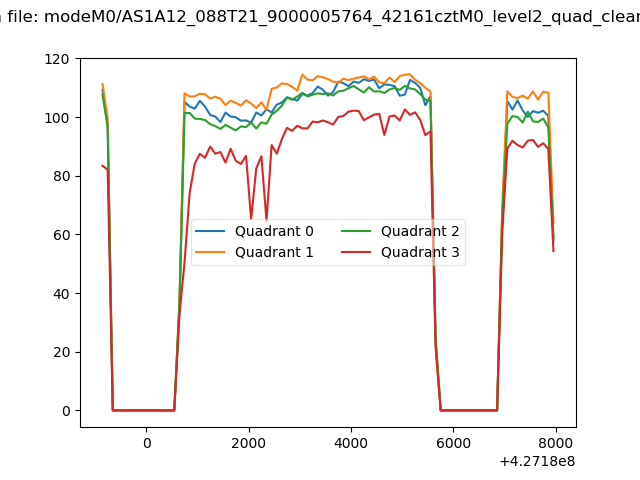
| Quadrant-wise count rates Data is divided into 100 sec bins |
 |
|
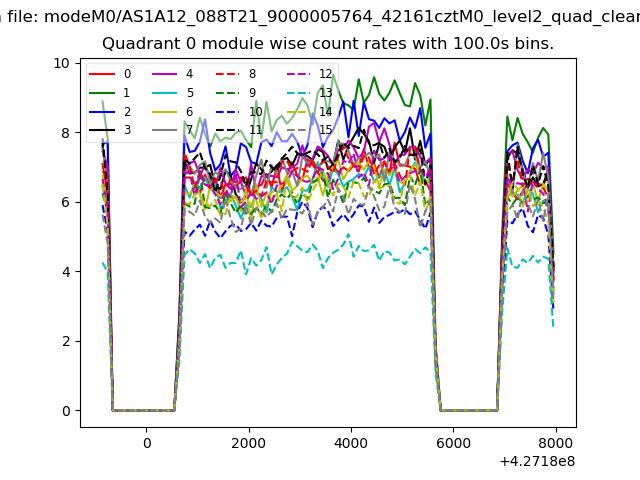
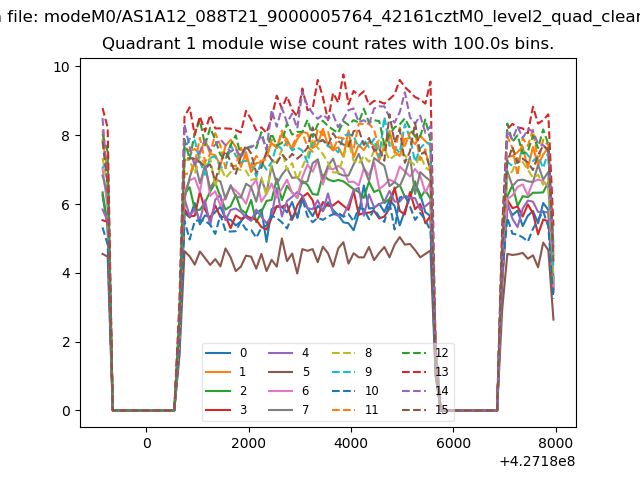
| Module-wise count rates for Quadrant A Data is divided into 100 sec bins |
 |
 |
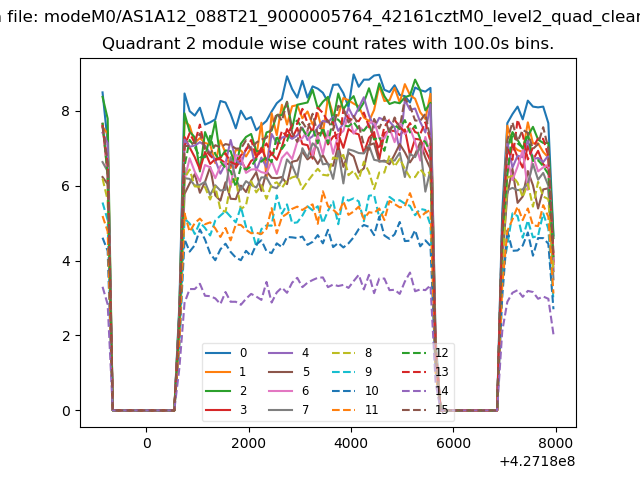
| Module-wise count rates for Quadrant B Data is divided into 100 sec bins |
 |
 |
| Module-wise count rates for Quadrant C Data is divided into 100 sec bins |
 |
 |
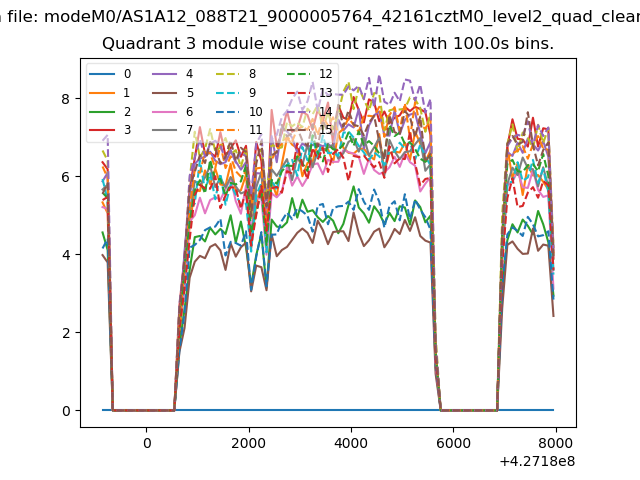
| Module-wise count rates for Quadrant D Data is divided into 100 sec bins |
 |
 |
| Parameter | Plot |
|---|---|
| CZT HV Monitor | 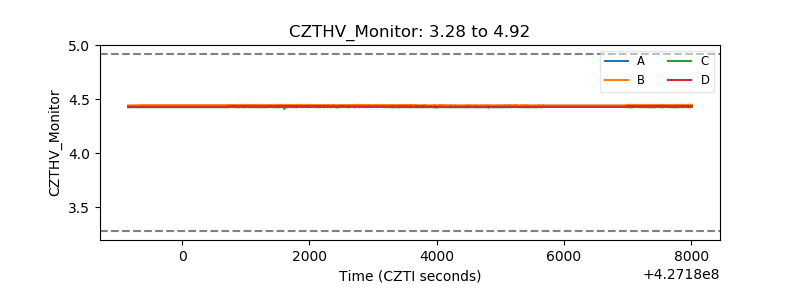 |
| D_VDD | 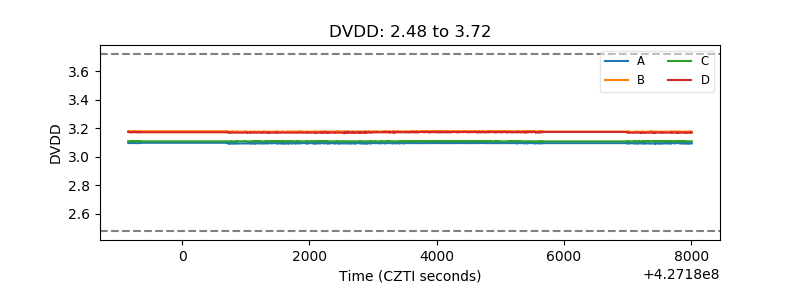 |
| Temperature 1 | 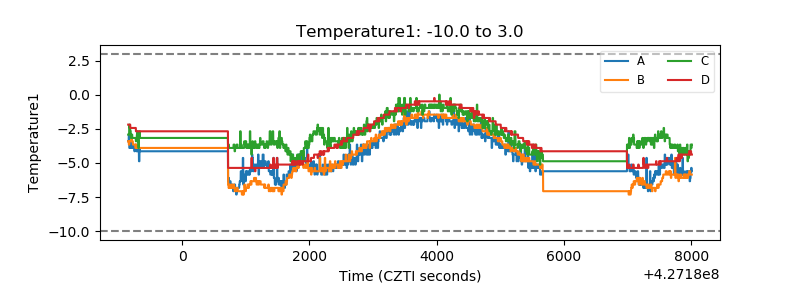 |
| Veto HV Monitor | 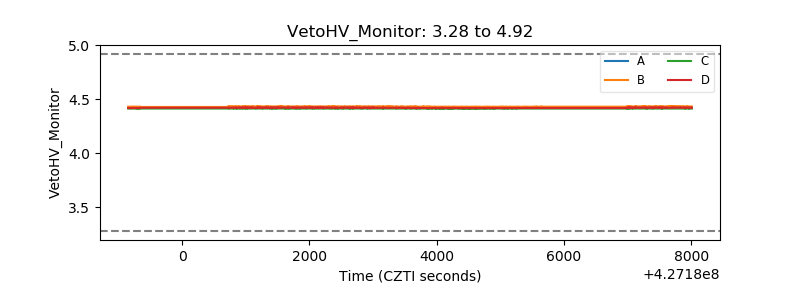 |
| Veto LLD | 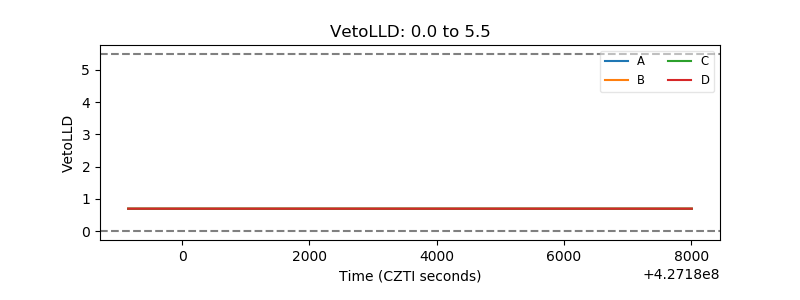 |
| Alpha Counter | 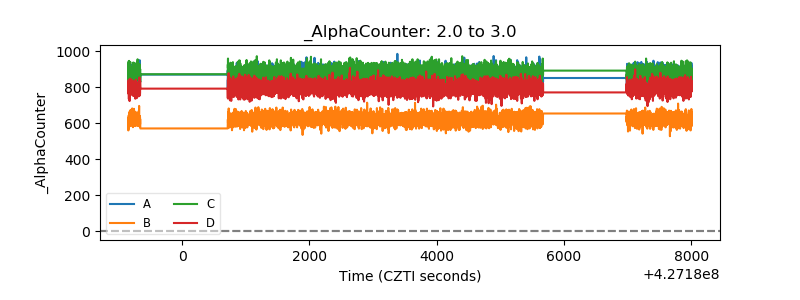 |
| _CPM_Rate | 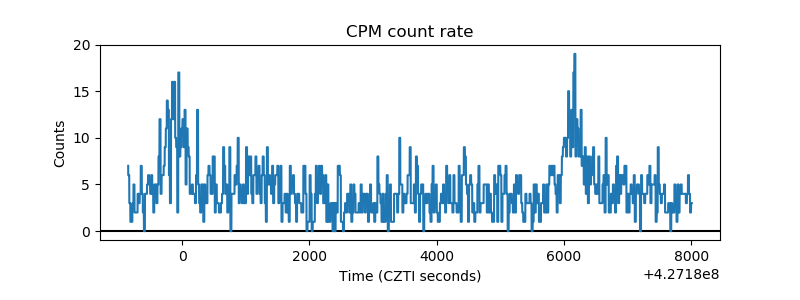 |
| CZT Counter |  |
| +2.5 Volts monitor | 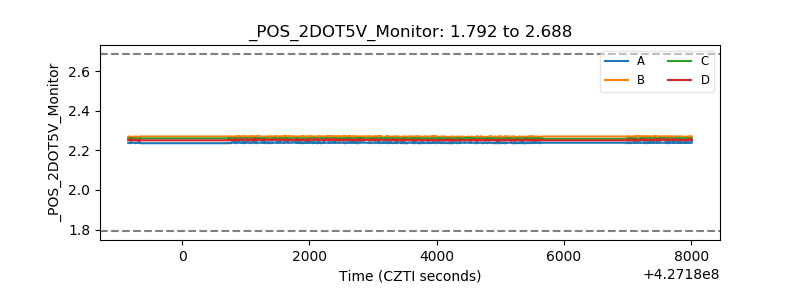 |
| +5 Volts monitor |  |
| _ROLL_ROT | 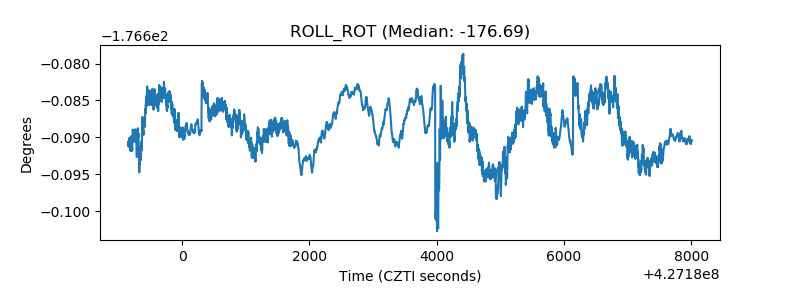 |
| _Roll_DEC | 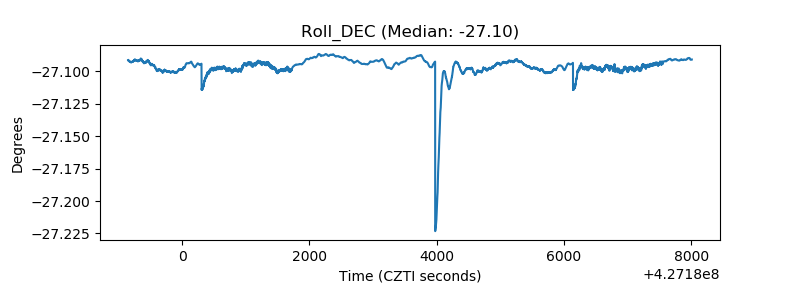 |
| _Roll_RA | 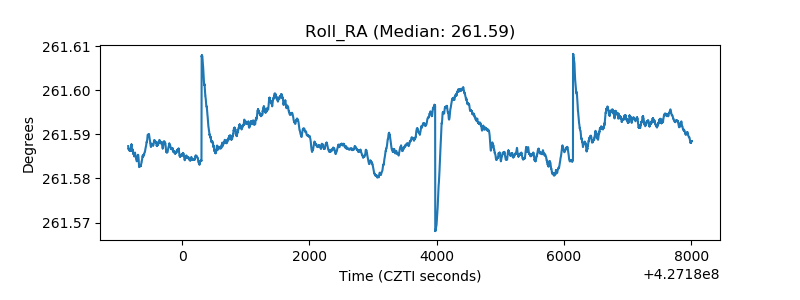 |
| Veto Counter | 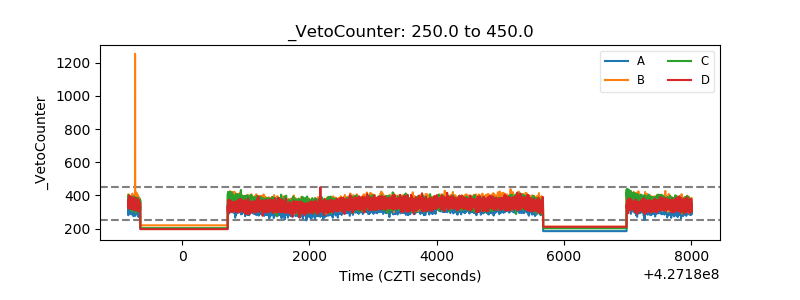 |