| Param | Original file | Final file |
|---|---|---|
| Filename | modeM0/AS1A12_088T21_9000005764_42164cztM0_level2.fits | modeM0/AS1A12_088T21_9000005764_42164cztM0_level2_quad_clean.evt |
| Size (bytes) | 563,783,040 | 132,799,680 |
| Size | 537.7 MB | 126.6 MB |
| Events in quadrant A | 6,032,431 | 857,505 |
| Events in quadrant B | 4,034,330 | 919,068 |
| Events in quadrant C | 3,860,005 | 881,498 |
| Events in quadrant D | 6,284,811 | 774,104 |
| Mode M0 | |||
|---|---|---|---|
| Quadrant | BADHDUFLAG | Total packets | Discarded packets |
| A | 0 | 23049 | 2 |
| B | 0 | 17926 | 2 |
| C | 0 | 17007 | 2 |
| D | 0 | 24495 | 2 |
| Mode M9 | |||
|---|---|---|---|
| Quadrant | BADHDUFLAG | Total packets | Discarded packets |
| A | 0 | 19 | 0 |
| B | 0 | 20 | 0 |
| C | 0 | 20 | 0 |
| D | 0 | 20 | 0 |
| Mode SS | |||
|---|---|---|---|
| Quadrant | BADHDUFLAG | Total packets | Discarded packets |
| A | 0 | 172 | 0 |
| B | 0 | 172 | 0 |
| C | 0 | 172 | 0 |
| D | 0 | 172 | 0 |
| Quadrant | Total seconds | Saturated seconds | Saturation percentage |
|---|---|---|---|
| A | 8476 | 406 | 4.789995% |
| B | 8476 | 58 | 0.684285% |
| C | 8476 | 2 | 0.023596% |
| D | 8476 | 434 | 5.120340% |
Noise dominated data is calculated using 1-second bins in cleaned event files. If a bin has >2000 counts, and if more than 50% of those come from <1% of pixels, then it is considered to be noise-dominated and hence unusable.
| Quadrant | # 1 sec bins | Bins with >0 counts | Bins with >2000 counts | High rate bins dominated by noise | Noise dominated (total time) | Noise dominated (detector-on time) | Marked lightcurve |
|---|---|---|---|---|---|---|---|
| A | 9818 | 8477 | 332 | 332 | 3.38% | 3.92% | 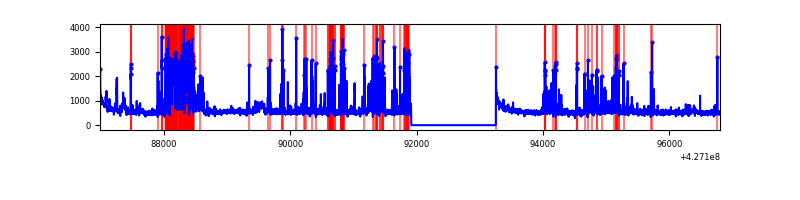 |
| B | 9818 | 8477 | 45 | 45 | 0.46% | 0.53% | 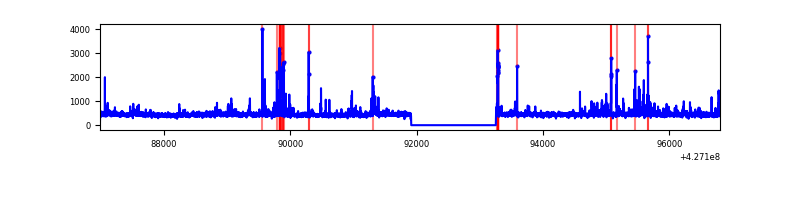 |
| C | 9818 | 8477 | 0 | 0 | 0.00% | 0.00% | 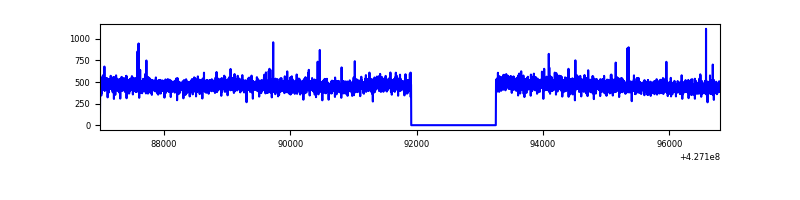 |
| D | 9818 | 8477 | 385 | 385 | 3.92% | 4.54% | 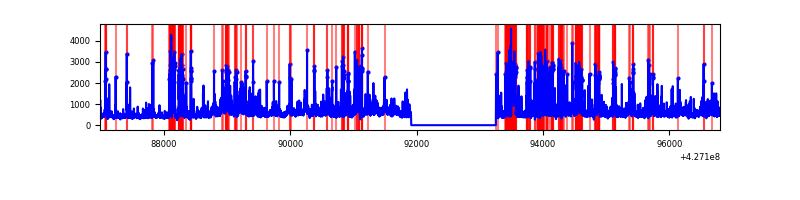 |
Top three noisy pixels from each quadrant. If the there are fewer than three noisy pixels in the level2.evt file, extra rows are filled as -1
| Pixel properties | Quadrant properties | ||||||
|---|---|---|---|---|---|---|---|
| Quadrant | DetID | PixID | Counts | Sigma | Mean | Median | Sigma |
| A | 15 | 223 | 935144 | 5016.66 | 903 | 886 | 186.2 |
| A | 10 | 83 | 765201 | 4104.12 | 903 | 886 | 186.2 |
| A | 15 | 222 | 698892 | 3748.06 | 903 | 886 | 186.2 |
| B | 15 | 35 | 203742 | 1142.81 | 911 | 888 | 177.5 |
| B | 0 | 229 | 135113 | 756.18 | 911 | 888 | 177.5 |
| B | 5 | 255 | 57380 | 318.26 | 911 | 888 | 177.5 |
| C | 15 | 214 | 351964 | 1680.77 | 893 | 899 | 208.9 |
| C | 12 | 249 | 18757 | 85.5 | 893 | 899 | 208.9 |
| C | 0 | 207 | 7864 | 33.35 | 893 | 899 | 208.9 |
| D | 12 | 33 | 1173920 | 5469.95 | 875 | 852 | 214.5 |
| D | 12 | 6 | 493562 | 2297.48 | 875 | 852 | 214.5 |
| D | 13 | 249 | 412803 | 1920.9 | 875 | 852 | 214.5 |
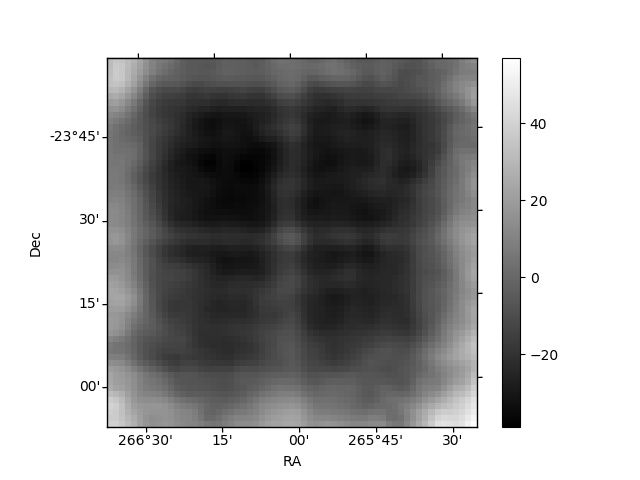
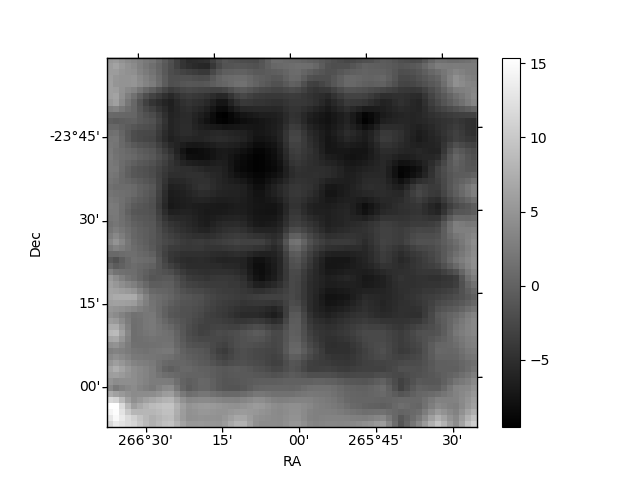
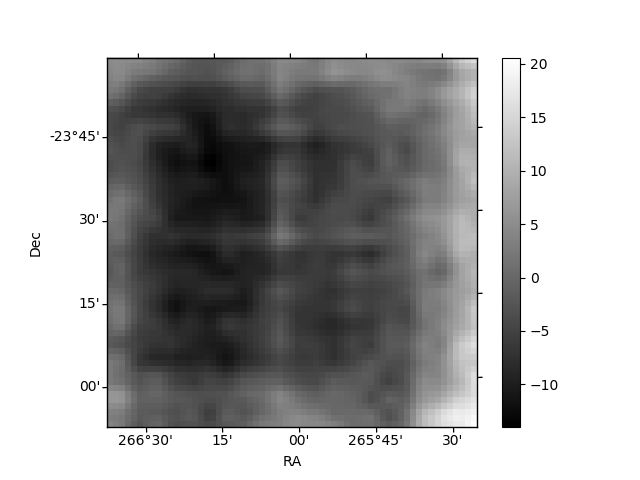
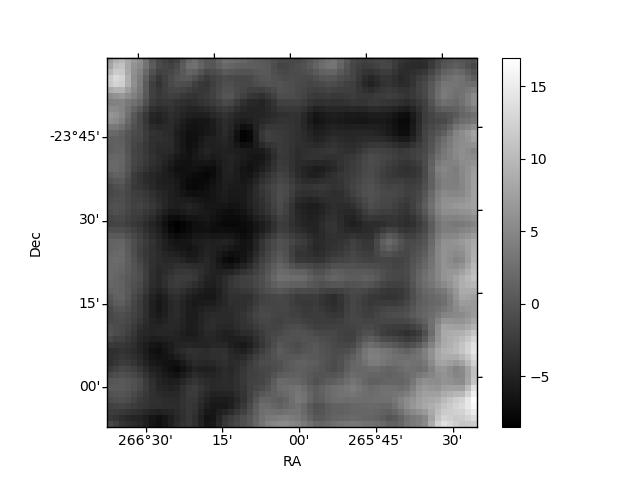
Histogram calculated using DETX and DETY for each event in the final _common_clean file
| Quadrant A | 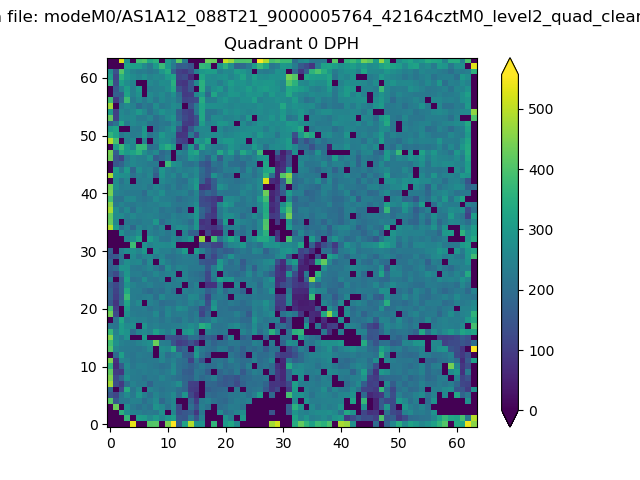 |
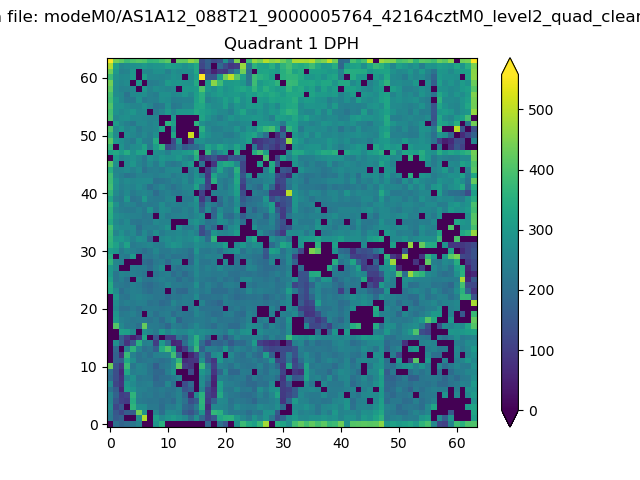 |
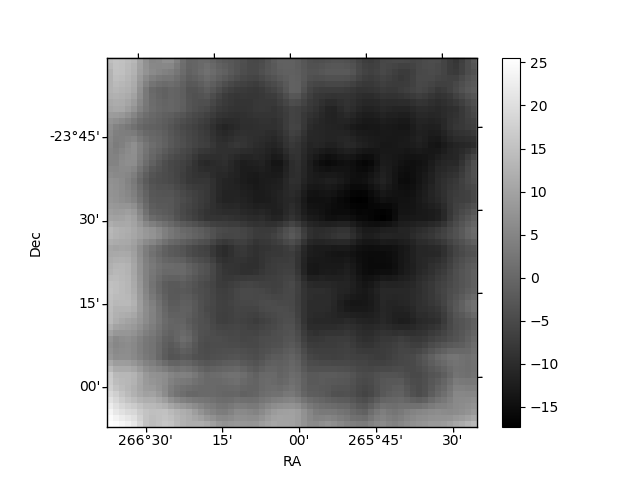
Quadrant B |
|---|---|---|---|
| Quadrant D | 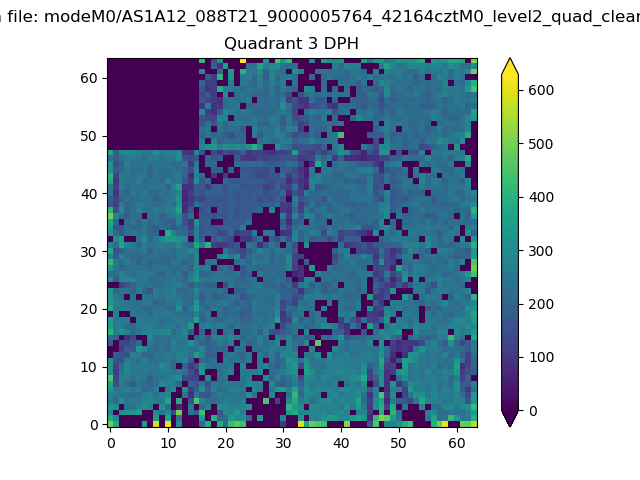 |
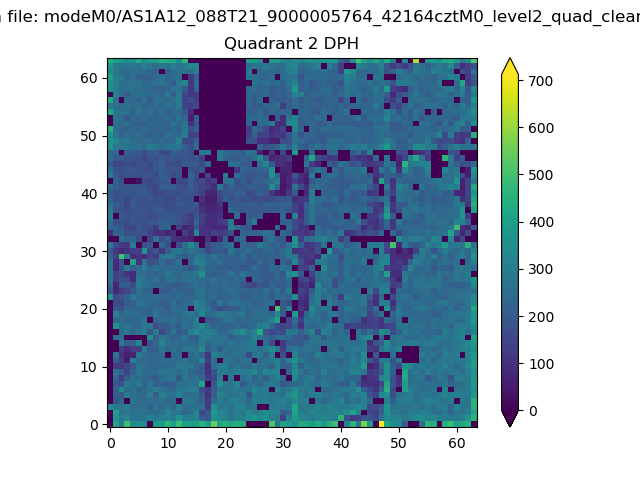 |
Quadrant C |
| Plot type | Count rate plots | Images |
|---|---|---|
| Comparison with Poisson distribution Blue bars denote a histogram of data divided into 1 sec bins. Red curve is a Poisson curve with rate = median count rate of data. |
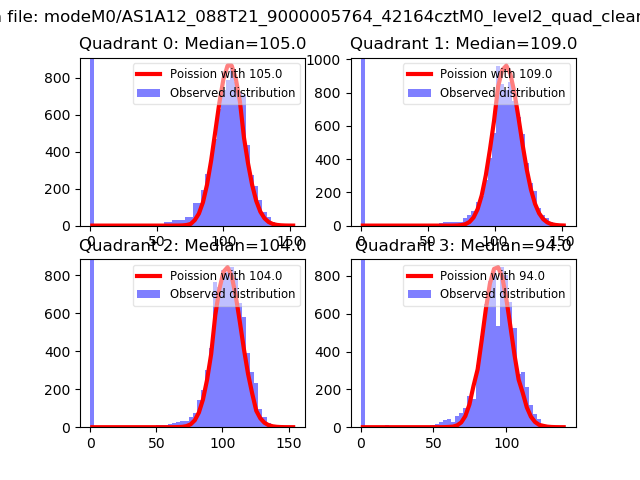 |
 |
| Quadrant-wise count rates Data is divided into 100 sec bins |
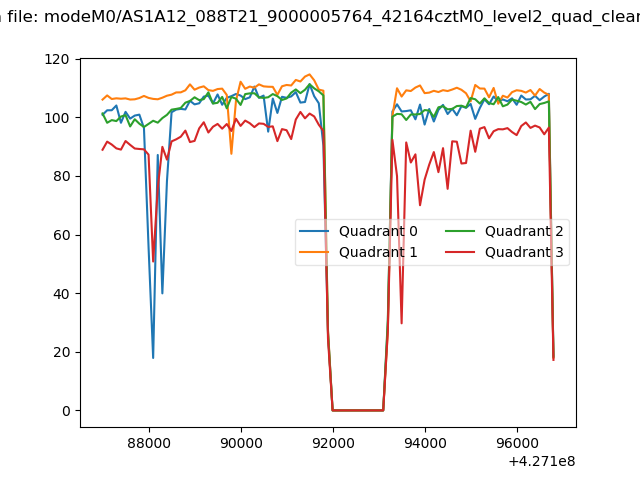 |
|
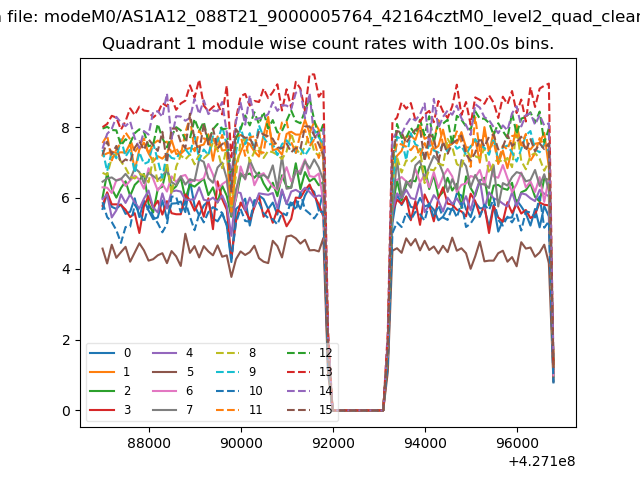
| Module-wise count rates for Quadrant A Data is divided into 100 sec bins |
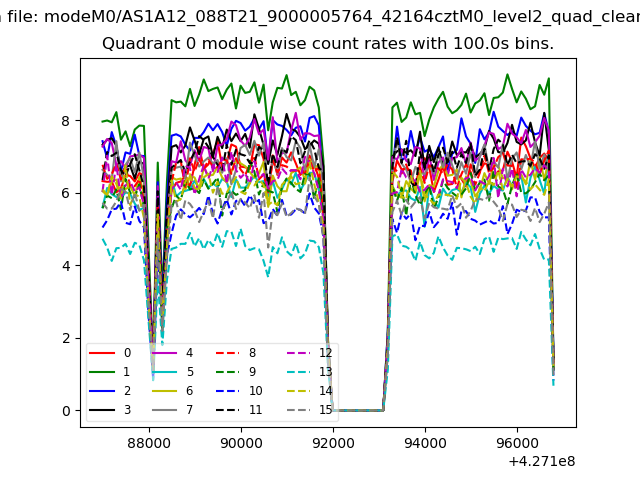 |
 |
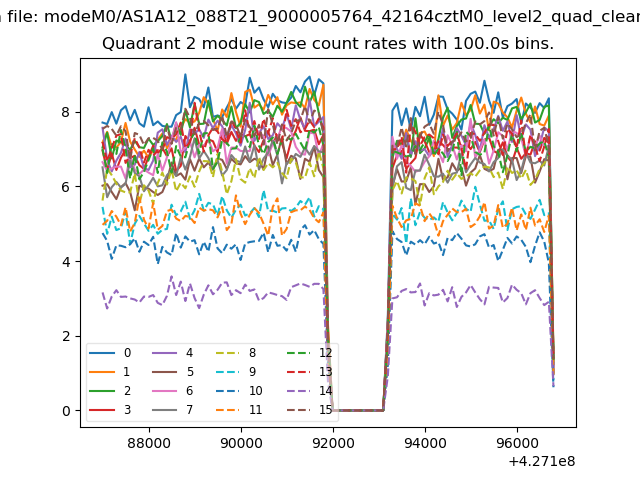
| Module-wise count rates for Quadrant B Data is divided into 100 sec bins |
 |
 |
| Module-wise count rates for Quadrant C Data is divided into 100 sec bins |
 |
 |
| Module-wise count rates for Quadrant D Data is divided into 100 sec bins |
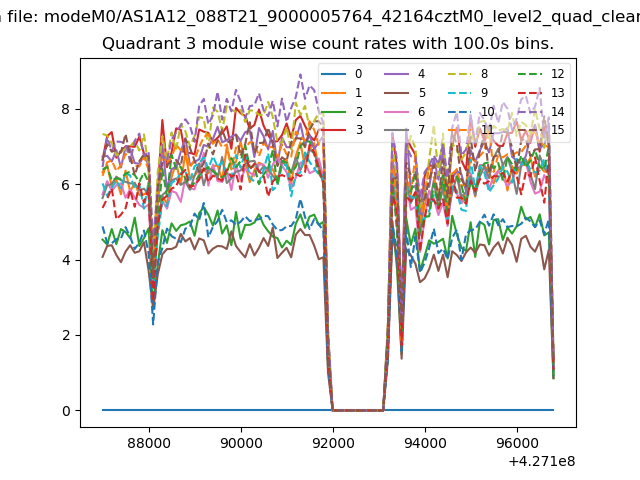 |
 |
| Parameter | Plot |
|---|---|
| CZT HV Monitor | 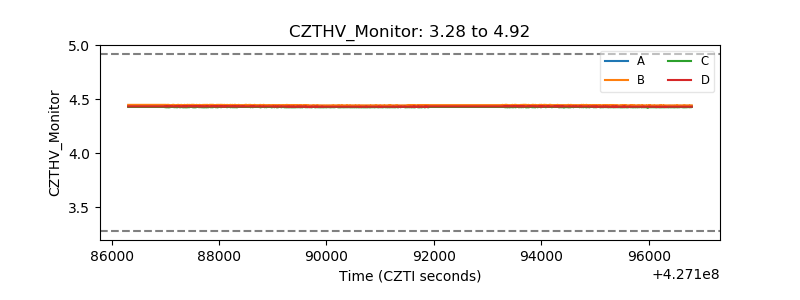 |
| D_VDD | 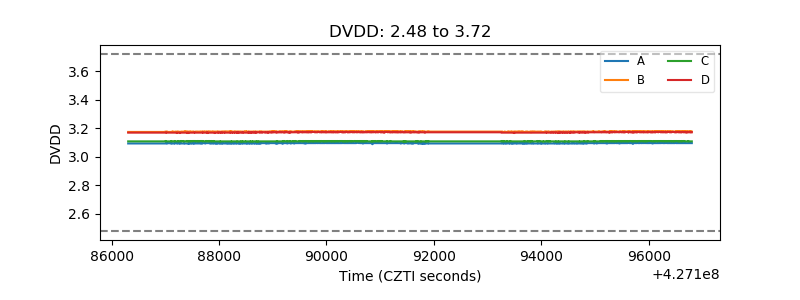 |
| Temperature 1 | 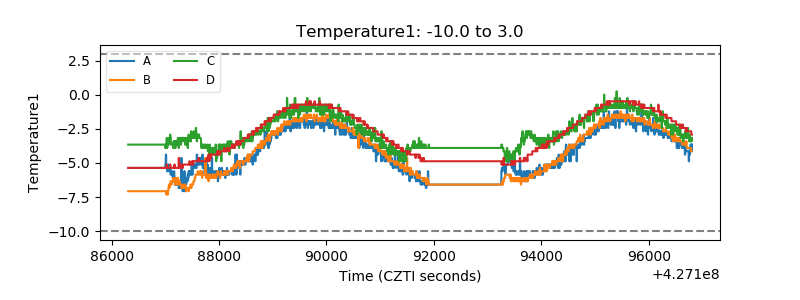 |
| Veto HV Monitor | 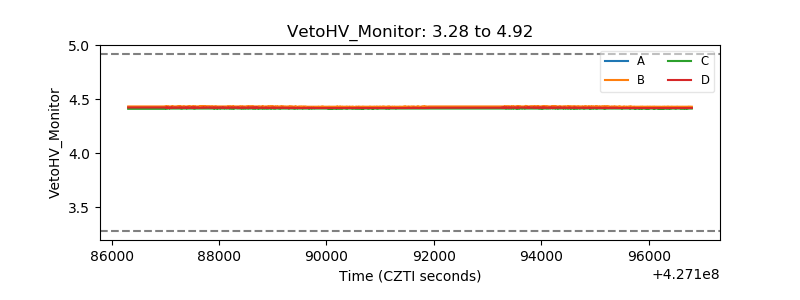 |
| Veto LLD | 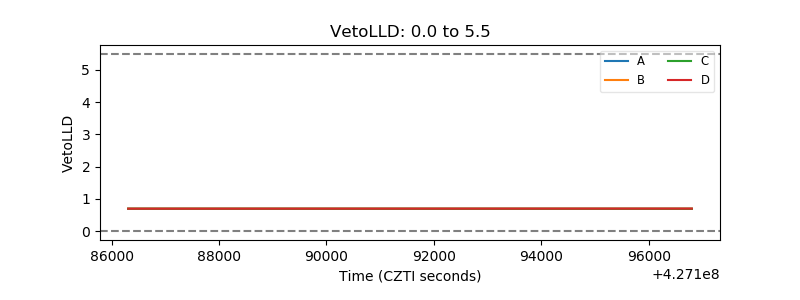 |
| Alpha Counter | 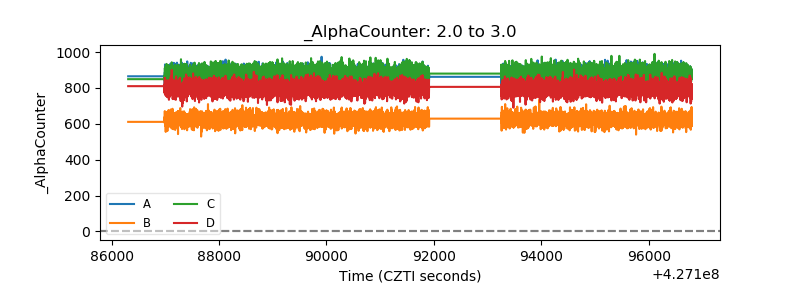 |
| _CPM_Rate |  |
| CZT Counter |  |
| +2.5 Volts monitor | 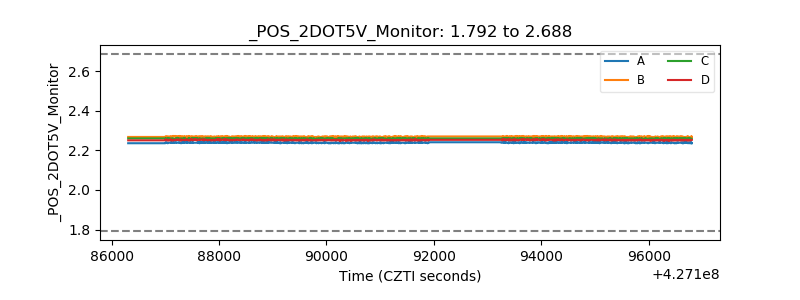 |
| +5 Volts monitor | 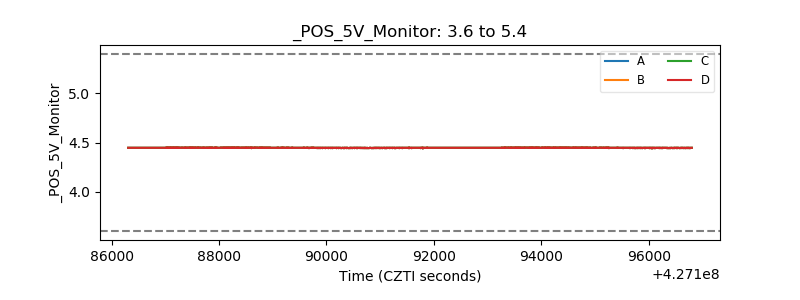 |
| _ROLL_ROT | 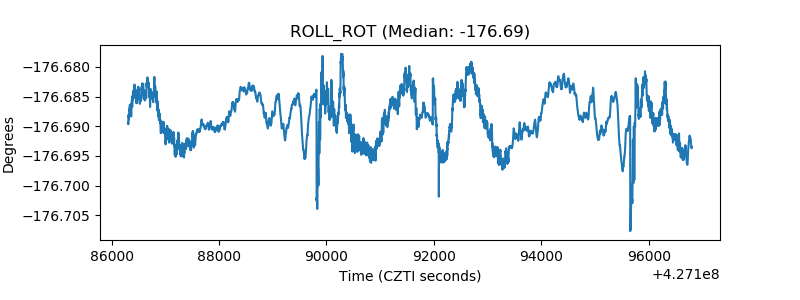 |
| _Roll_DEC | 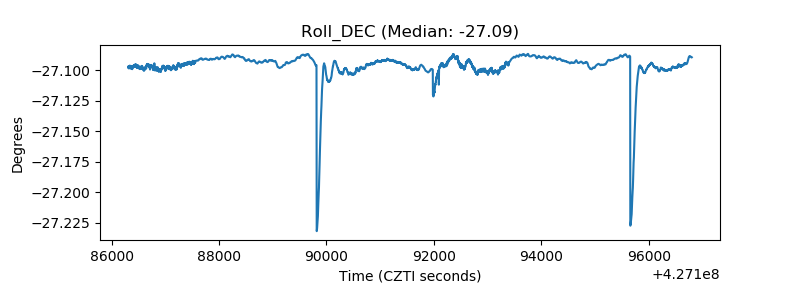 |
| _Roll_RA |  |
| Veto Counter | 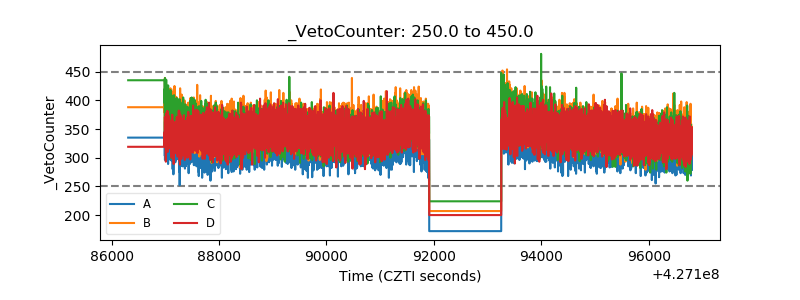 |