| Param | Original file | Final file |
|---|---|---|
| Filename | modeM0/AS1P01_999T99_9000005772_42301cztM0_level2.fits | modeM0/AS1P01_999T99_9000005772_42301cztM0_level2_quad_clean.evt |
| Size (bytes) | 310,907,520 | 92,914,560 |
| Size | 296.5 MB | 88.6 MB |
| Events in quadrant A | 2,939,264 | 636,703 |
| Events in quadrant B | 2,517,864 | 651,123 |
| Events in quadrant C | 2,432,425 | 610,167 |
| Events in quadrant D | 3,224,977 | 560,791 |
| Mode M0 | |||
|---|---|---|---|
| Quadrant | BADHDUFLAG | Total packets | Discarded packets |
| A | 0 | 11806 | 2 |
| B | 0 | 10747 | 2 |
| C | 0 | 10317 | 2 |
| D | 0 | 13034 | 2 |
| Mode SS | |||
|---|---|---|---|
| Quadrant | BADHDUFLAG | Total packets | Discarded packets |
| A | 0 | 104 | 0 |
| B | 0 | 104 | 0 |
| C | 0 | 104 | 0 |
| D | 0 | 104 | 0 |
| Mode M9 | |||
|---|---|---|---|
| Quadrant | BADHDUFLAG | Total packets | Discarded packets |
| A | 0 | 34 | 0 |
| B | 0 | 35 | 0 |
| C | 0 | 35 | 0 |
| D | 0 | 35 | 0 |
| Quadrant | Total seconds | Saturated seconds | Saturation percentage |
|---|---|---|---|
| A | 5061 | 11 | 0.217348% |
| B | 5061 | 9 | 0.177830% |
| C | 5061 | 5 | 0.098795% |
| D | 5061 | 104 | 2.054930% |
Noise dominated data is calculated using 1-second bins in cleaned event files. If a bin has >2000 counts, and if more than 50% of those come from <1% of pixels, then it is considered to be noise-dominated and hence unusable.
| Quadrant | # 1 sec bins | Bins with >0 counts | Bins with >2000 counts | High rate bins dominated by noise | Noise dominated (total time) | Noise dominated (detector-on time) | Marked lightcurve |
|---|---|---|---|---|---|---|---|
| A | 7214 | 5062 | 4 | 4 | 0.06% | 0.08% | 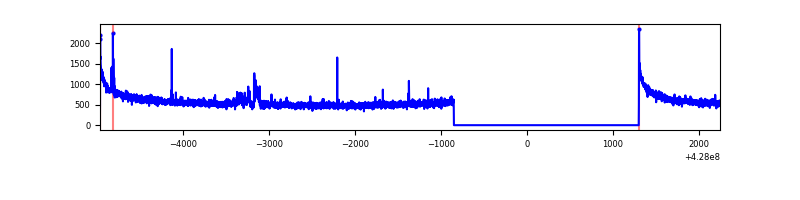 |
| B | 7214 | 5062 | 2 | 2 | 0.03% | 0.04% | 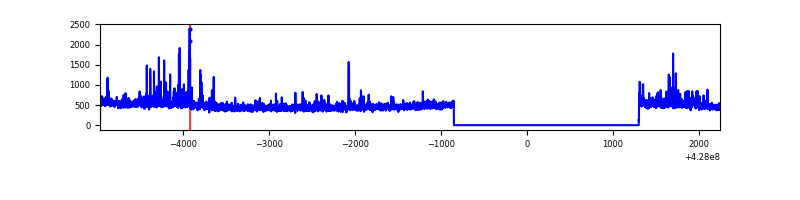 |
| C | 7214 | 5062 | 2 | 2 | 0.03% | 0.04% | 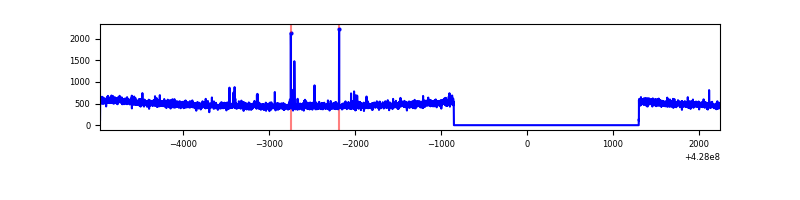 |
| D | 7214 | 5062 | 89 | 89 | 1.23% | 1.76% | 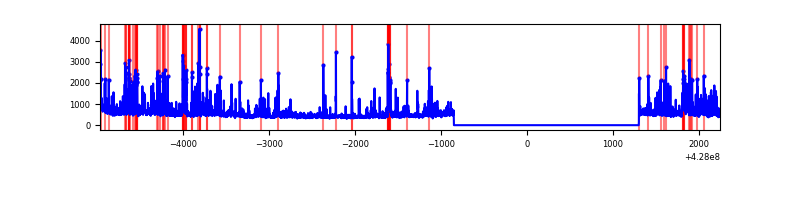 |
Top three noisy pixels from each quadrant. If the there are fewer than three noisy pixels in the level2.evt file, extra rows are filled as -1
| Pixel properties | Quadrant properties | ||||||
|---|---|---|---|---|---|---|---|
| Quadrant | DetID | PixID | Counts | Sigma | Mean | Median | Sigma |
| A | 10 | 83 | 574394 | 4772.76 | 592 | 582 | 120.2 |
| A | 15 | 223 | 45634 | 374.73 | 592 | 582 | 120.2 |
| A | 13 | 248 | 15881 | 127.25 | 592 | 582 | 120.2 |
| B | 4 | 171 | 117969 | 1043.38 | 586 | 571 | 112.5 |
| B | 0 | 229 | 41879 | 367.13 | 586 | 571 | 112.5 |
| B | 0 | 245 | 22286 | 192.99 | 586 | 571 | 112.5 |
| C | 15 | 214 | 211705 | 1609.09 | 563 | 568 | 131.2 |
| C | 12 | 249 | 18129 | 133.83 | 563 | 568 | 131.2 |
| C | 15 | 159 | 7389 | 51.98 | 563 | 568 | 131.2 |
| D | 1 | 52 | 524502 | 3769.53 | 563 | 545 | 139.0 |
| D | 12 | 233 | 150952 | 1082.08 | 563 | 545 | 139.0 |
| D | 5 | 171 | 105351 | 754.01 | 563 | 545 | 139.0 |
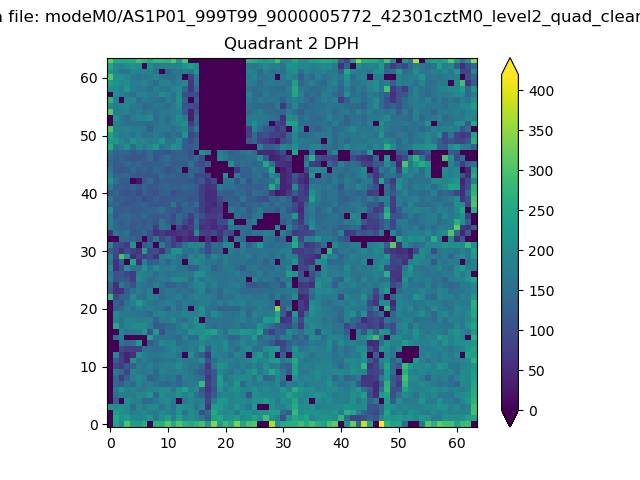
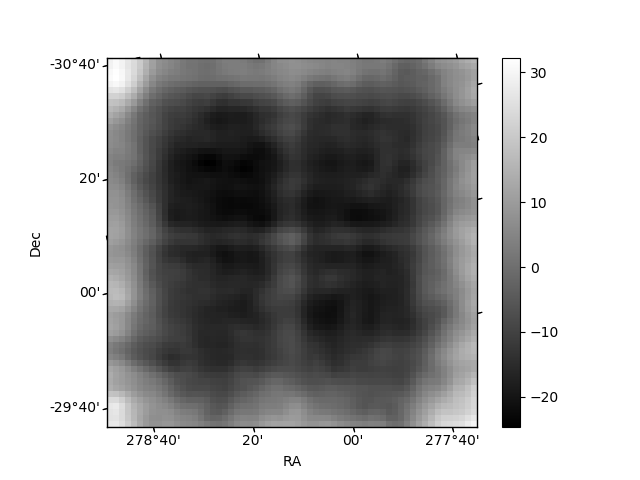
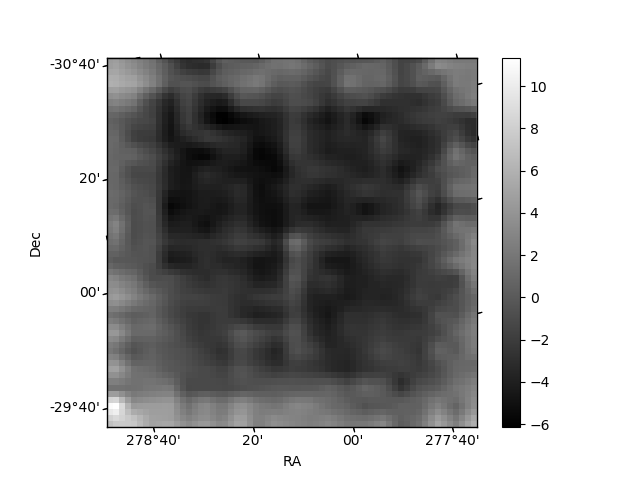
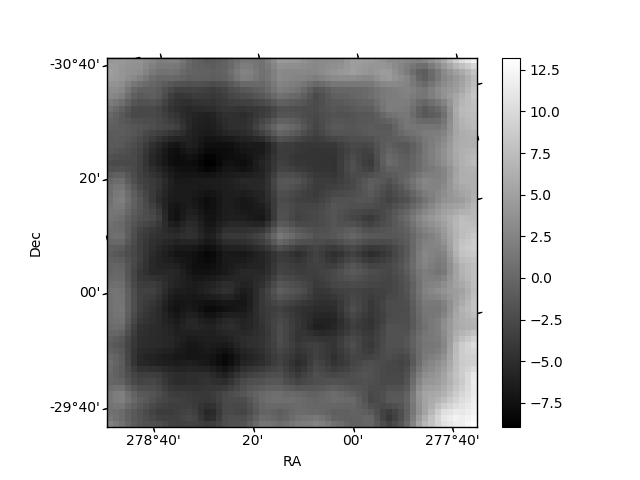
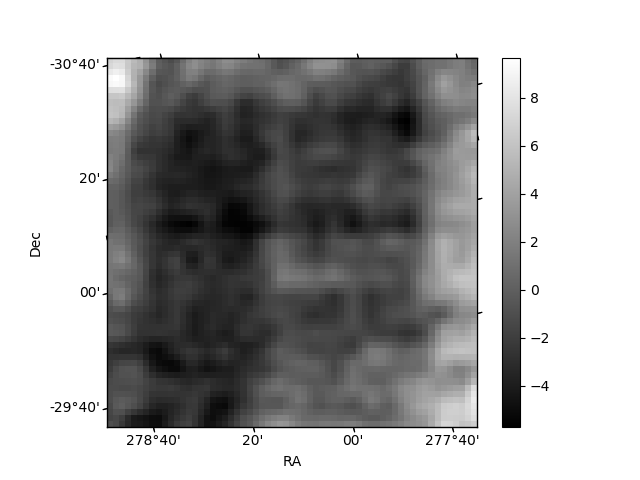
Histogram calculated using DETX and DETY for each event in the final _common_clean file
| Quadrant A | 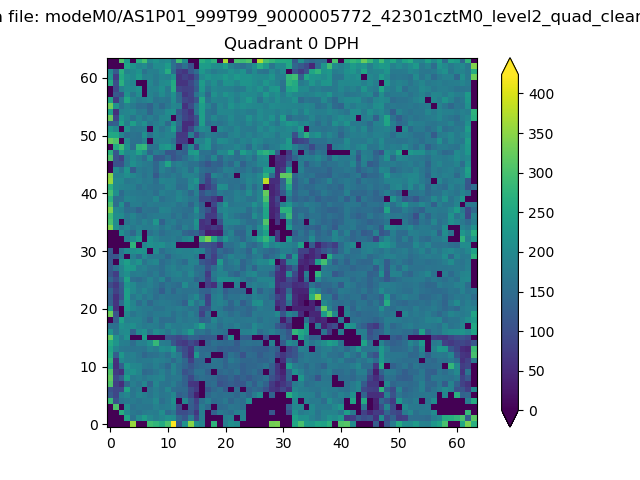 |
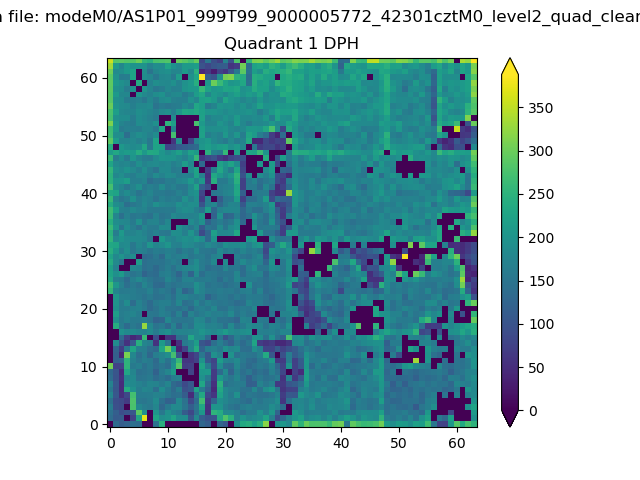 |
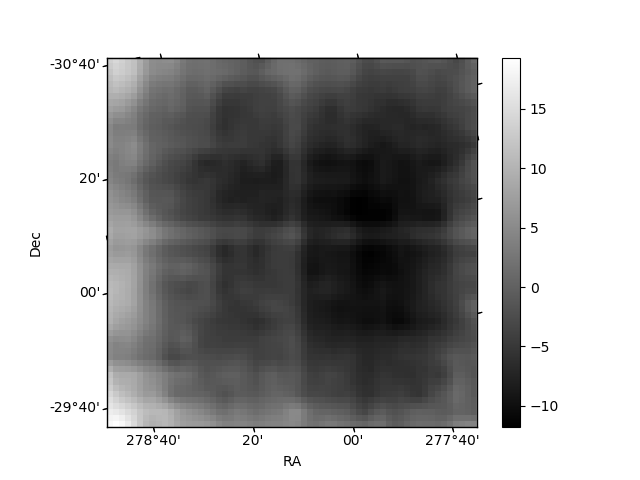
Quadrant B |
|---|---|---|---|
| Quadrant D | 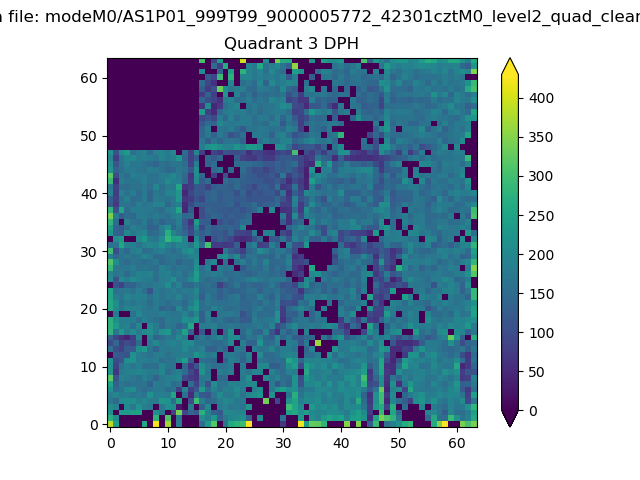 |
 |
Quadrant C |
| Plot type | Count rate plots | Images |
|---|---|---|
| Comparison with Poisson distribution Blue bars denote a histogram of data divided into 1 sec bins. Red curve is a Poisson curve with rate = median count rate of data. |
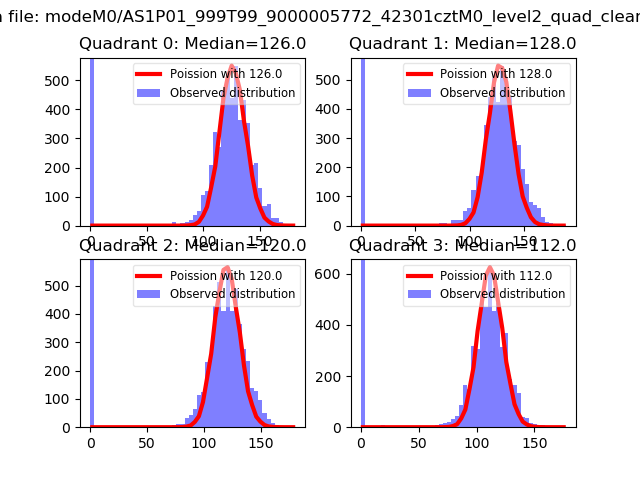 |
 |
| Quadrant-wise count rates Data is divided into 100 sec bins |
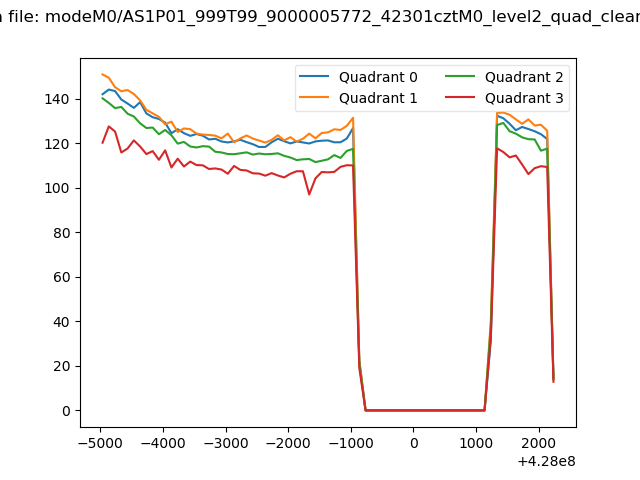 |
|
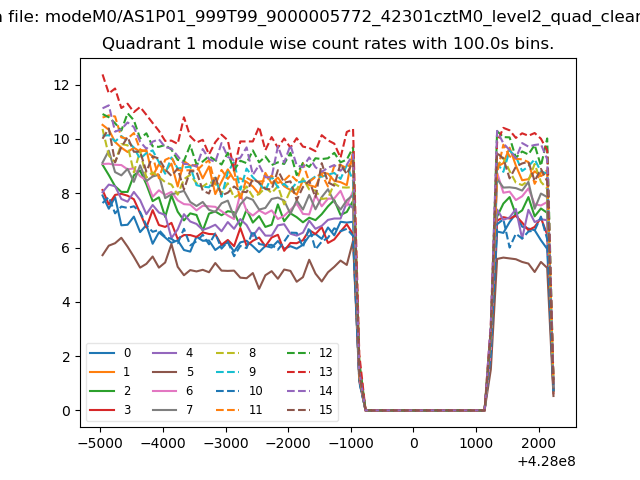
| Module-wise count rates for Quadrant A Data is divided into 100 sec bins |
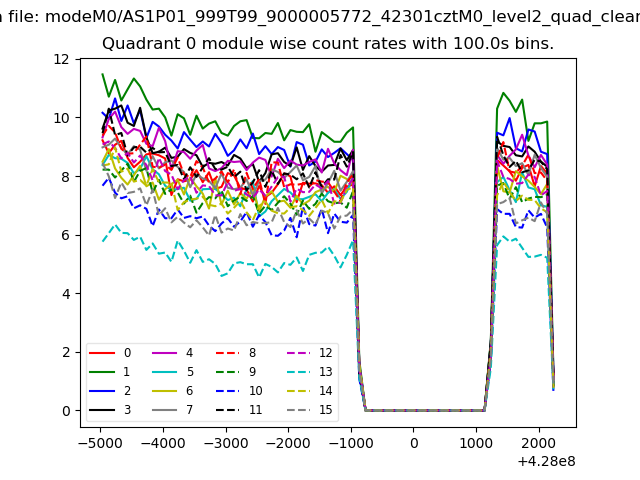 |
 |
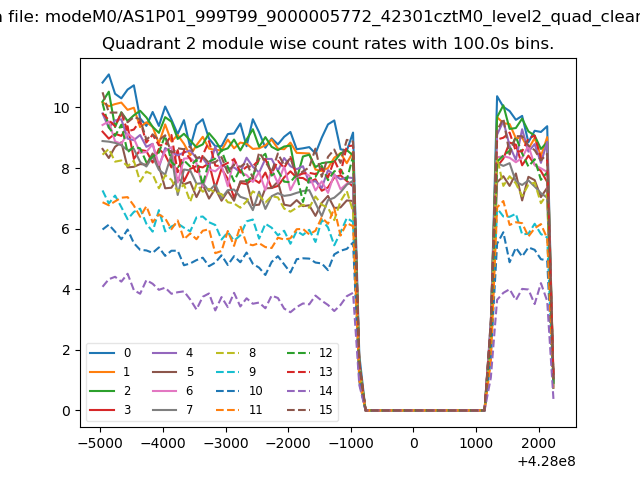
| Module-wise count rates for Quadrant B Data is divided into 100 sec bins |
 |
 |
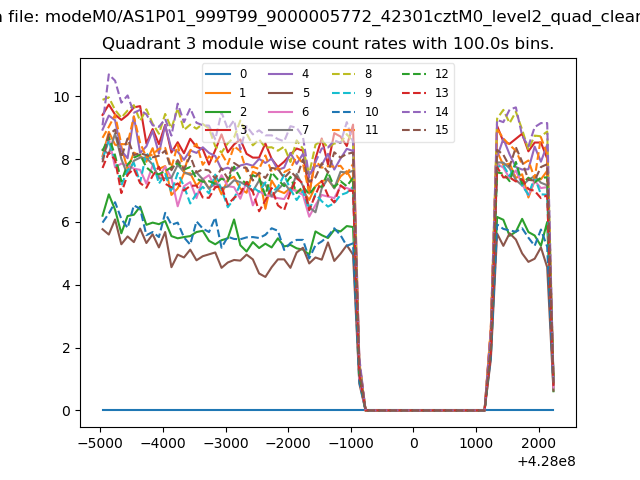
| Module-wise count rates for Quadrant C Data is divided into 100 sec bins |
 |
 |
| Module-wise count rates for Quadrant D Data is divided into 100 sec bins |
 |
 |
| Parameter | Plot |
|---|---|
| CZT HV Monitor | 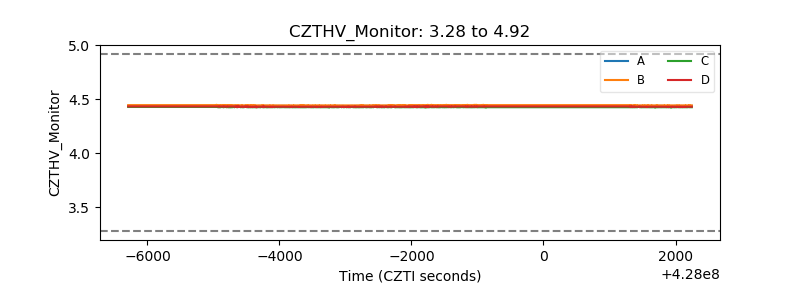 |
| D_VDD | 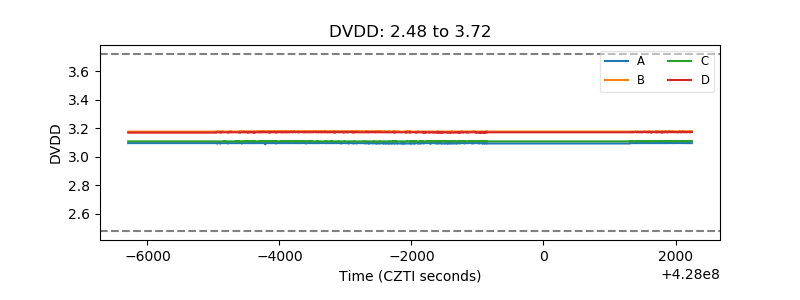 |
| Temperature 1 | 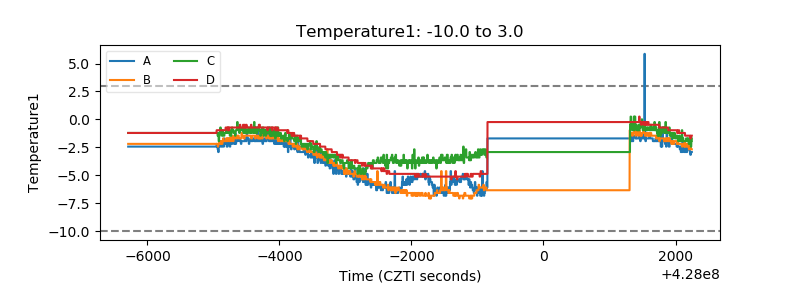 |
| Veto HV Monitor |  |
| Veto LLD | 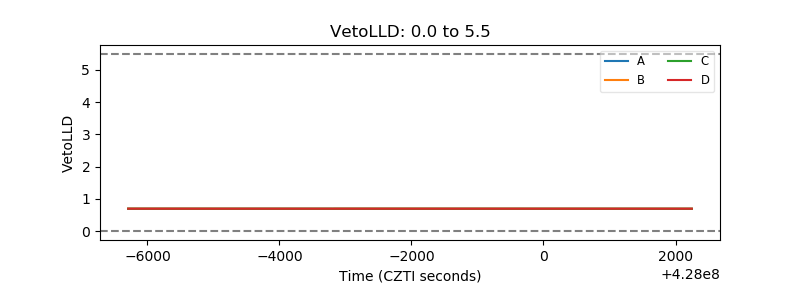 |
| Alpha Counter | 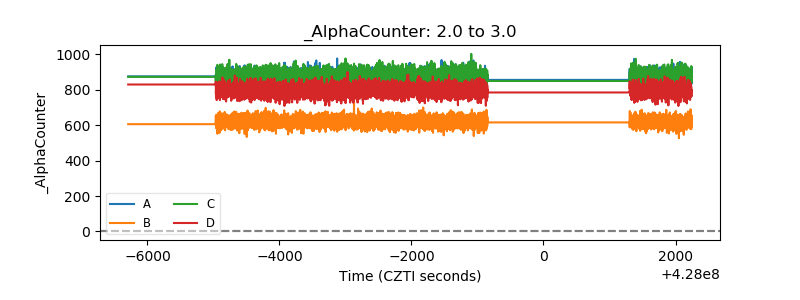 |
| _CPM_Rate | 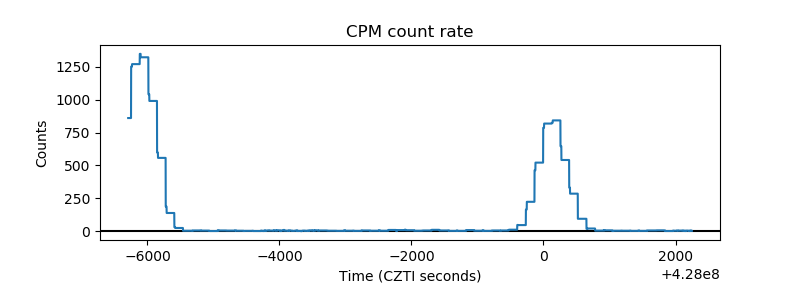 |
| CZT Counter | 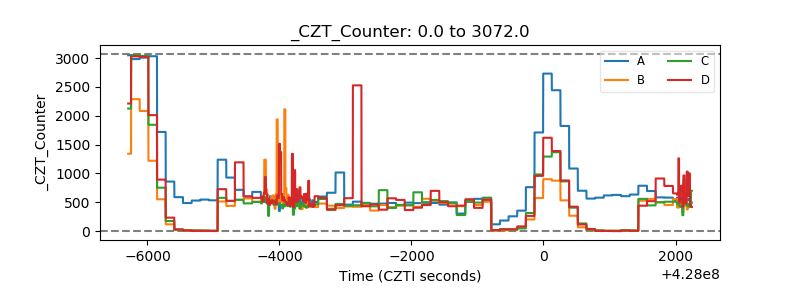 |
| +2.5 Volts monitor |  |
| +5 Volts monitor |  |
| _ROLL_ROT | 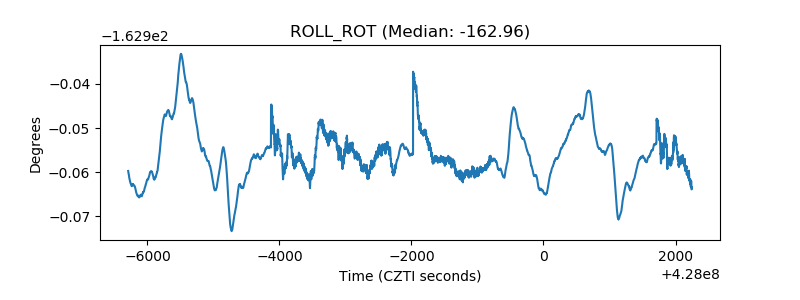 |
| _Roll_DEC | 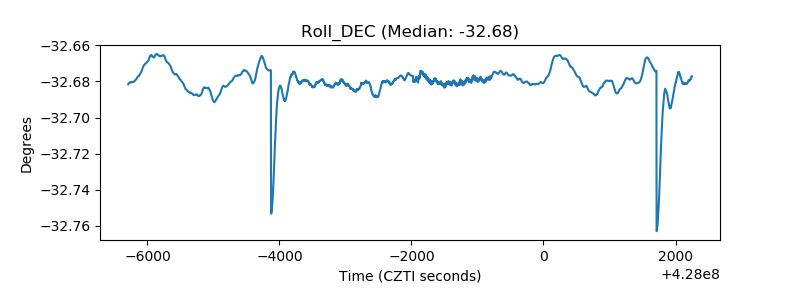 |
| _Roll_RA | 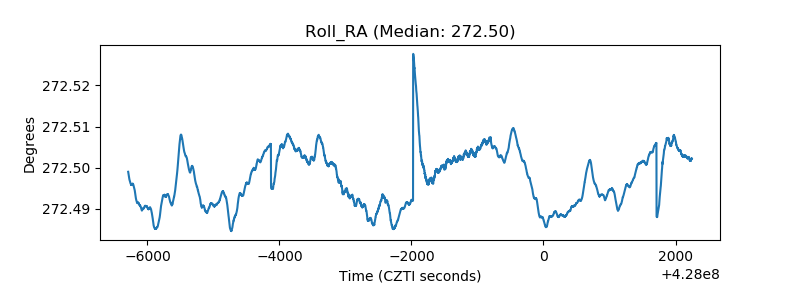 |
| Veto Counter | 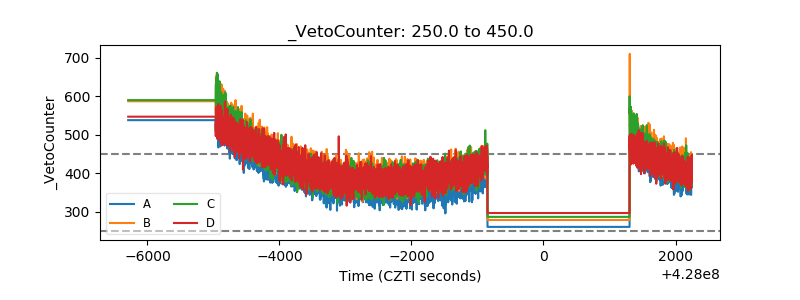 |