| Param | Original file | Final file |
|---|---|---|
| Filename | modeM0/AS1P01_999T99_9000005772_42302cztM0_level2.fits | modeM0/AS1P01_999T99_9000005772_42302cztM0_level2_quad_clean.evt |
| Size (bytes) | 303,120,000 | 89,910,720 |
| Size | 289.1 MB | 85.7 MB |
| Events in quadrant A | 2,844,464 | 610,628 |
| Events in quadrant B | 2,519,400 | 622,002 |
| Events in quadrant C | 2,375,620 | 587,013 |
| Events in quadrant D | 3,079,884 | 542,047 |
| Mode M0 | |||
|---|---|---|---|
| Quadrant | BADHDUFLAG | Total packets | Discarded packets |
| A | 0 | 11504 | 2 |
| B | 0 | 10974 | 2 |
| C | 0 | 10384 | 2 |
| D | 0 | 12758 | 2 |
| Mode SS | |||
|---|---|---|---|
| Quadrant | BADHDUFLAG | Total packets | Discarded packets |
| A | 0 | 106 | 0 |
| B | 0 | 106 | 0 |
| C | 0 | 106 | 0 |
| D | 0 | 106 | 0 |
| Mode M9 | |||
|---|---|---|---|
| Quadrant | BADHDUFLAG | Total packets | Discarded packets |
| A | 0 | 23 | 0 |
| B | 0 | 24 | 0 |
| C | 0 | 24 | 0 |
| D | 0 | 24 | 0 |
| Quadrant | Total seconds | Saturated seconds | Saturation percentage |
|---|---|---|---|
| A | 5147 | 19 | 0.369147% |
| B | 5147 | 28 | 0.544006% |
| C | 5147 | 4 | 0.077715% |
| D | 5147 | 47 | 0.913153% |
Noise dominated data is calculated using 1-second bins in cleaned event files. If a bin has >2000 counts, and if more than 50% of those come from <1% of pixels, then it is considered to be noise-dominated and hence unusable.
| Quadrant | # 1 sec bins | Bins with >0 counts | Bins with >2000 counts | High rate bins dominated by noise | Noise dominated (total time) | Noise dominated (detector-on time) | Marked lightcurve |
|---|---|---|---|---|---|---|---|
| A | 7240 | 5148 | 7 | 7 | 0.10% | 0.14% | 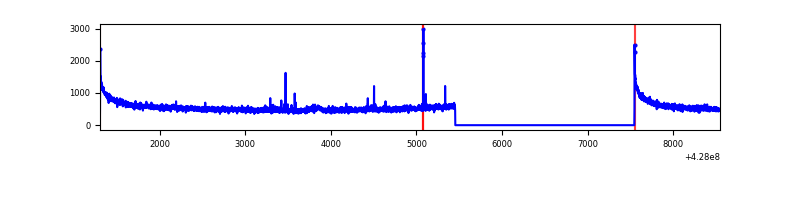 |
| B | 7240 | 5148 | 15 | 15 | 0.21% | 0.29% | 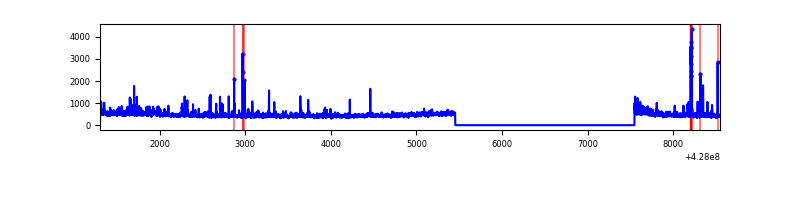 |
| C | 7240 | 5148 | 0 | 0 | 0.00% | 0.00% | 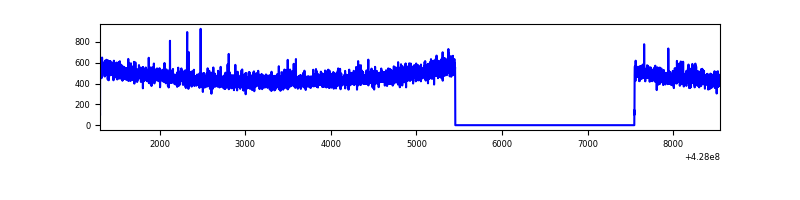 |
| D | 7240 | 5148 | 47 | 47 | 0.65% | 0.91% | 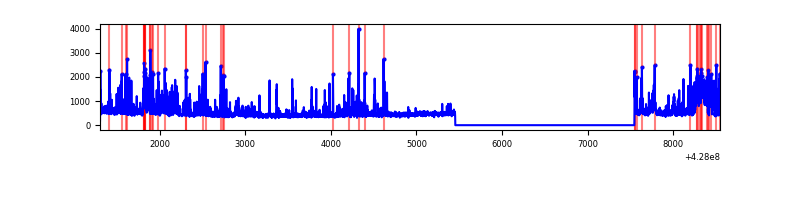 |
Top three noisy pixels from each quadrant. If the there are fewer than three noisy pixels in the level2.evt file, extra rows are filled as -1
| Pixel properties | Quadrant properties | ||||||
|---|---|---|---|---|---|---|---|
| Quadrant | DetID | PixID | Counts | Sigma | Mean | Median | Sigma |
| A | 10 | 83 | 585260 | 4963.56 | 573 | 563 | 117.8 |
| A | 13 | 248 | 17517 | 143.92 | 573 | 563 | 117.8 |
| A | 15 | 252 | 16393 | 134.38 | 573 | 563 | 117.8 |
| B | 4 | 171 | 89372 | 806.51 | 571 | 557 | 110.1 |
| B | 0 | 229 | 61098 | 549.76 | 571 | 557 | 110.1 |
| B | 5 | 32 | 42092 | 377.17 | 571 | 557 | 110.1 |
| C | 15 | 214 | 216776 | 1687.96 | 551 | 555 | 128.1 |
| C | 12 | 249 | 7827 | 56.77 | 551 | 555 | 128.1 |
| C | 13 | 61 | 3775 | 25.13 | 551 | 555 | 128.1 |
| D | 1 | 52 | 466999 | 3415.88 | 550 | 533 | 136.6 |
| D | 5 | 171 | 126140 | 919.81 | 550 | 533 | 136.6 |
| D | 12 | 233 | 98550 | 717.77 | 550 | 533 | 136.6 |
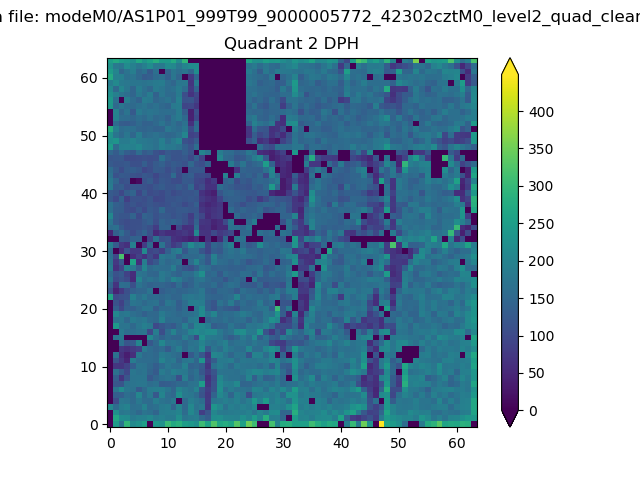
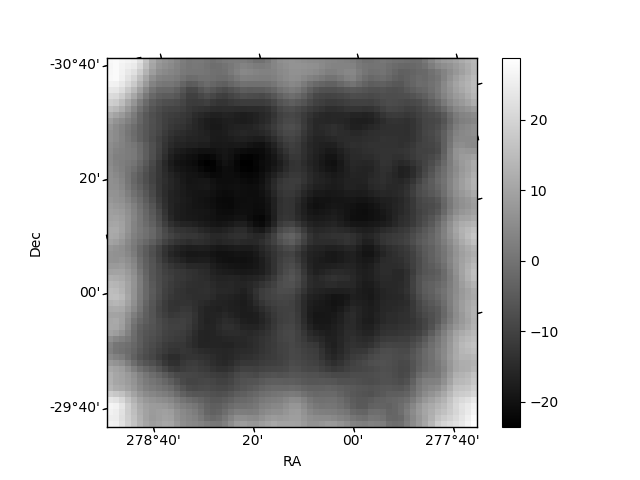
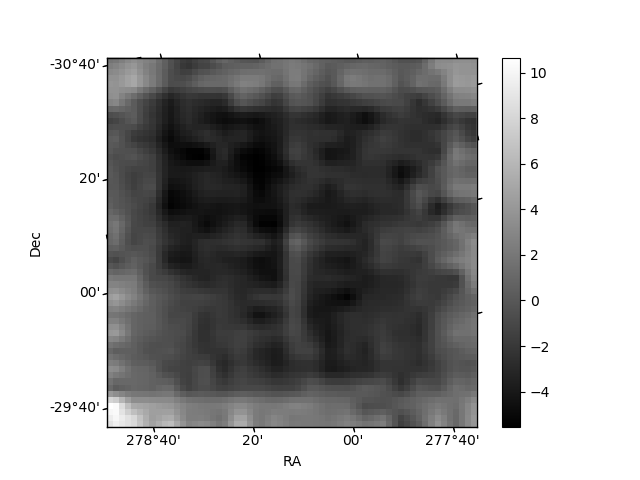
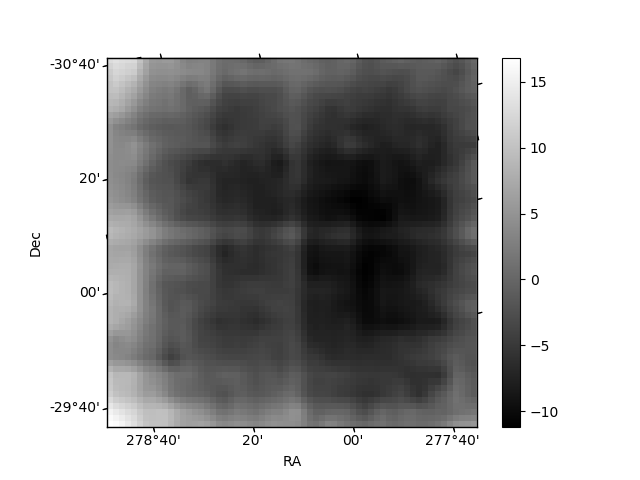
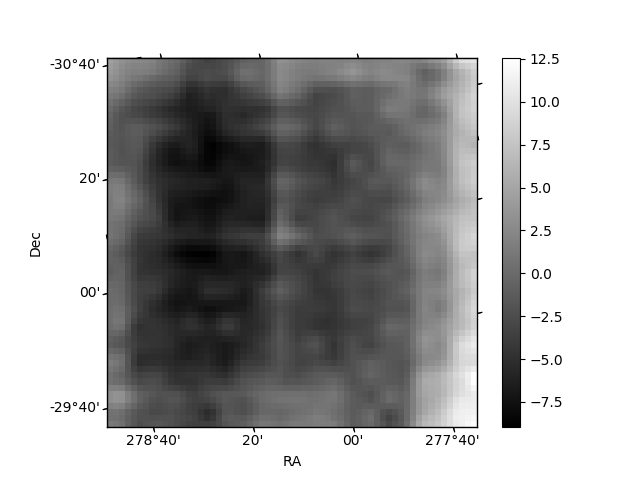
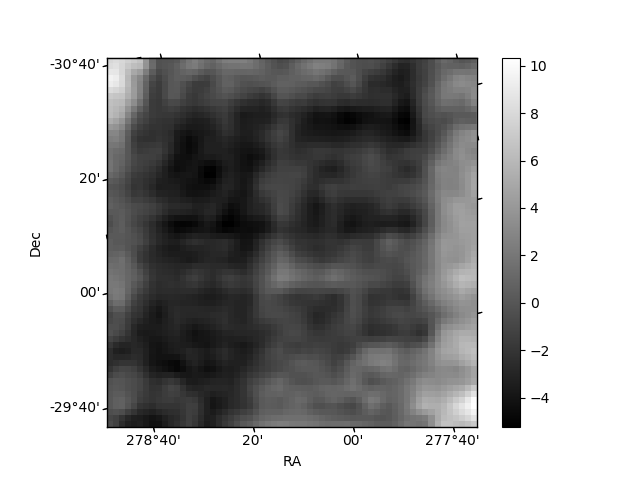
Histogram calculated using DETX and DETY for each event in the final _common_clean file
| Quadrant A | 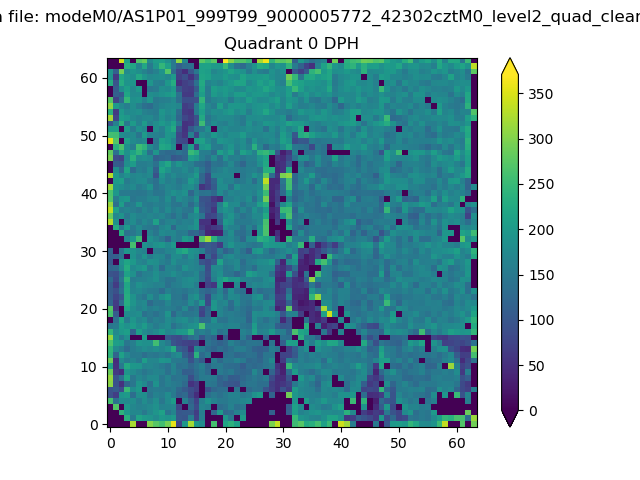 |
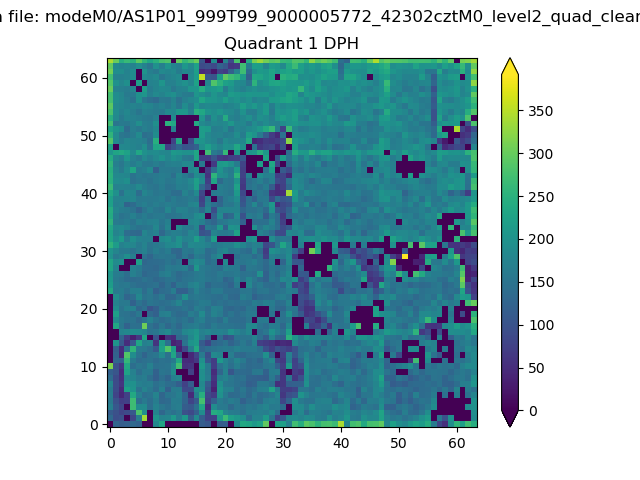 |
Quadrant B |
|---|---|---|---|
| Quadrant D | 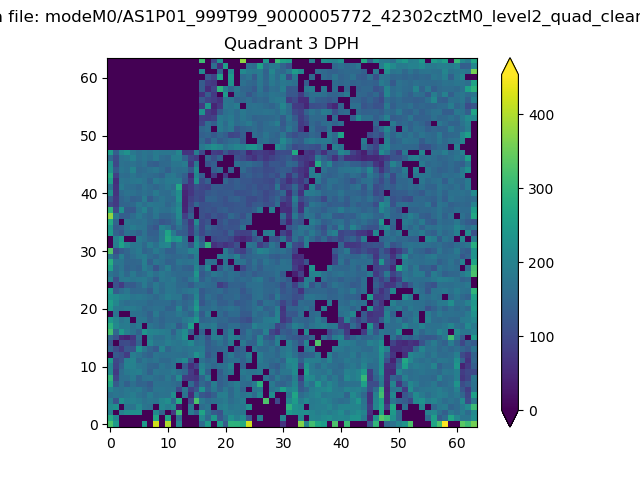 |
 |
Quadrant C |
| Plot type | Count rate plots | Images |
|---|---|---|
| Comparison with Poisson distribution Blue bars denote a histogram of data divided into 1 sec bins. Red curve is a Poisson curve with rate = median count rate of data. |
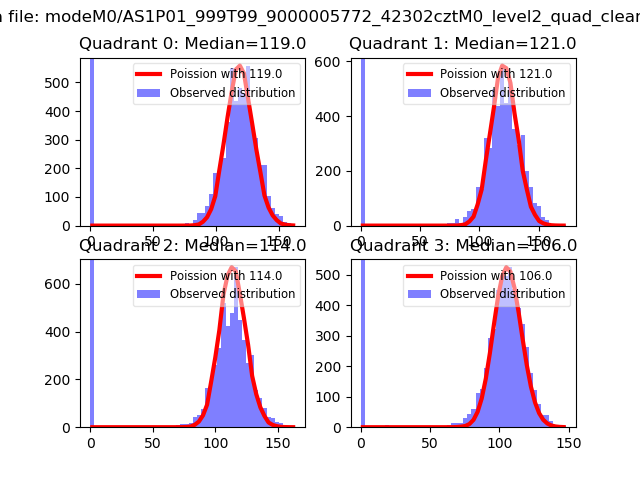 |
 |
| Quadrant-wise count rates Data is divided into 100 sec bins |
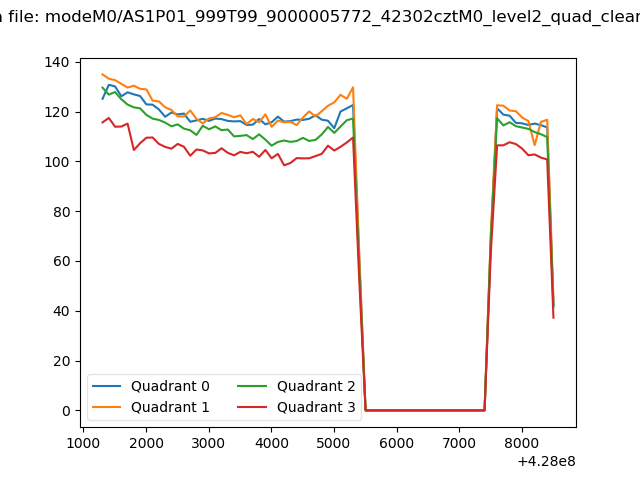 |
|
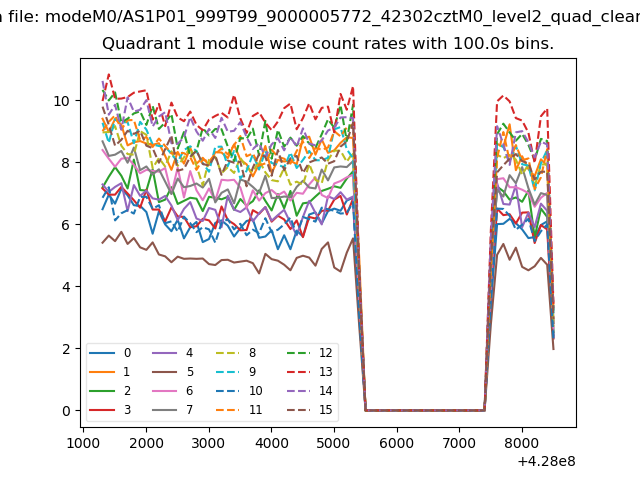
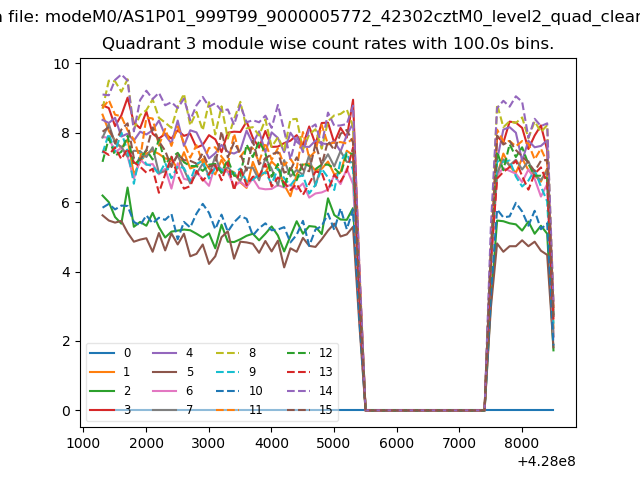
| Module-wise count rates for Quadrant A Data is divided into 100 sec bins |
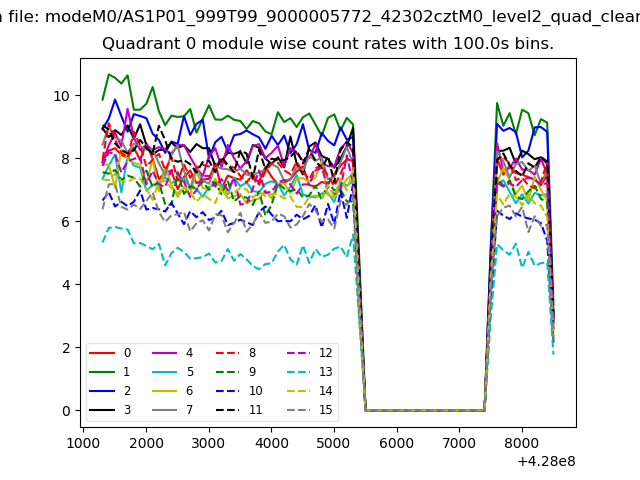 |
 |
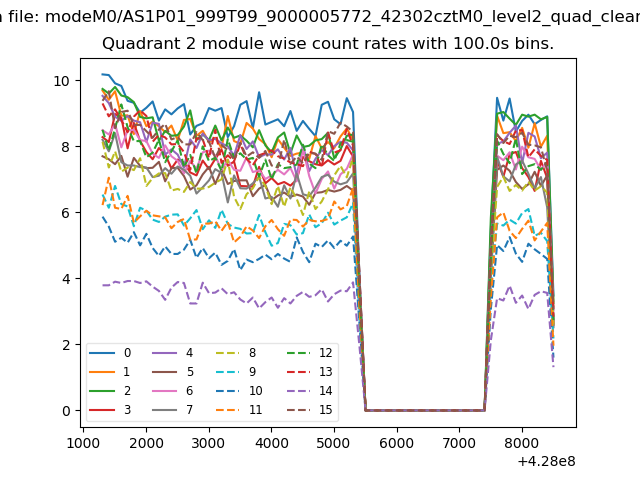
| Module-wise count rates for Quadrant B Data is divided into 100 sec bins |
 |
 |
| Module-wise count rates for Quadrant C Data is divided into 100 sec bins |
 |
 |
| Module-wise count rates for Quadrant D Data is divided into 100 sec bins |
 |
 |
| Parameter | Plot |
|---|---|
| CZT HV Monitor | 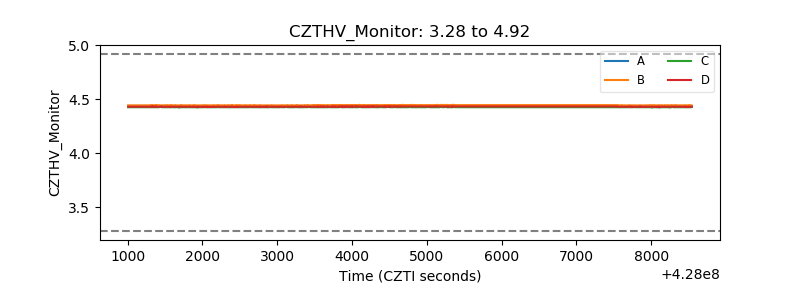 |
| D_VDD | 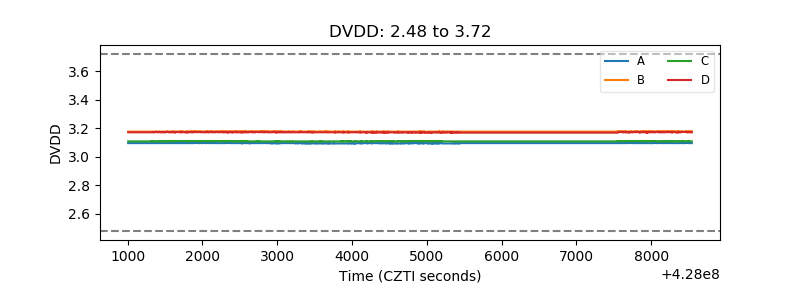 |
| Temperature 1 | 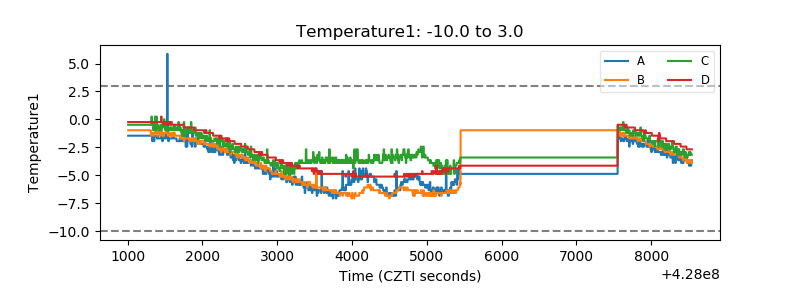 |
| Veto HV Monitor | 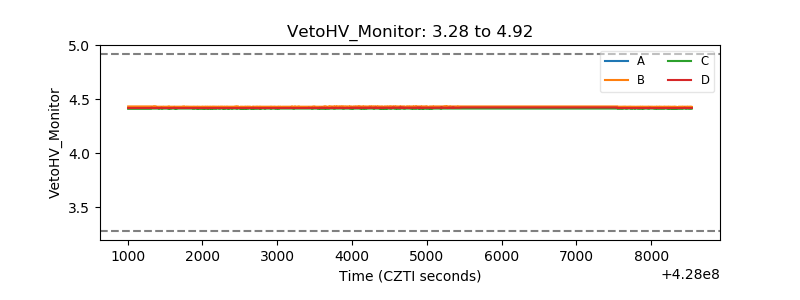 |
| Veto LLD | 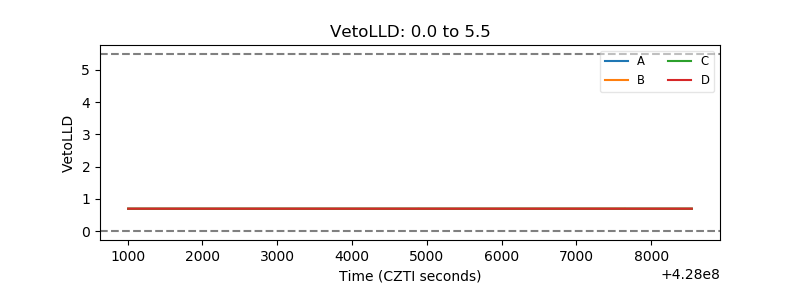 |
| Alpha Counter | 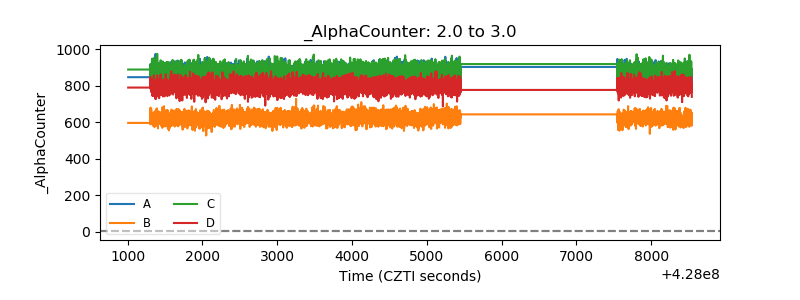 |
| _CPM_Rate | 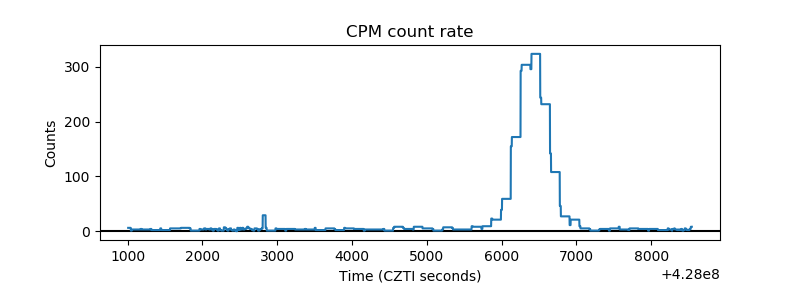 |
| CZT Counter | 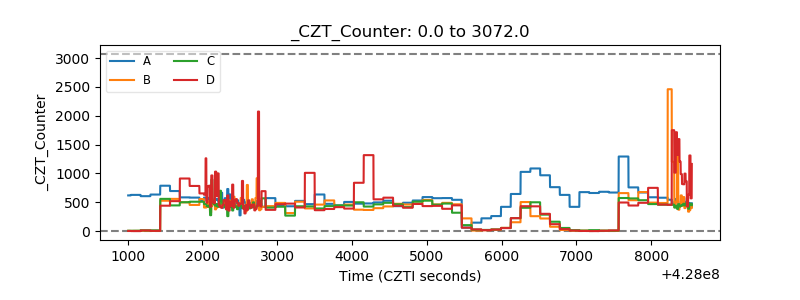 |
| +2.5 Volts monitor |  |
| +5 Volts monitor |  |
| _ROLL_ROT | 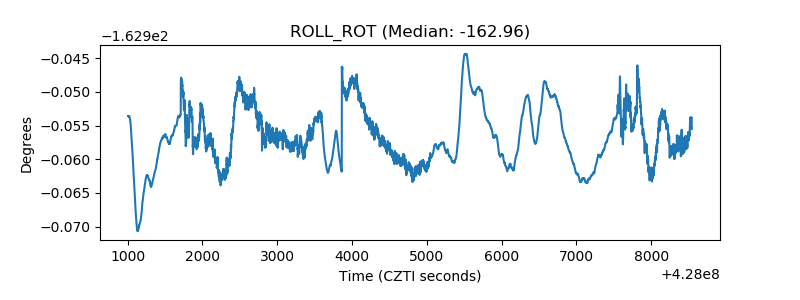 |
| _Roll_DEC | 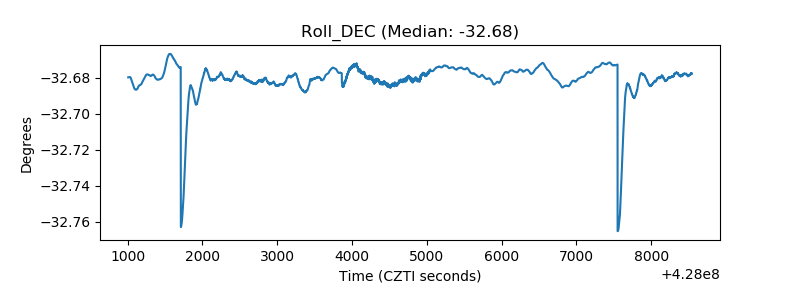 |
| _Roll_RA | 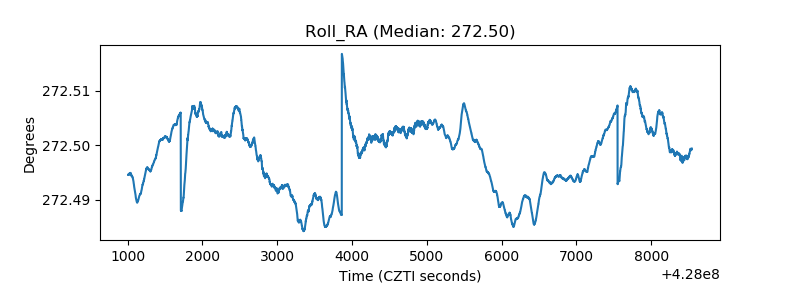 |
| Veto Counter | 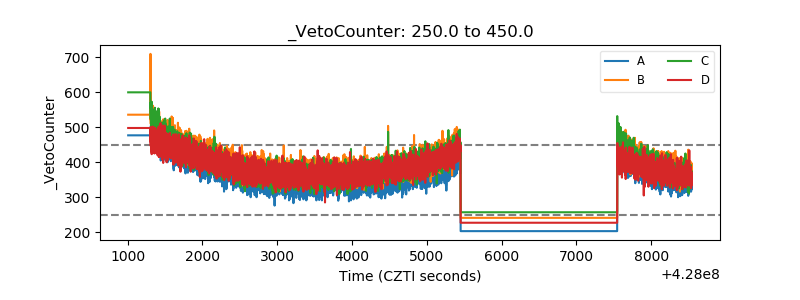 |