| Param | Original file | Final file |
|---|---|---|
| Filename | modeM0/AS1P01_999T99_9000005772_42304cztM0_level2.fits | modeM0/AS1P01_999T99_9000005772_42304cztM0_level2_quad_clean.evt |
| Size (bytes) | 311,670,720 | 88,862,400 |
| Size | 297.2 MB | 84.7 MB |
| Events in quadrant A | 2,971,907 | 598,816 |
| Events in quadrant B | 2,675,141 | 612,033 |
| Events in quadrant C | 2,466,892 | 577,402 |
| Events in quadrant D | 3,000,330 | 523,074 |
| Mode M0 | |||
|---|---|---|---|
| Quadrant | BADHDUFLAG | Total packets | Discarded packets |
| A | 0 | 12095 | 2 |
| B | 0 | 11771 | 2 |
| C | 0 | 10915 | 2 |
| D | 0 | 12795 | 2 |
| Mode SS | |||
|---|---|---|---|
| Quadrant | BADHDUFLAG | Total packets | Discarded packets |
| A | 0 | 110 | 0 |
| B | 0 | 110 | 0 |
| C | 0 | 110 | 0 |
| D | 0 | 110 | 0 |
| Mode M9 | |||
|---|---|---|---|
| Quadrant | BADHDUFLAG | Total packets | Discarded packets |
| A | 0 | 32 | 0 |
| B | 0 | 33 | 0 |
| C | 0 | 33 | 0 |
| D | 0 | 33 | 0 |
| Quadrant | Total seconds | Saturated seconds | Saturation percentage |
|---|---|---|---|
| A | 5420 | 19 | 0.350554% |
| B | 5420 | 39 | 0.719557% |
| C | 5420 | 3 | 0.055351% |
| D | 5419 | 131 | 2.417420% |
Noise dominated data is calculated using 1-second bins in cleaned event files. If a bin has >2000 counts, and if more than 50% of those come from <1% of pixels, then it is considered to be noise-dominated and hence unusable.
| Quadrant | # 1 sec bins | Bins with >0 counts | Bins with >2000 counts | High rate bins dominated by noise | Noise dominated (total time) | Noise dominated (detector-on time) | Marked lightcurve |
|---|---|---|---|---|---|---|---|
| A | 7034 | 5421 | 8 | 8 | 0.11% | 0.15% | 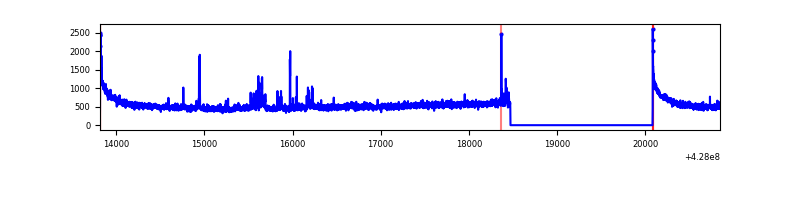 |
| B | 7034 | 5421 | 20 | 20 | 0.28% | 0.37% | 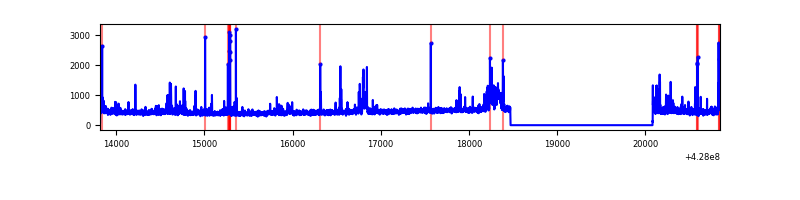 |
| C | 7034 | 5421 | 0 | 0 | 0.00% | 0.00% | 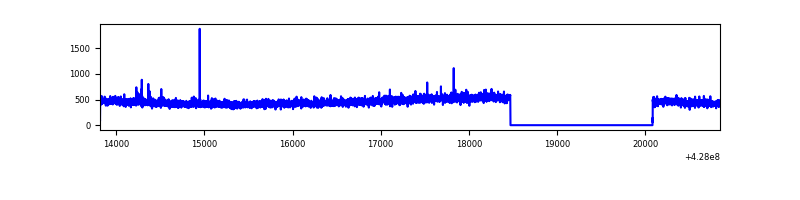 |
| D | 7033 | 5420 | 129 | 129 | 1.83% | 2.38% | 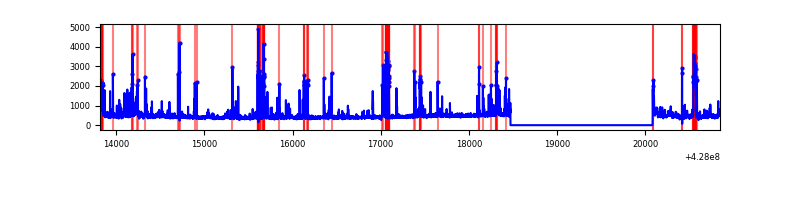 |
Top three noisy pixels from each quadrant. If the there are fewer than three noisy pixels in the level2.evt file, extra rows are filled as -1
| Pixel properties | Quadrant properties | ||||||
|---|---|---|---|---|---|---|---|
| Quadrant | DetID | PixID | Counts | Sigma | Mean | Median | Sigma |
| A | 10 | 83 | 562090 | 4666.63 | 586 | 576 | 120.3 |
| A | 7 | 3 | 81851 | 675.46 | 586 | 576 | 120.3 |
| A | 13 | 248 | 39604 | 324.35 | 586 | 576 | 120.3 |
| B | 0 | 245 | 135381 | 1176.76 | 586 | 568 | 114.6 |
| B | 4 | 171 | 87249 | 756.63 | 586 | 568 | 114.6 |
| B | 5 | 255 | 83824 | 726.73 | 586 | 568 | 114.6 |
| C | 15 | 214 | 228054 | 1704.49 | 570 | 575 | 133.5 |
| C | 12 | 249 | 13198 | 94.58 | 570 | 575 | 133.5 |
| C | 13 | 61 | 3868 | 24.67 | 570 | 575 | 133.5 |
| D | 1 | 52 | 336034 | 2413.73 | 562 | 545 | 139.0 |
| D | 12 | 6 | 111935 | 801.41 | 562 | 545 | 139.0 |
| D | 5 | 171 | 94700 | 677.41 | 562 | 545 | 139.0 |
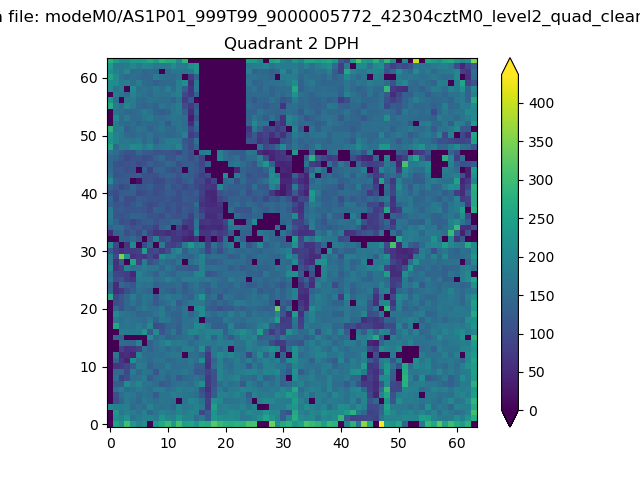
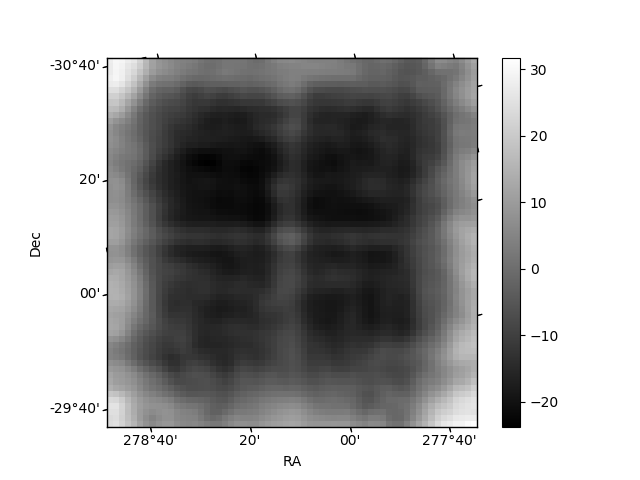
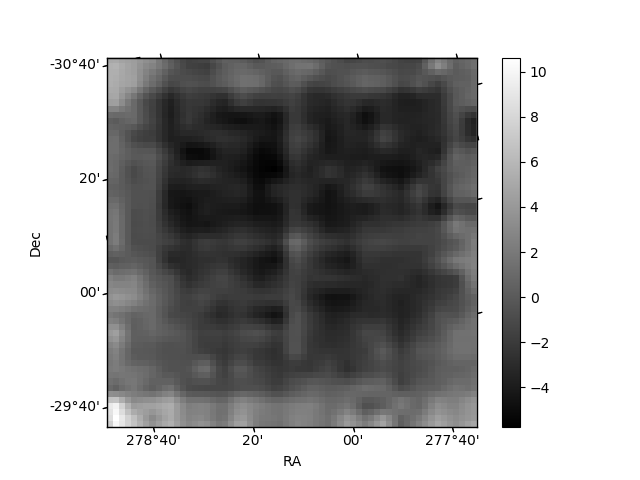
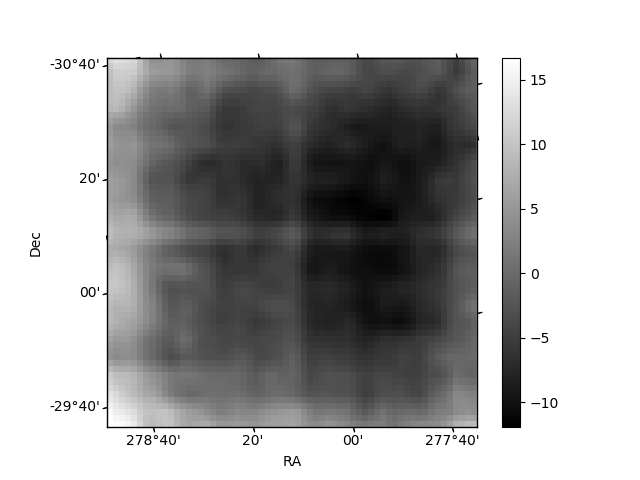
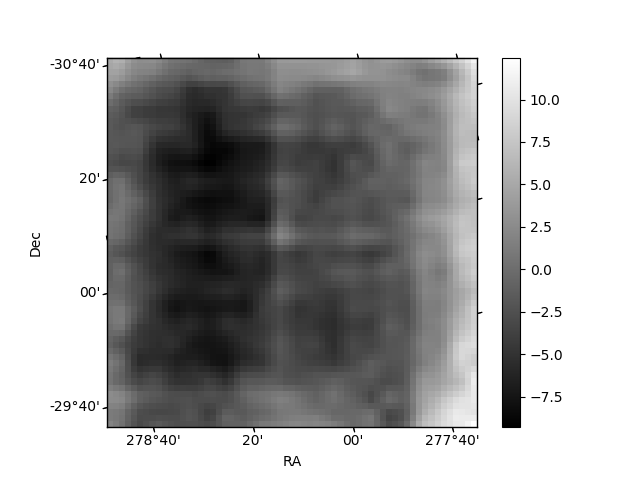
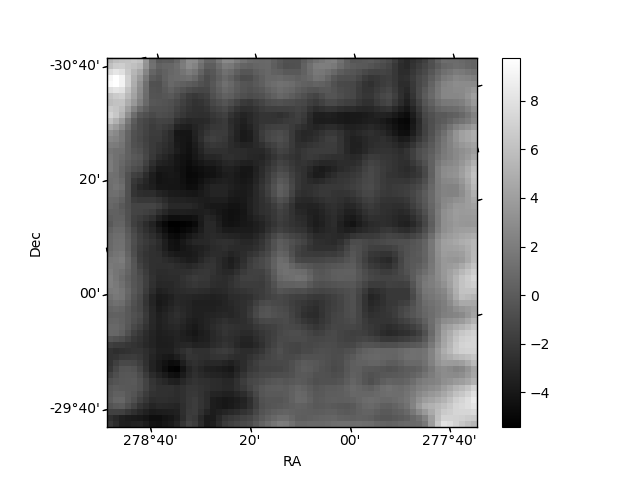
Histogram calculated using DETX and DETY for each event in the final _common_clean file
| Quadrant A | 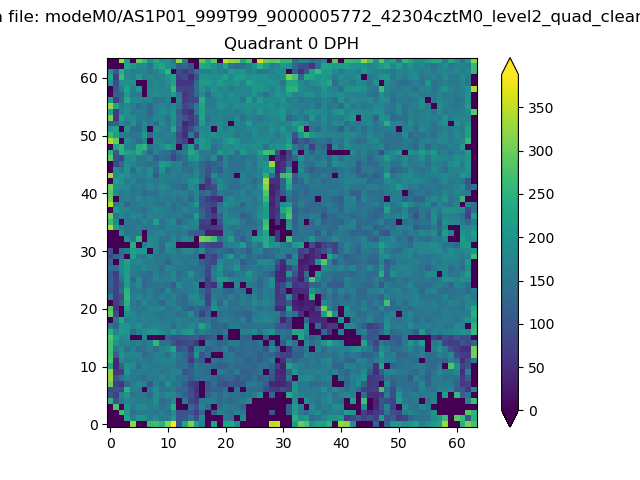 |
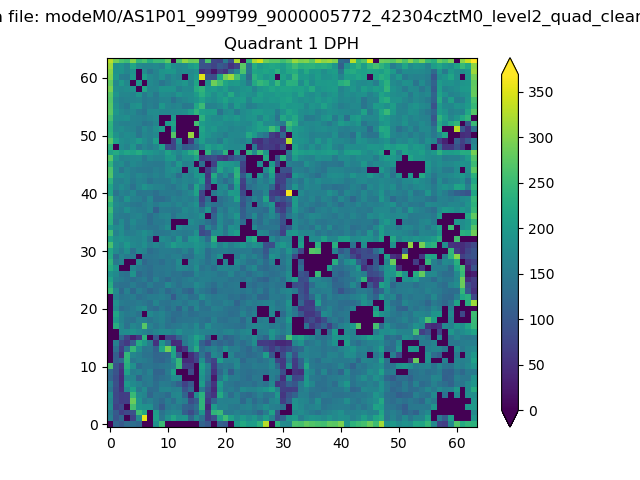 |
Quadrant B |
|---|---|---|---|
| Quadrant D | 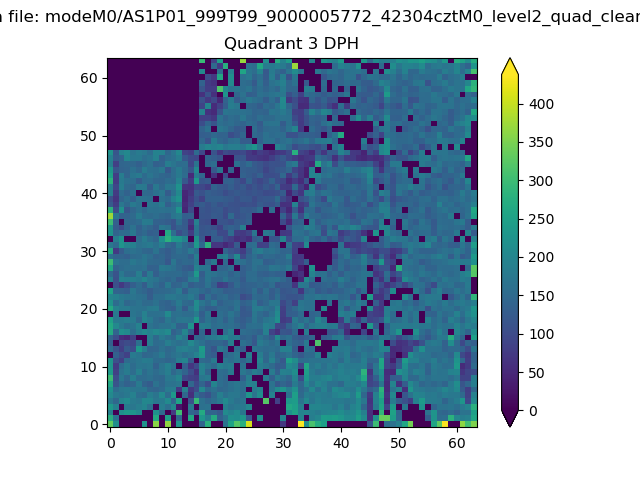 |
 |
Quadrant C |
| Plot type | Count rate plots | Images |
|---|---|---|
| Comparison with Poisson distribution Blue bars denote a histogram of data divided into 1 sec bins. Red curve is a Poisson curve with rate = median count rate of data. |
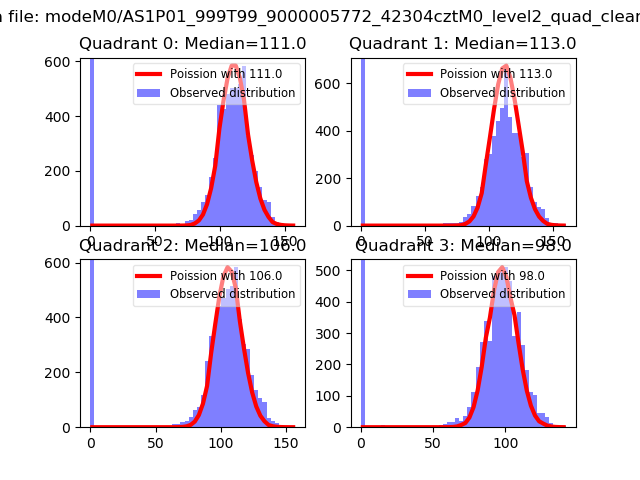 |
 |
| Quadrant-wise count rates Data is divided into 100 sec bins |
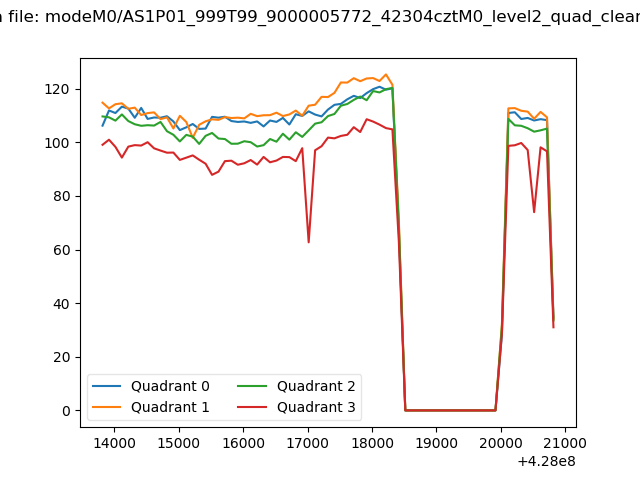 |
|
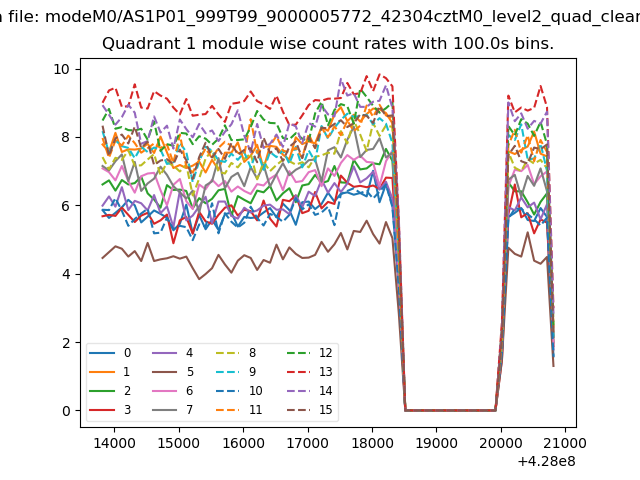
| Module-wise count rates for Quadrant A Data is divided into 100 sec bins |
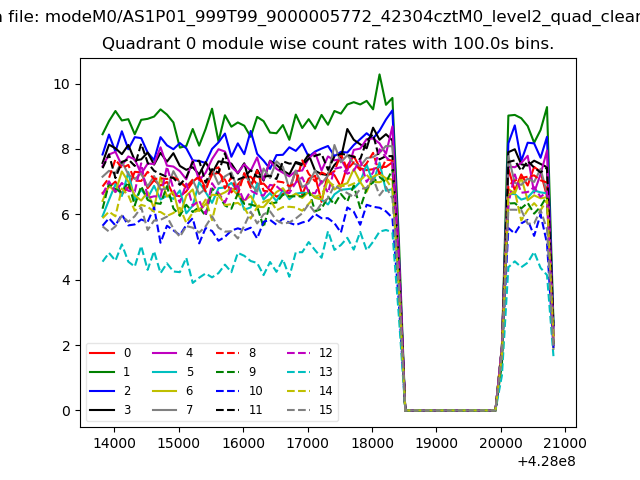 |
 |
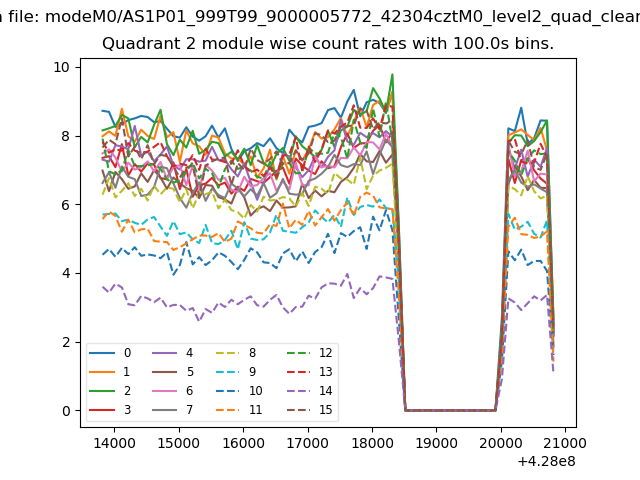
| Module-wise count rates for Quadrant B Data is divided into 100 sec bins |
 |
 |
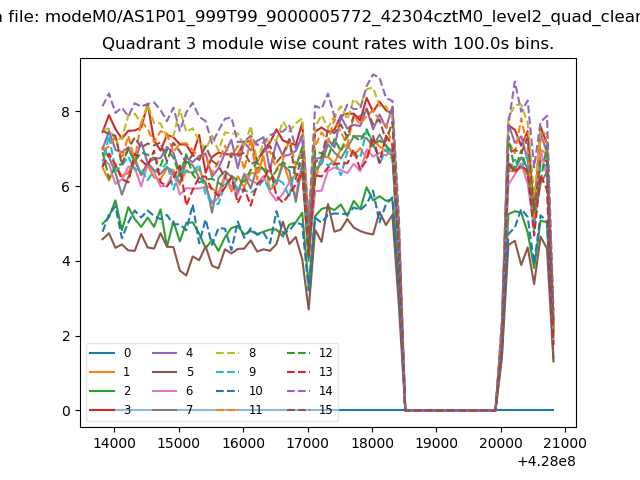
| Module-wise count rates for Quadrant C Data is divided into 100 sec bins |
 |
 |
| Module-wise count rates for Quadrant D Data is divided into 100 sec bins |
 |
 |
| Parameter | Plot |
|---|---|
| CZT HV Monitor | 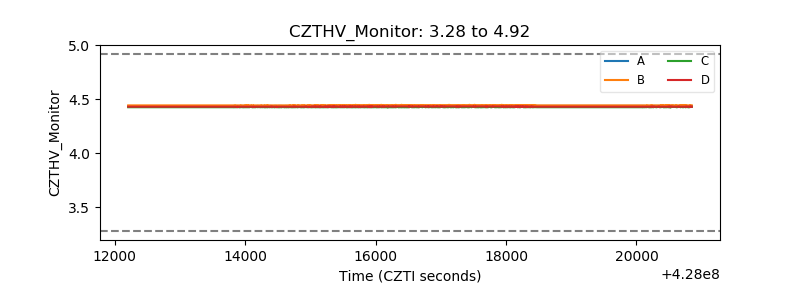 |
| D_VDD | 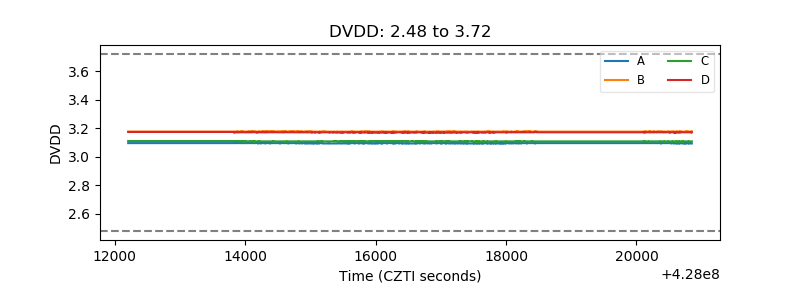 |
| Temperature 1 | 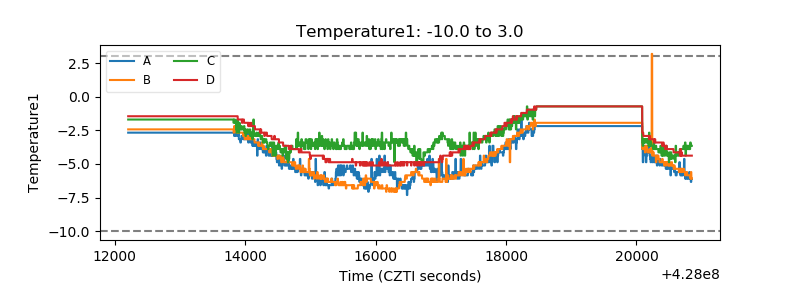 |
| Veto HV Monitor | 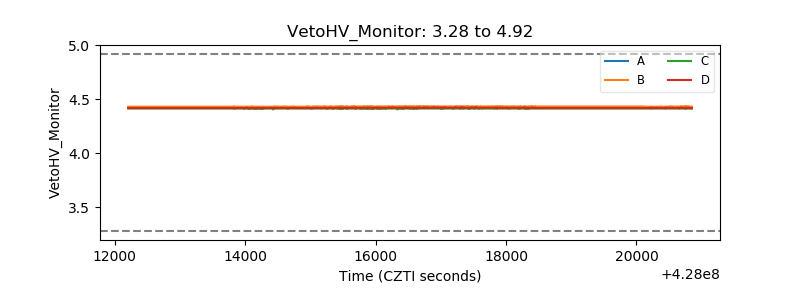 |
| Veto LLD | 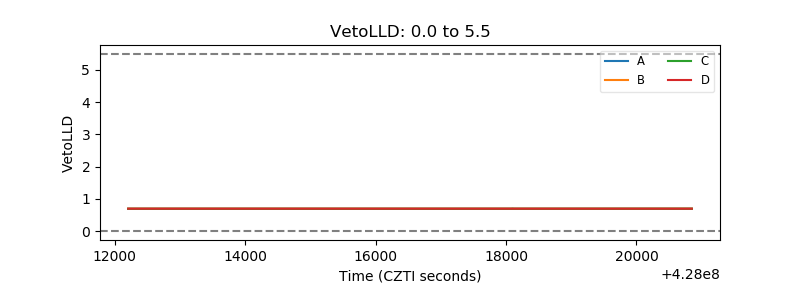 |
| Alpha Counter | 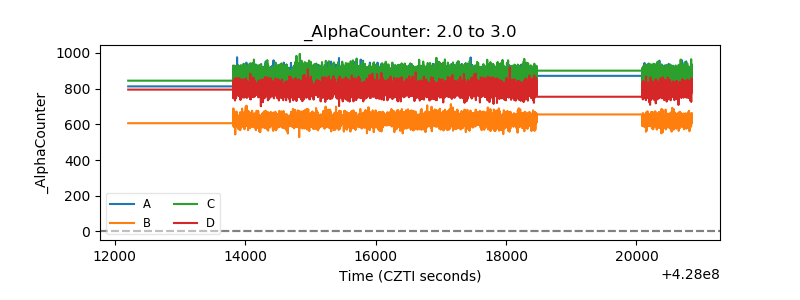 |
| _CPM_Rate | 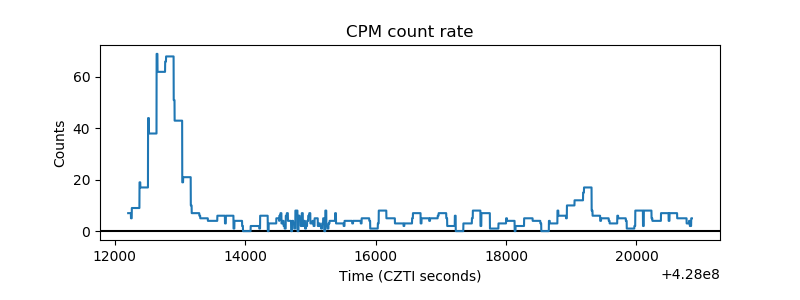 |
| CZT Counter | 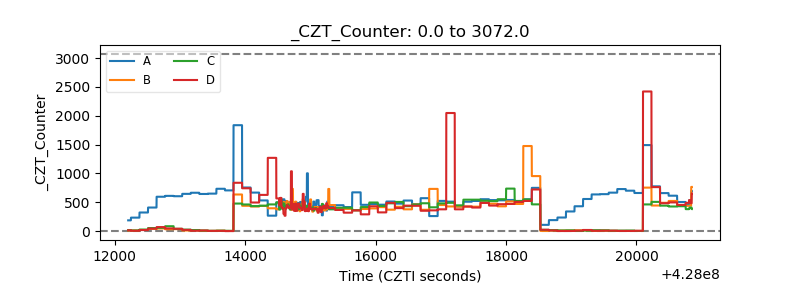 |
| +2.5 Volts monitor | 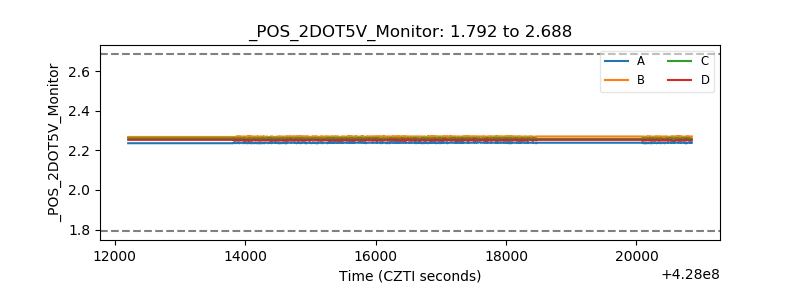 |
| +5 Volts monitor |  |
| _ROLL_ROT | 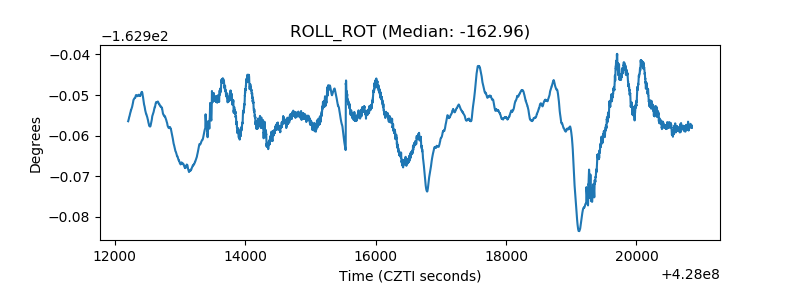 |
| _Roll_DEC | 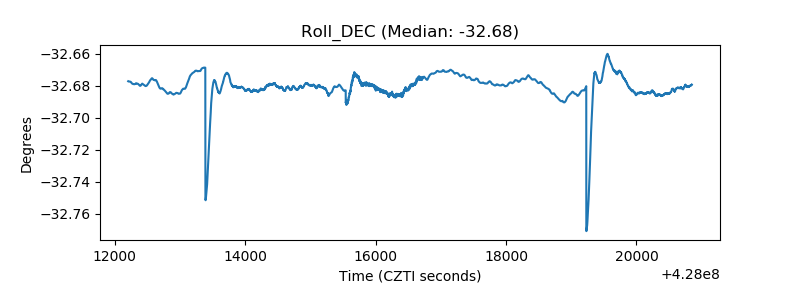 |
| _Roll_RA | 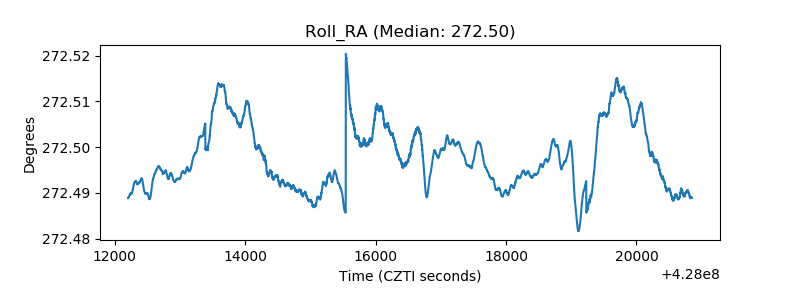 |
| Veto Counter | 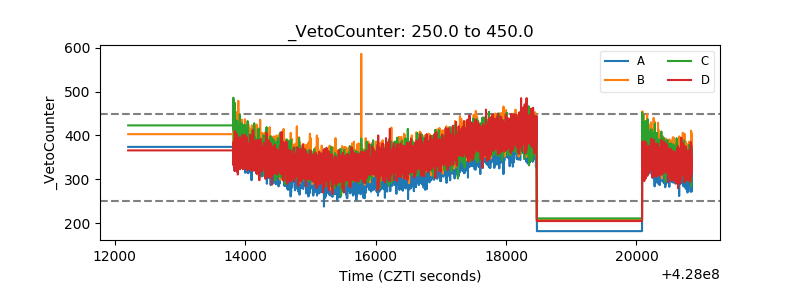 |