| Param | Original file | Final file |
|---|---|---|
| Filename | modeM0/AS1P01_999T99_9000005772_42309cztM0_level2.fits | modeM0/AS1P01_999T99_9000005772_42309cztM0_level2_quad_clean.evt |
| Size (bytes) | 531,506,880 | 136,163,520 |
| Size | 506.9 MB | 129.9 MB |
| Events in quadrant A | 4,583,391 | 910,852 |
| Events in quadrant B | 4,381,332 | 917,668 |
| Events in quadrant C | 3,973,560 | 894,269 |
| Events in quadrant D | 6,074,422 | 807,703 |
| Mode M0 | |||
|---|---|---|---|
| Quadrant | BADHDUFLAG | Total packets | Discarded packets |
| A | 0 | 18394 | 2 |
| B | 0 | 18958 | 2 |
| C | 0 | 17205 | 2 |
| D | 0 | 24092 | 2 |
| Mode SS | |||
|---|---|---|---|
| Quadrant | BADHDUFLAG | Total packets | Discarded packets |
| A | 0 | 176 | 0 |
| B | 0 | 176 | 0 |
| C | 0 | 176 | 0 |
| D | 0 | 176 | 0 |
| Mode M9 | |||
|---|---|---|---|
| Quadrant | BADHDUFLAG | Total packets | Discarded packets |
| A | 0 | 29 | 0 |
| B | 0 | 29 | 0 |
| C | 0 | 29 | 0 |
| D | 0 | 29 | 0 |
| Quadrant | Total seconds | Saturated seconds | Saturation percentage |
|---|---|---|---|
| A | 8524 | 33 | 0.387142% |
| B | 8524 | 184 | 2.158611% |
| C | 8525 | 4 | 0.046921% |
| D | 8525 | 327 | 3.835777% |
Noise dominated data is calculated using 1-second bins in cleaned event files. If a bin has >2000 counts, and if more than 50% of those come from <1% of pixels, then it is considered to be noise-dominated and hence unusable.
| Quadrant | # 1 sec bins | Bins with >0 counts | Bins with >2000 counts | High rate bins dominated by noise | Noise dominated (total time) | Noise dominated (detector-on time) | Marked lightcurve |
|---|---|---|---|---|---|---|---|
| A | 11449 | 8526 | 17 | 17 | 0.15% | 0.20% | 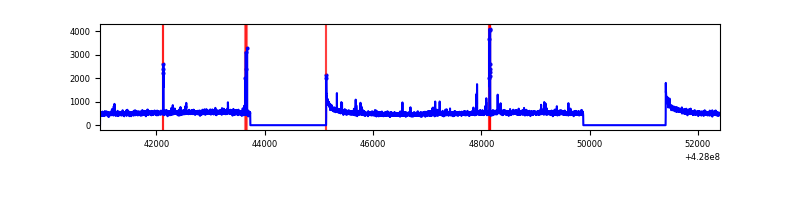 |
| B | 11449 | 8526 | 146 | 146 | 1.28% | 1.71% | 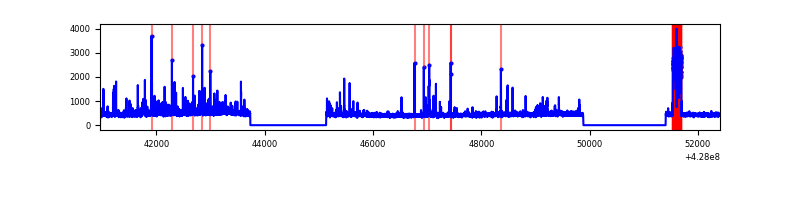 |
| C | 11450 | 8527 | 0 | 0 | 0.00% | 0.00% | 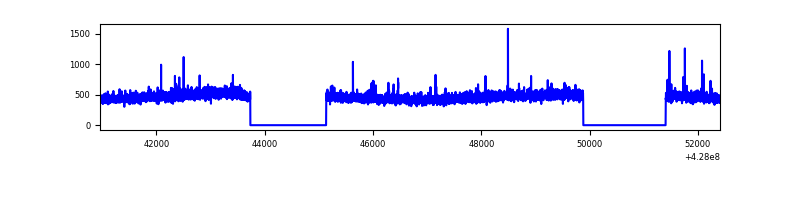 |
| D | 11450 | 8527 | 285 | 285 | 2.49% | 3.34% | 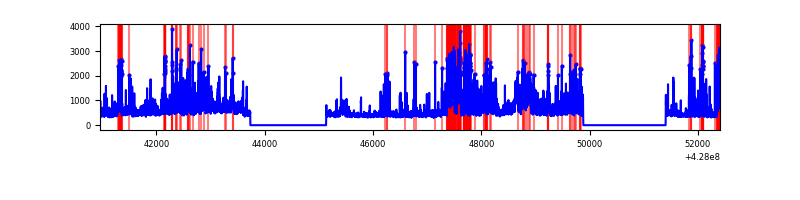 |
Top three noisy pixels from each quadrant. If the there are fewer than three noisy pixels in the level2.evt file, extra rows are filled as -1
| Pixel properties | Quadrant properties | ||||||
|---|---|---|---|---|---|---|---|
| Quadrant | DetID | PixID | Counts | Sigma | Mean | Median | Sigma |
| A | 10 | 83 | 809408 | 4183.33 | 943 | 924 | 193.3 |
| A | 15 | 235 | 45767 | 232.03 | 943 | 924 | 193.3 |
| A | 13 | 248 | 28814 | 144.31 | 943 | 924 | 193.3 |
| B | 4 | 81 | 356179 | 1994.94 | 923 | 895 | 178.1 |
| B | 4 | 171 | 179716 | 1004.09 | 923 | 895 | 178.1 |
| B | 3 | 112 | 86268 | 479.37 | 923 | 895 | 178.1 |
| C | 15 | 214 | 355647 | 1660.39 | 917 | 922 | 213.6 |
| C | 15 | 159 | 25433 | 114.73 | 917 | 922 | 213.6 |
| C | 12 | 249 | 8704 | 36.43 | 917 | 922 | 213.6 |
| D | 1 | 52 | 1309054 | 5855.12 | 912 | 886 | 223.4 |
| D | 12 | 233 | 604344 | 2700.97 | 912 | 886 | 223.4 |
| D | 2 | 16 | 153945 | 685.06 | 912 | 886 | 223.4 |
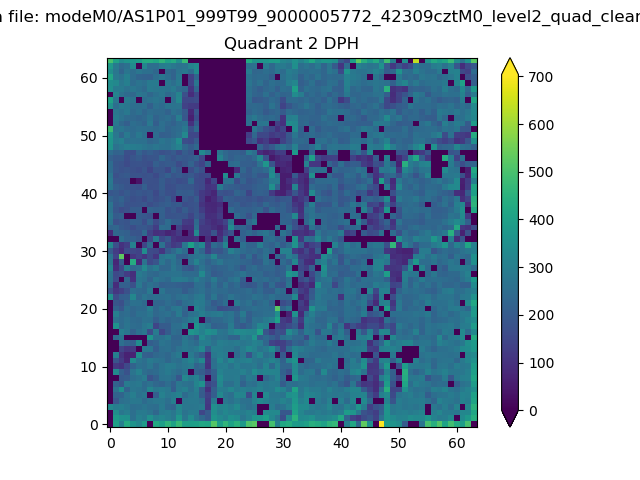
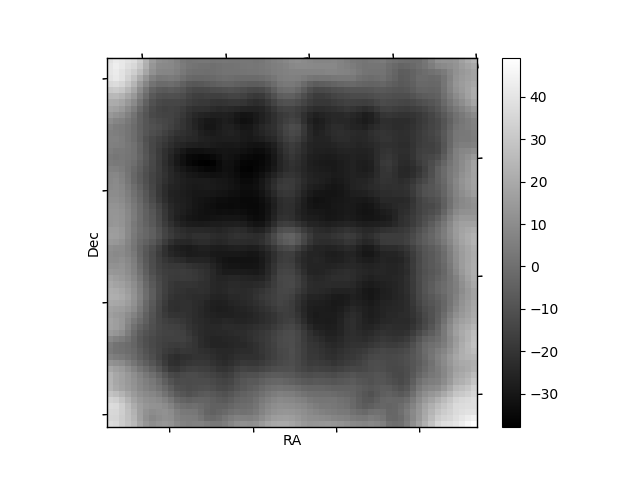
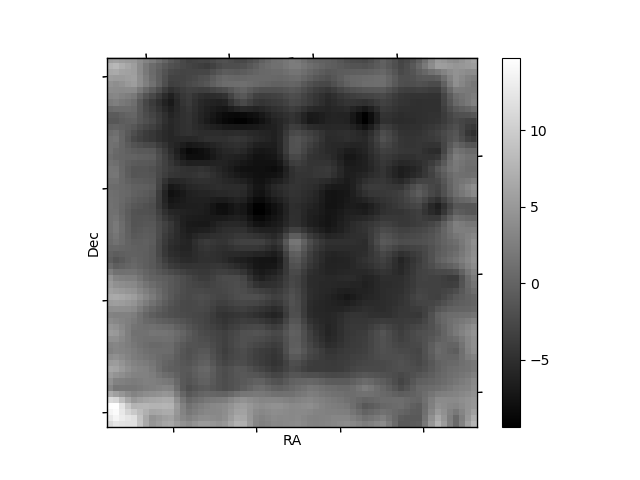
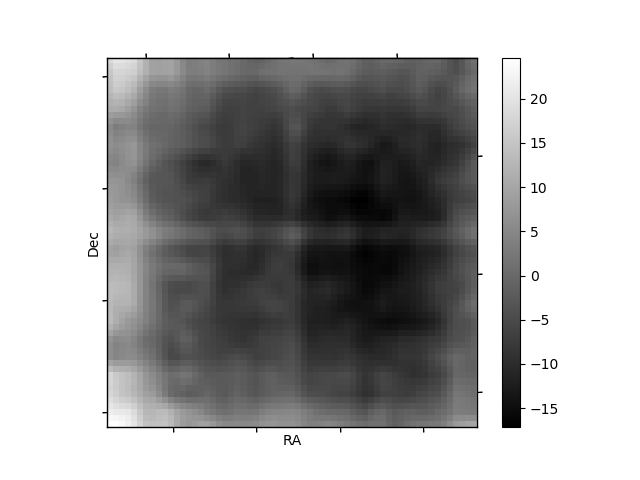
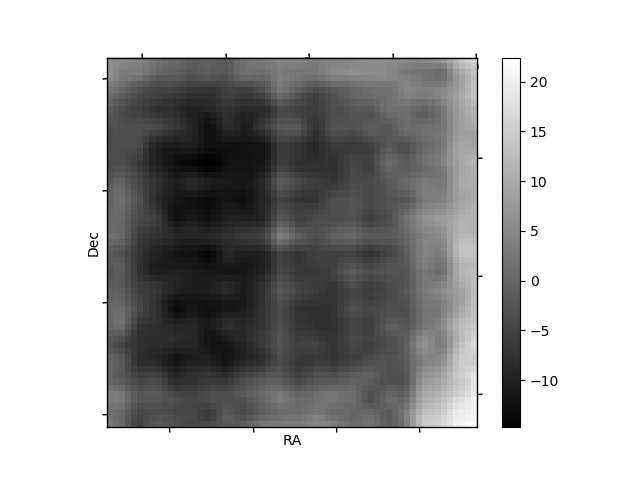
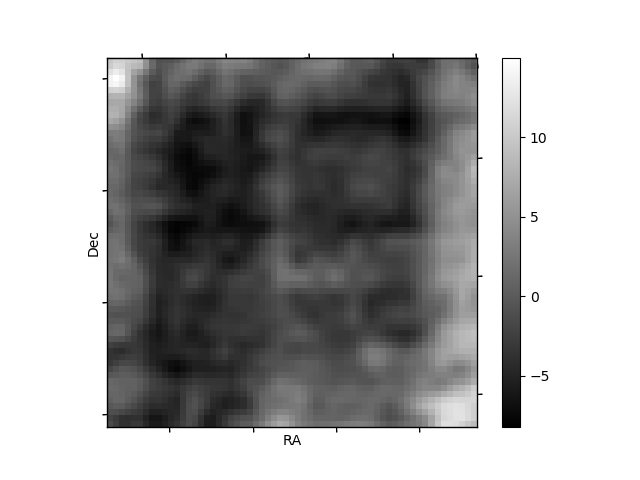
Histogram calculated using DETX and DETY for each event in the final _common_clean file
| Quadrant A | 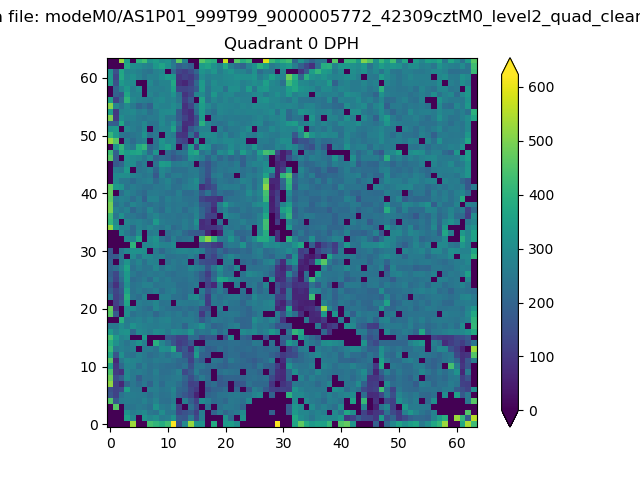 |
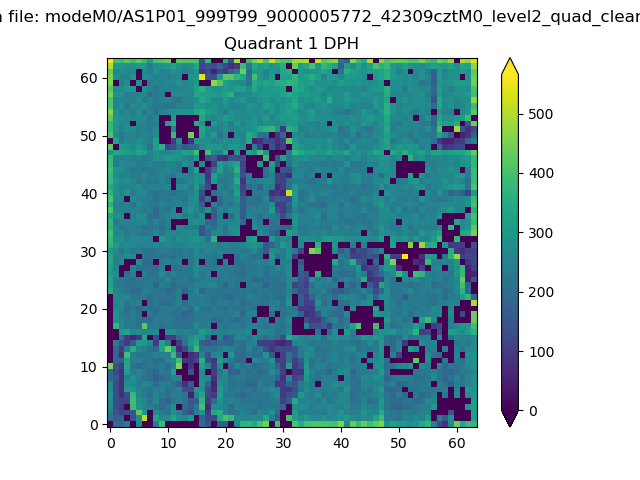 |
Quadrant B |
|---|---|---|---|
| Quadrant D | 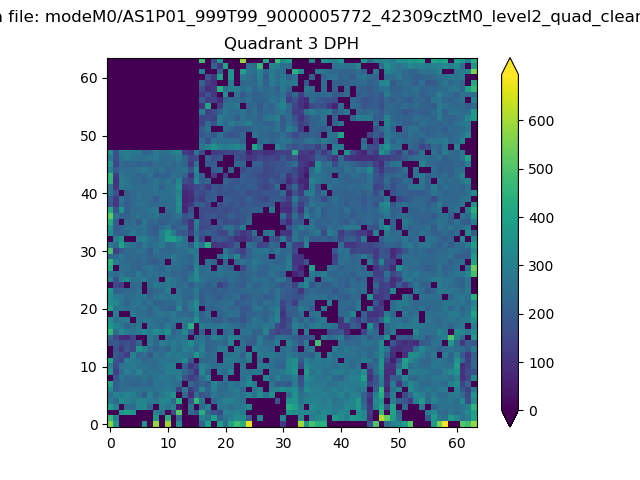 |
 |
Quadrant C |
| Plot type | Count rate plots | Images |
|---|---|---|
| Comparison with Poisson distribution Blue bars denote a histogram of data divided into 1 sec bins. Red curve is a Poisson curve with rate = median count rate of data. |
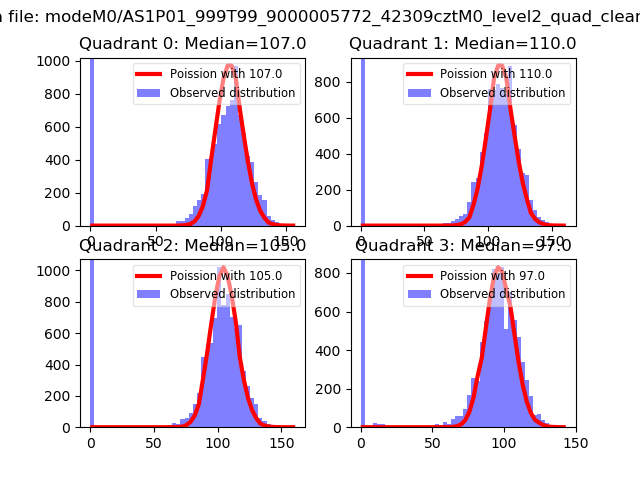 |
 |
| Quadrant-wise count rates Data is divided into 100 sec bins |
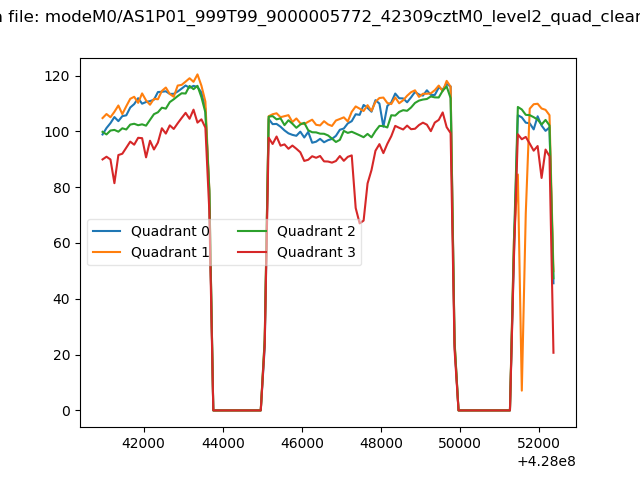 |
|
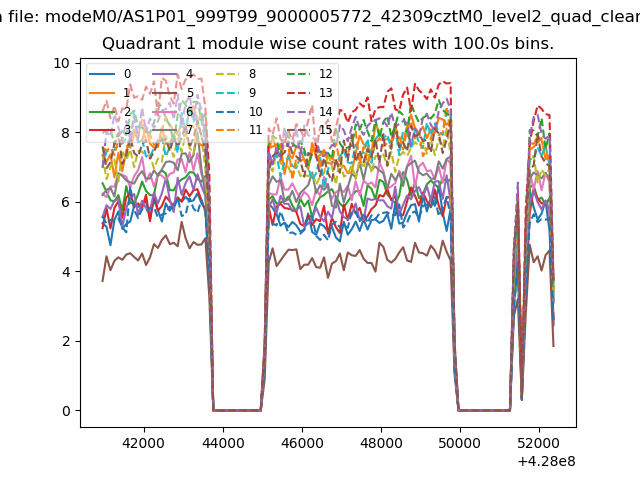
| Module-wise count rates for Quadrant A Data is divided into 100 sec bins |
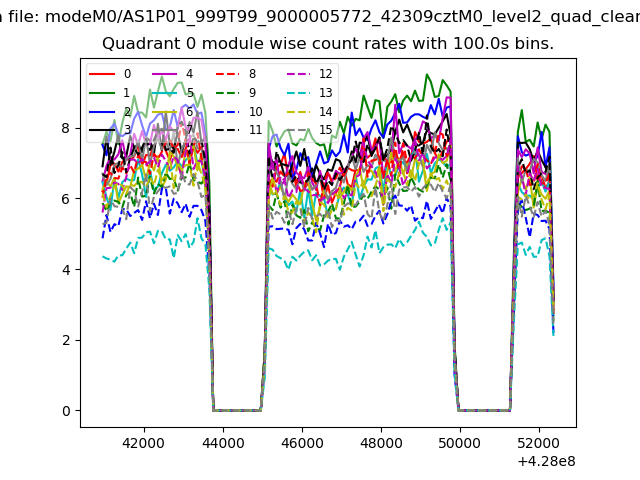 |
 |
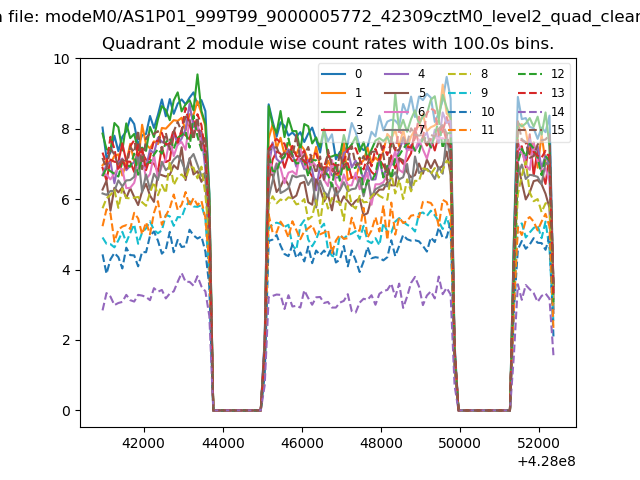
| Module-wise count rates for Quadrant B Data is divided into 100 sec bins |
 |
 |
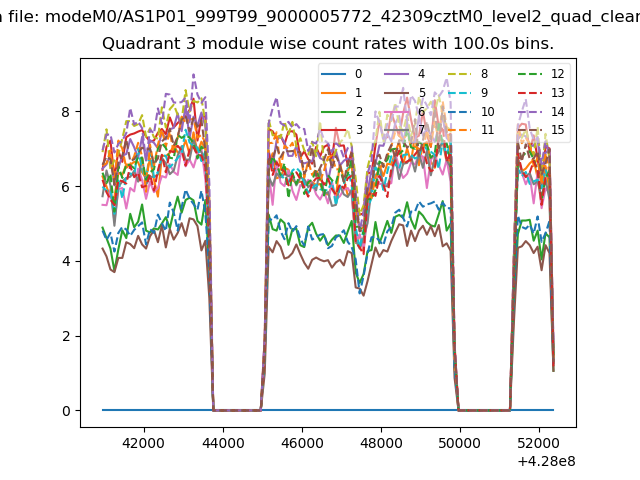
| Module-wise count rates for Quadrant C Data is divided into 100 sec bins |
 |
 |
| Module-wise count rates for Quadrant D Data is divided into 100 sec bins |
 |
 |
| Parameter | Plot |
|---|---|
| CZT HV Monitor | 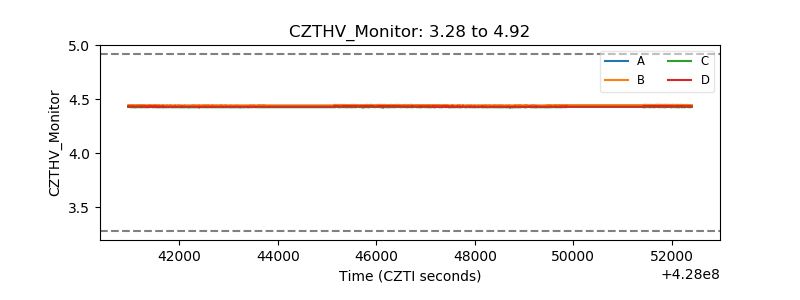 |
| D_VDD | 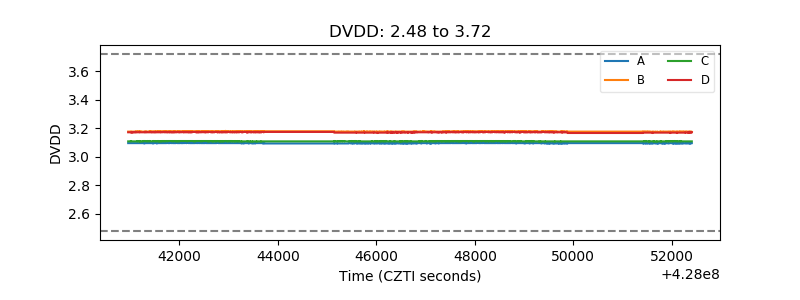 |
| Temperature 1 | 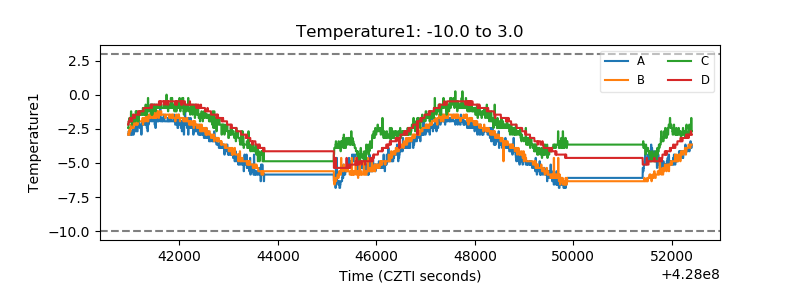 |
| Veto HV Monitor | 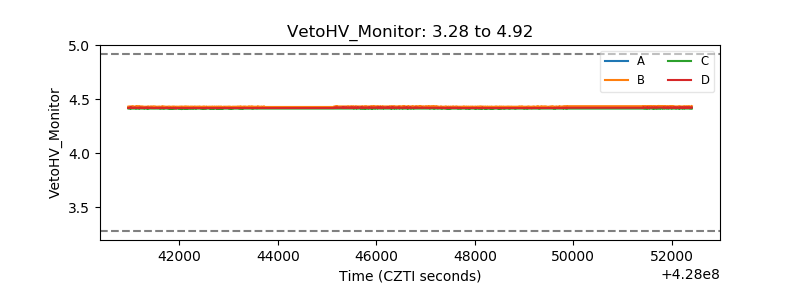 |
| Veto LLD | 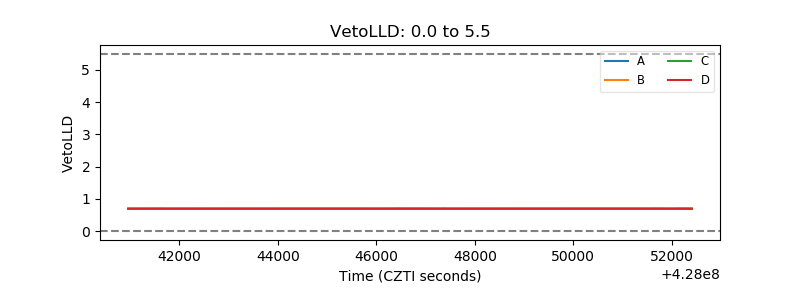 |
| Alpha Counter | 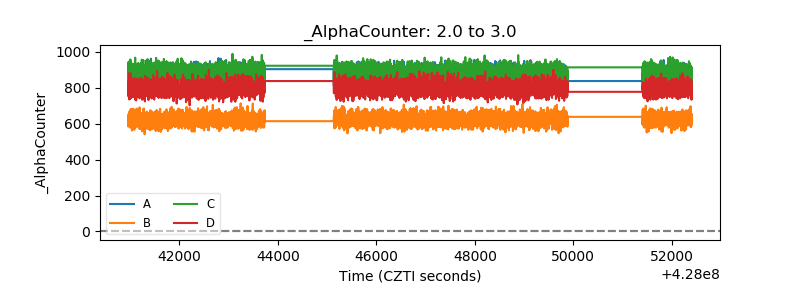 |
| _CPM_Rate | 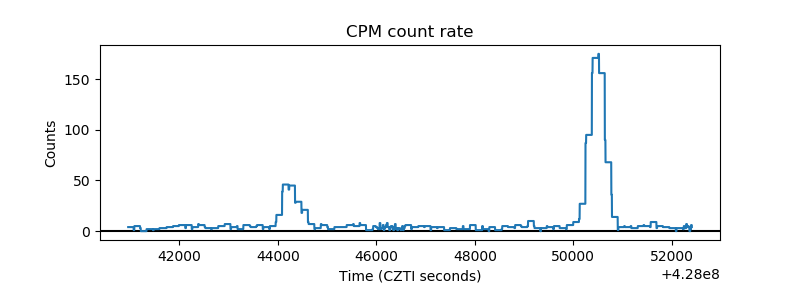 |
| CZT Counter | 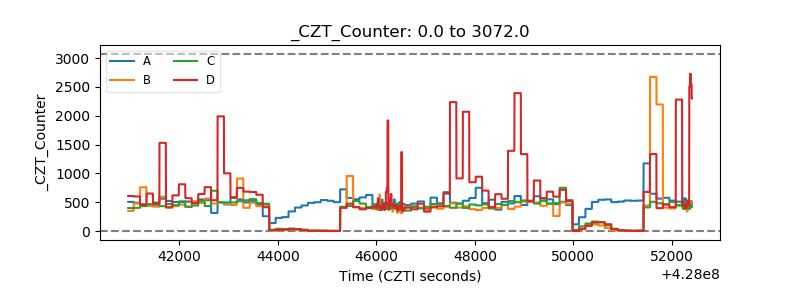 |
| +2.5 Volts monitor | 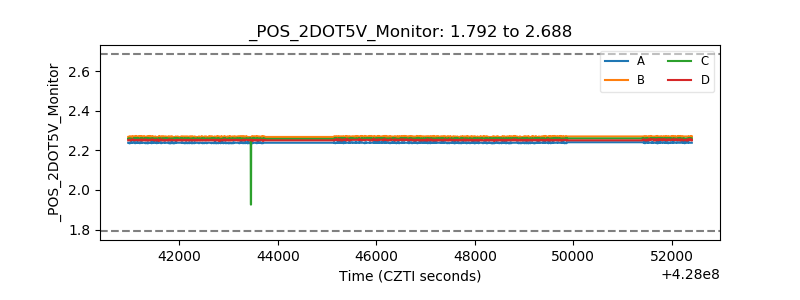 |
| +5 Volts monitor |  |
| _ROLL_ROT | 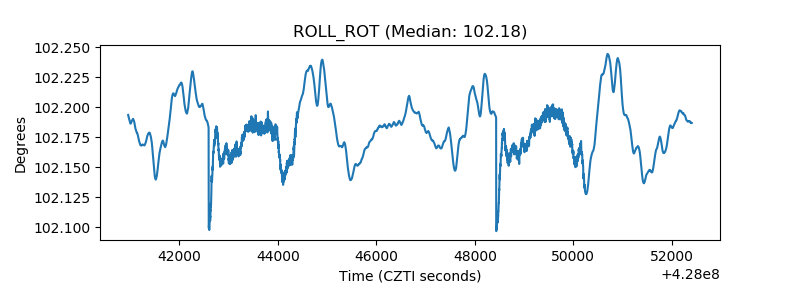 |
| _Roll_DEC | 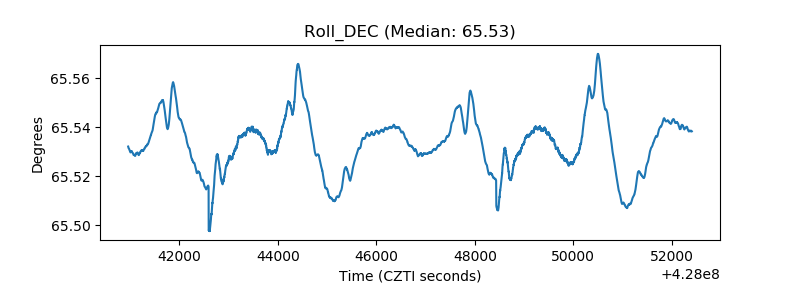 |
| _Roll_RA | 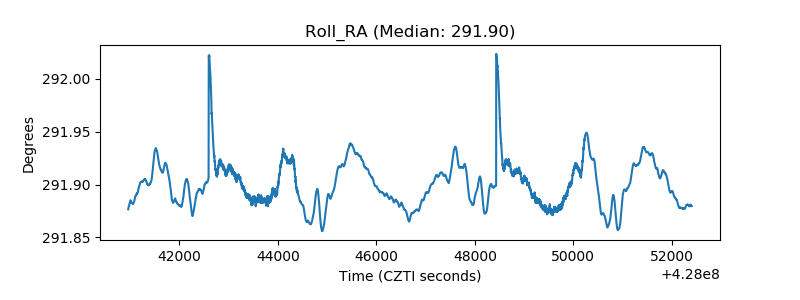 |
| Veto Counter | 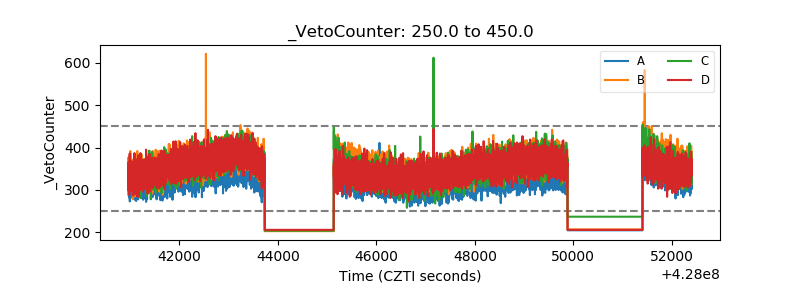 |