| Param | Original file | Final file |
|---|---|---|
| Filename | modeM0/AS1P01_999T99_9000005772_42319cztM0_level2.fits | modeM0/AS1P01_999T99_9000005772_42319cztM0_level2_quad_clean.evt |
| Size (bytes) | 330,292,800 | 91,105,920 |
| Size | 315.0 MB | 86.9 MB |
| Events in quadrant A | 3,622,833 | 599,818 |
| Events in quadrant B | 2,503,089 | 613,482 |
| Events in quadrant C | 2,576,995 | 599,179 |
| Events in quadrant D | 3,087,215 | 554,113 |
| Mode M0 | |||
|---|---|---|---|
| Quadrant | BADHDUFLAG | Total packets | Discarded packets |
| A | 0 | 14436 | 2 |
| B | 0 | 11642 | 3 |
| C | 0 | 11447 | 2 |
| D | 0 | 13293 | 2 |
| Mode SS | |||
|---|---|---|---|
| Quadrant | BADHDUFLAG | Total packets | Discarded packets |
| A | 0 | 116 | 0 |
| B | 0 | 116 | 0 |
| C | 0 | 116 | 0 |
| D | 0 | 116 | 0 |
| Mode M9 | |||
|---|---|---|---|
| Quadrant | BADHDUFLAG | Total packets | Discarded packets |
| A | 0 | 26 | 0 |
| B | 0 | 27 | 0 |
| C | 0 | 27 | 0 |
| D | 0 | 27 | 0 |
| Quadrant | Total seconds | Saturated seconds | Saturation percentage |
|---|---|---|---|
| A | 5600 | 73 | 1.303571% |
| B | 5599 | 32 | 0.571531% |
| C | 5599 | 22 | 0.392927% |
| D | 5599 | 112 | 2.000357% |
Noise dominated data is calculated using 1-second bins in cleaned event files. If a bin has >2000 counts, and if more than 50% of those come from <1% of pixels, then it is considered to be noise-dominated and hence unusable.
| Quadrant | # 1 sec bins | Bins with >0 counts | Bins with >2000 counts | High rate bins dominated by noise | Noise dominated (total time) | Noise dominated (detector-on time) | Marked lightcurve |
|---|---|---|---|---|---|---|---|
| A | 7061 | 5601 | 44 | 44 | 0.62% | 0.79% | 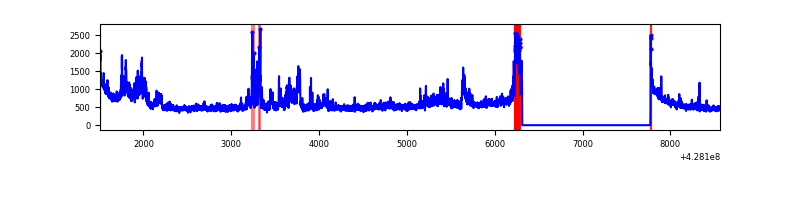 |
| B | 7060 | 5600 | 16 | 16 | 0.23% | 0.29% | 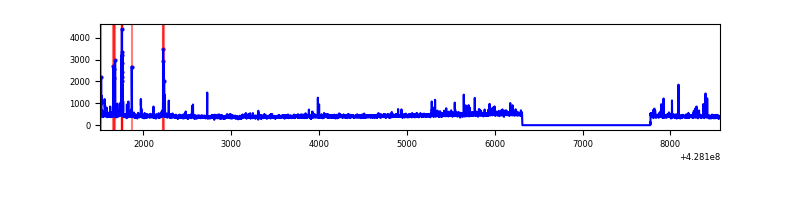 |
| C | 7060 | 5600 | 19 | 19 | 0.27% | 0.34% | 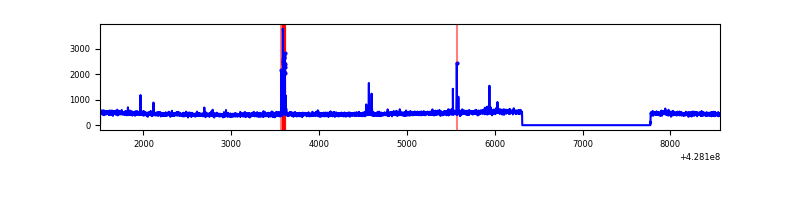 |
| D | 7060 | 5600 | 96 | 96 | 1.36% | 1.71% | 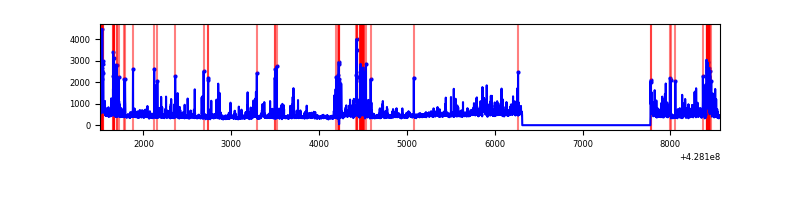 |
Top three noisy pixels from each quadrant. If the there are fewer than three noisy pixels in the level2.evt file, extra rows are filled as -1
| Pixel properties | Quadrant properties | ||||||
|---|---|---|---|---|---|---|---|
| Quadrant | DetID | PixID | Counts | Sigma | Mean | Median | Sigma |
| A | 15 | 223 | 754584 | 6274.87 | 589 | 577 | 120.2 |
| A | 10 | 83 | 568401 | 4725.45 | 589 | 577 | 120.2 |
| A | 13 | 248 | 11416 | 90.2 | 589 | 577 | 120.2 |
| B | 3 | 112 | 90608 | 799.4 | 586 | 570 | 112.6 |
| B | 15 | 35 | 29855 | 260.0 | 586 | 570 | 112.6 |
| B | 0 | 245 | 26798 | 232.86 | 586 | 570 | 112.6 |
| C | 15 | 214 | 235111 | 1741.76 | 580 | 584 | 134.6 |
| C | 9 | 54 | 55494 | 407.8 | 580 | 584 | 134.6 |
| C | 12 | 249 | 13647 | 97.01 | 580 | 584 | 134.6 |
| D | 1 | 52 | 216046 | 1542.42 | 575 | 558 | 139.7 |
| D | 13 | 249 | 170108 | 1213.6 | 575 | 558 | 139.7 |
| D | 12 | 6 | 168638 | 1203.08 | 575 | 558 | 139.7 |
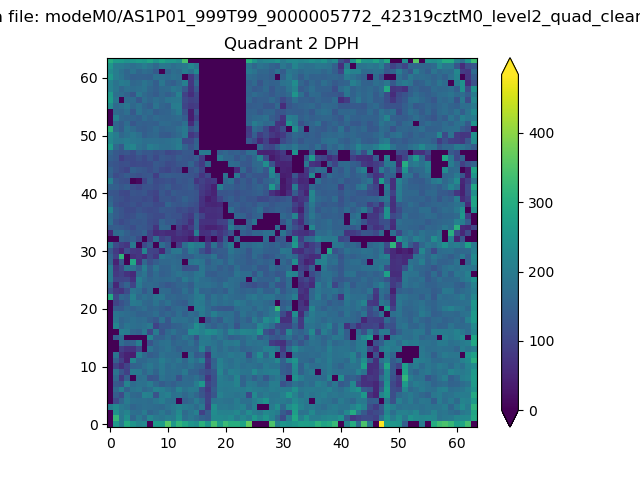
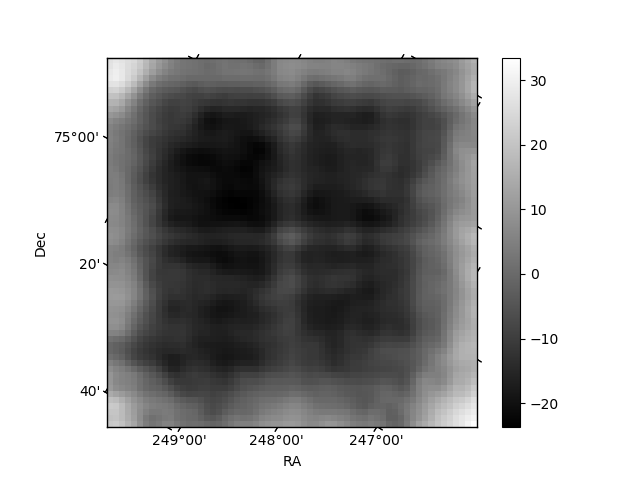
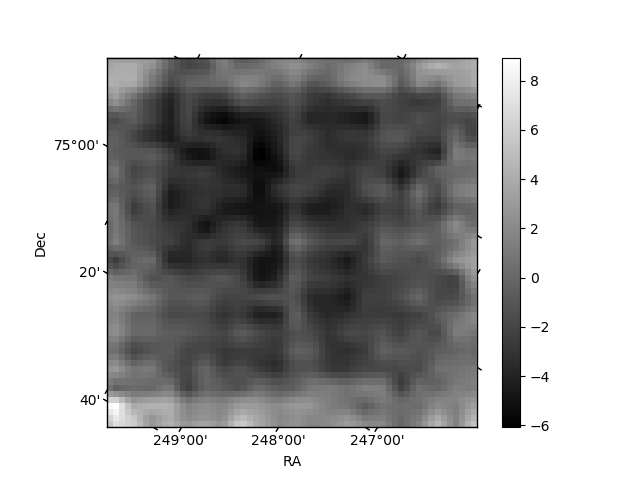
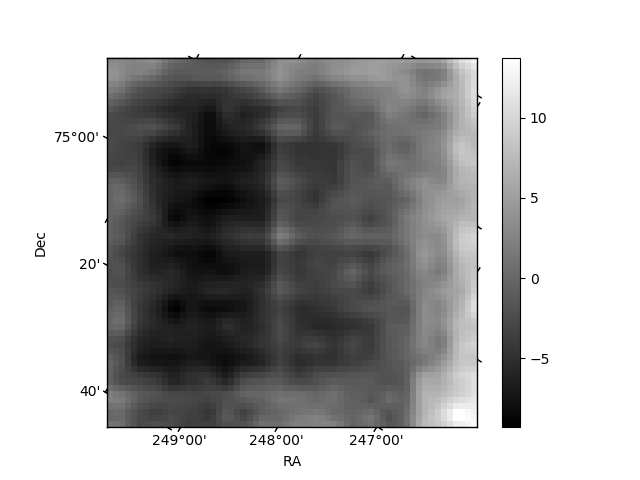
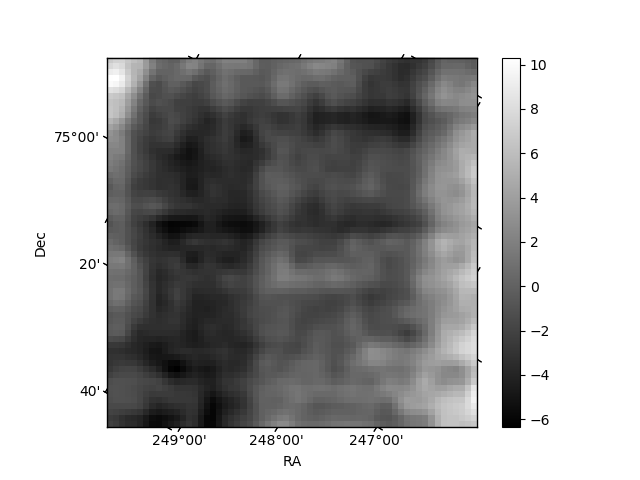
Histogram calculated using DETX and DETY for each event in the final _common_clean file
| Quadrant A | 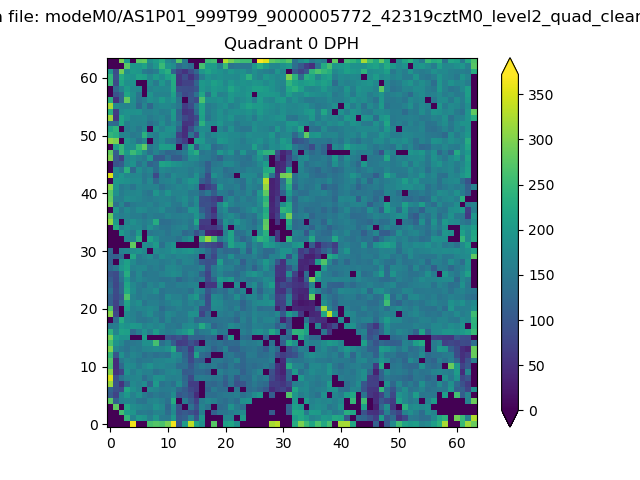 |
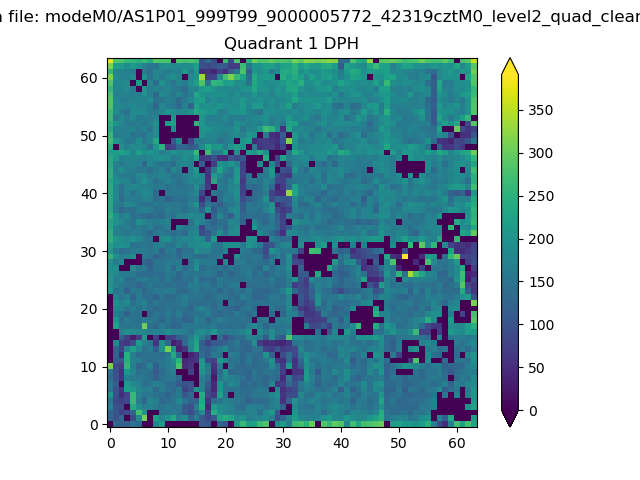 |
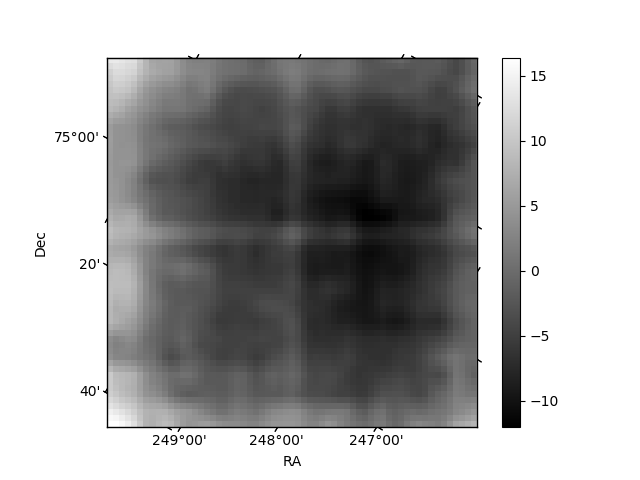
Quadrant B |
|---|---|---|---|
| Quadrant D | 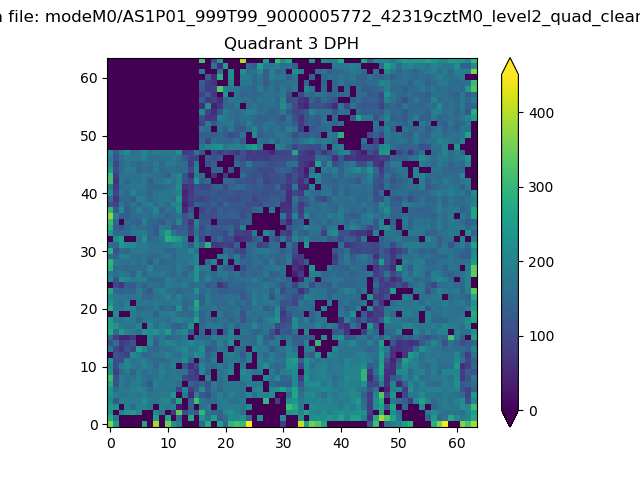 |
 |
Quadrant C |
| Plot type | Count rate plots | Images |
|---|---|---|
| Comparison with Poisson distribution Blue bars denote a histogram of data divided into 1 sec bins. Red curve is a Poisson curve with rate = median count rate of data. |
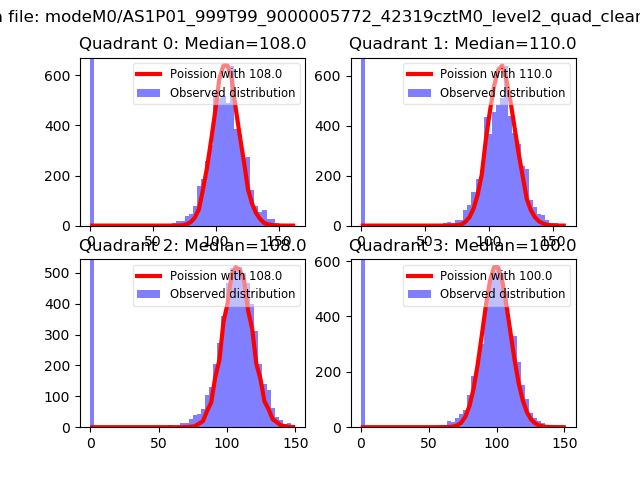 |
 |
| Quadrant-wise count rates Data is divided into 100 sec bins |
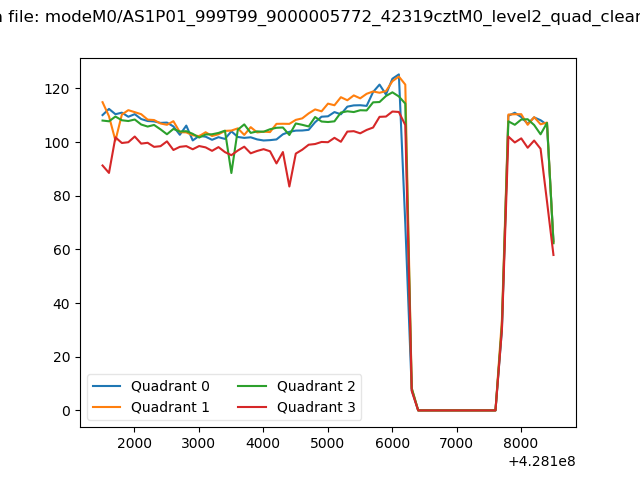 |
|
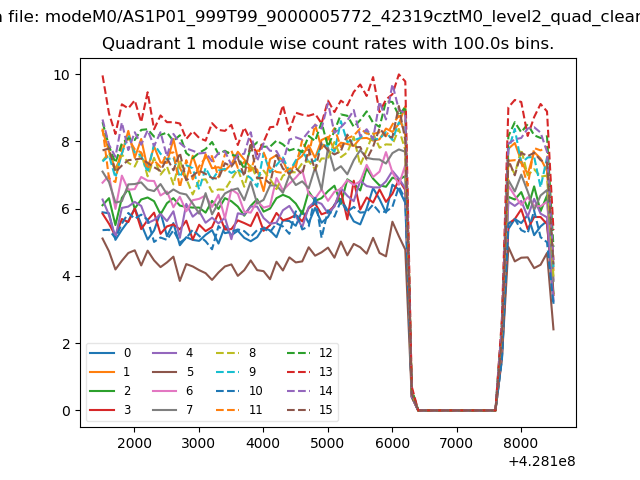
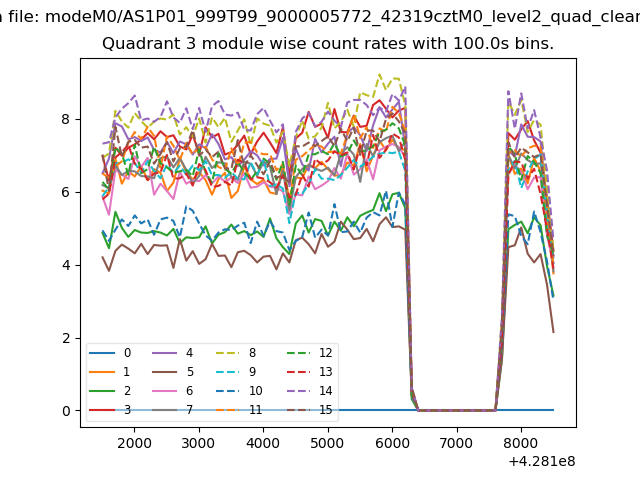
| Module-wise count rates for Quadrant A Data is divided into 100 sec bins |
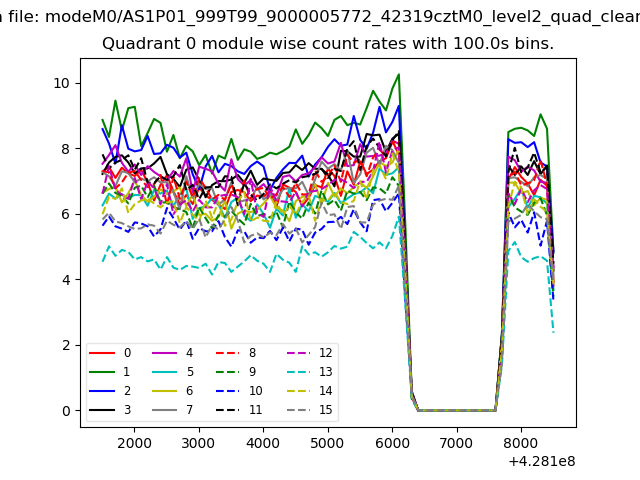 |
 |
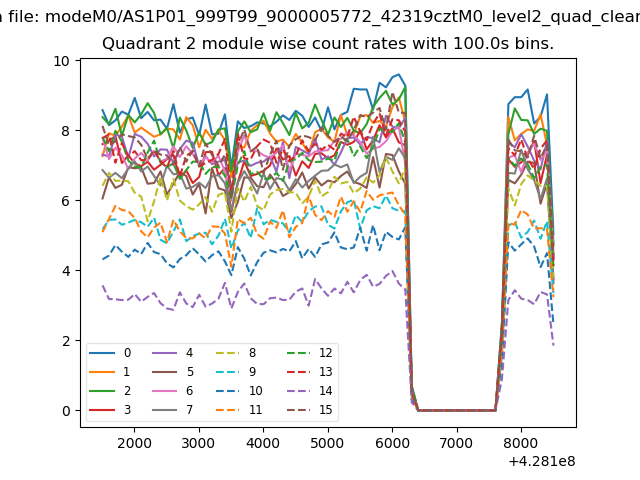
| Module-wise count rates for Quadrant B Data is divided into 100 sec bins |
 |
 |
| Module-wise count rates for Quadrant C Data is divided into 100 sec bins |
 |
 |
| Module-wise count rates for Quadrant D Data is divided into 100 sec bins |
 |
 |
| Parameter | Plot |
|---|---|
| CZT HV Monitor | 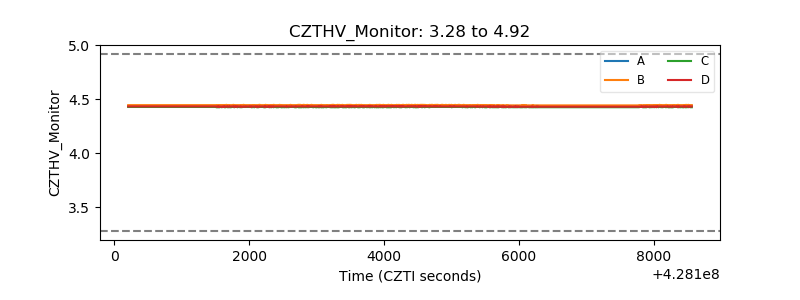 |
| D_VDD | 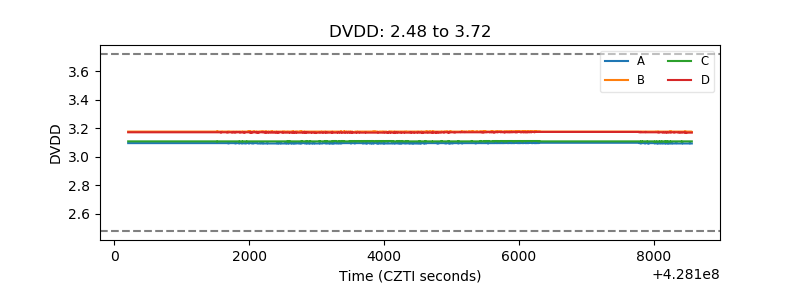 |
| Temperature 1 | 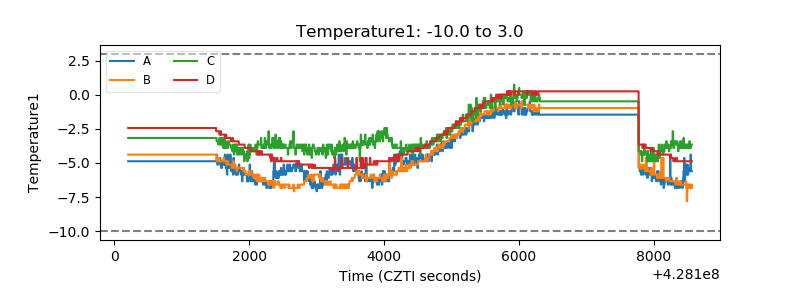 |
| Veto HV Monitor | 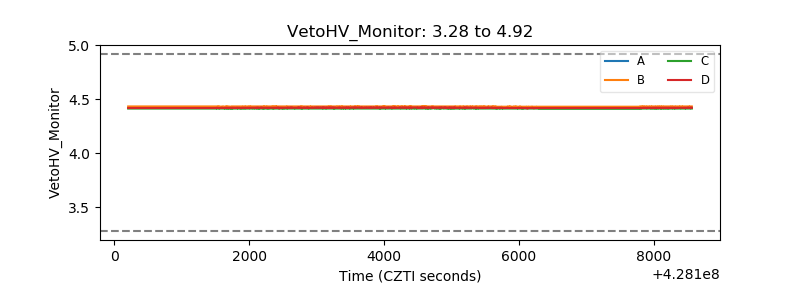 |
| Veto LLD | 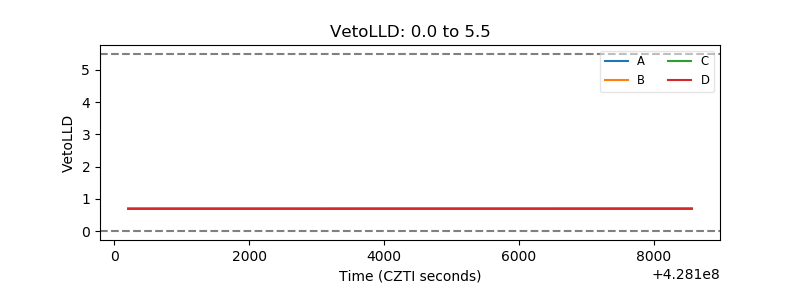 |
| Alpha Counter | 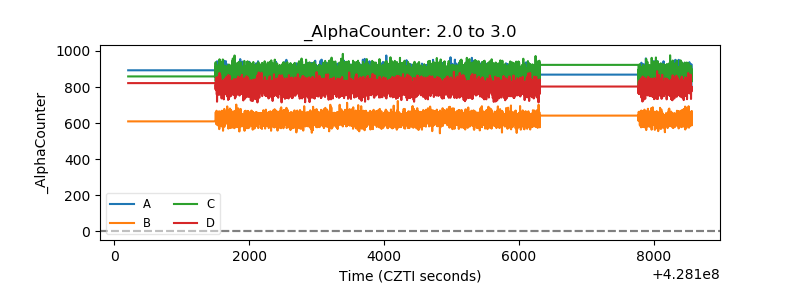 |
| _CPM_Rate | 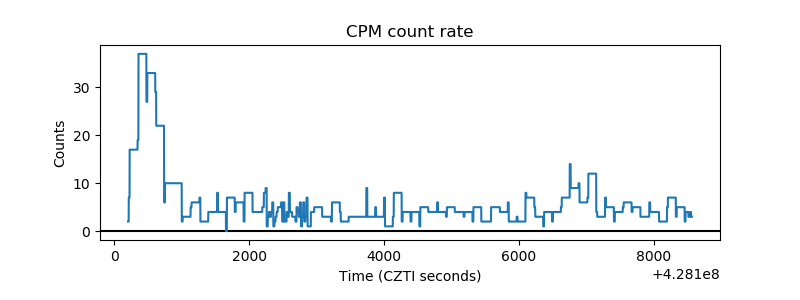 |
| CZT Counter | 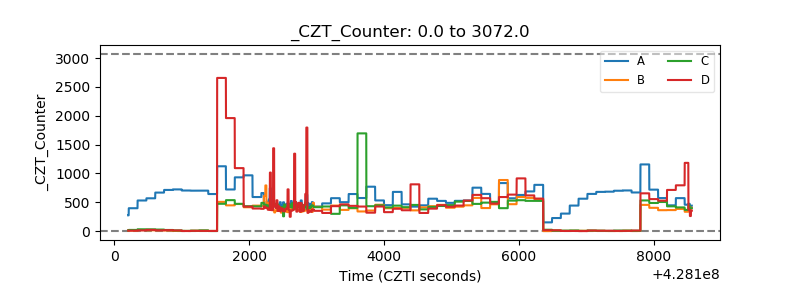 |
| +2.5 Volts monitor |  |
| +5 Volts monitor |  |
| _ROLL_ROT |  |
| _Roll_DEC | 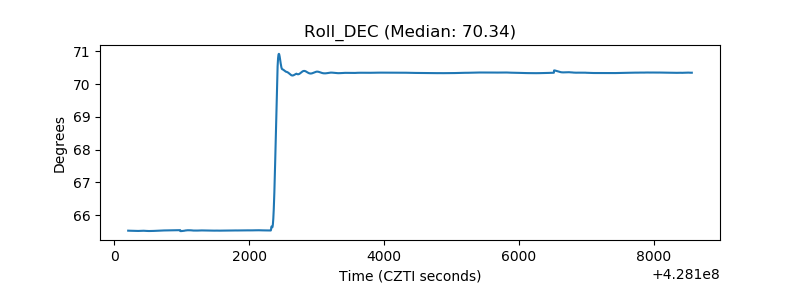 |
| _Roll_RA | 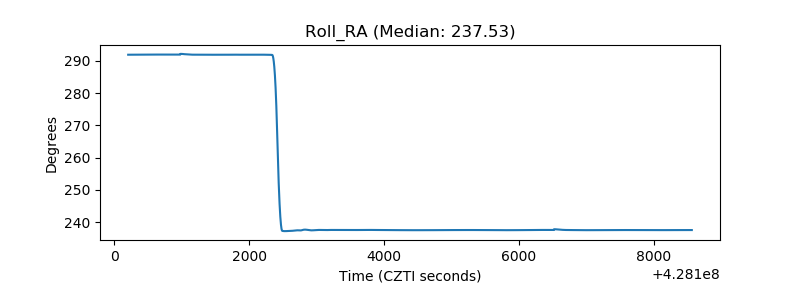 |
| Veto Counter | 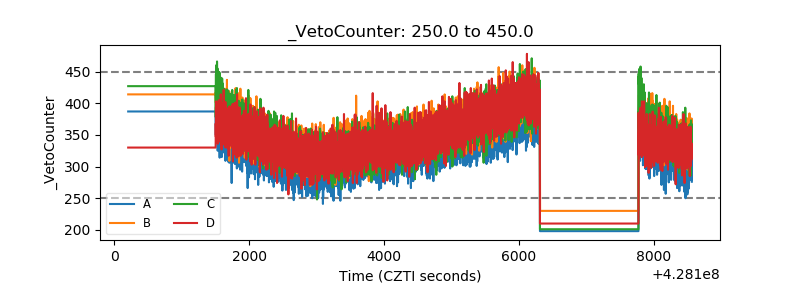 |