| Param | Original file | Final file |
|---|---|---|
| Filename | modeM0/AS1P01_999T99_9000005772_42320cztM0_level2.fits | modeM0/AS1P01_999T99_9000005772_42320cztM0_level2_quad_clean.evt |
| Size (bytes) | 268,856,640 | 74,799,360 |
| Size | 256.4 MB | 71.3 MB |
| Events in quadrant A | 2,734,878 | 490,340 |
| Events in quadrant B | 2,124,346 | 502,437 |
| Events in quadrant C | 2,204,125 | 493,635 |
| Events in quadrant D | 2,527,651 | 453,402 |
| Mode M0 | |||
|---|---|---|---|
| Quadrant | BADHDUFLAG | Total packets | Discarded packets |
| A | 0 | 11154 | 1 |
| B | 0 | 9766 | 1 |
| C | 0 | 9641 | 1 |
| D | 0 | 10989 | 1 |
| Mode SS | |||
|---|---|---|---|
| Quadrant | BADHDUFLAG | Total packets | Discarded packets |
| A | 0 | 94 | 0 |
| B | 0 | 94 | 0 |
| C | 0 | 94 | 0 |
| D | 0 | 94 | 0 |
| Mode M9 | |||
|---|---|---|---|
| Quadrant | BADHDUFLAG | Total packets | Discarded packets |
| A | 0 | 14 | 0 |
| B | 0 | 14 | 0 |
| C | 0 | 14 | 0 |
| D | 0 | 14 | 0 |
| Quadrant | Total seconds | Saturated seconds | Saturation percentage |
|---|---|---|---|
| A | 4627 | 65 | 1.404798% |
| B | 4627 | 28 | 0.605144% |
| C | 4627 | 2 | 0.043225% |
| D | 4628 | 85 | 1.836646% |
Noise dominated data is calculated using 1-second bins in cleaned event files. If a bin has >2000 counts, and if more than 50% of those come from <1% of pixels, then it is considered to be noise-dominated and hence unusable.
| Quadrant | # 1 sec bins | Bins with >0 counts | Bins with >2000 counts | High rate bins dominated by noise | Noise dominated (total time) | Noise dominated (detector-on time) | Marked lightcurve |
|---|---|---|---|---|---|---|---|
| A | 6088 | 4628 | 40 | 40 | 0.66% | 0.86% | 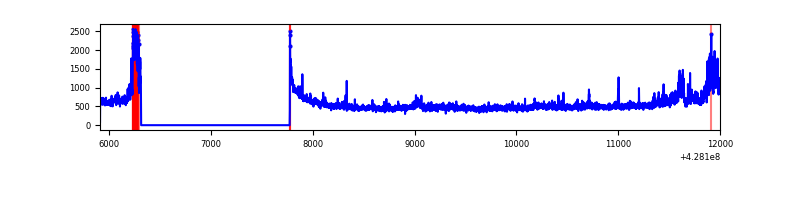 |
| B | 6088 | 4628 | 15 | 15 | 0.25% | 0.32% | 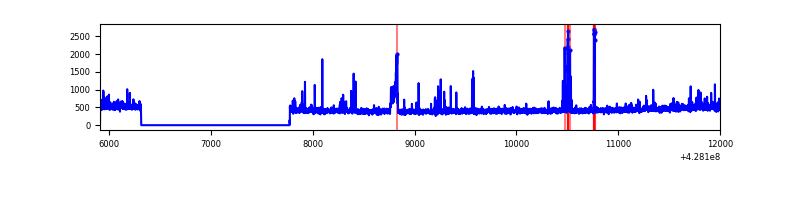 |
| C | 6088 | 4628 | 1 | 1 | 0.02% | 0.02% | 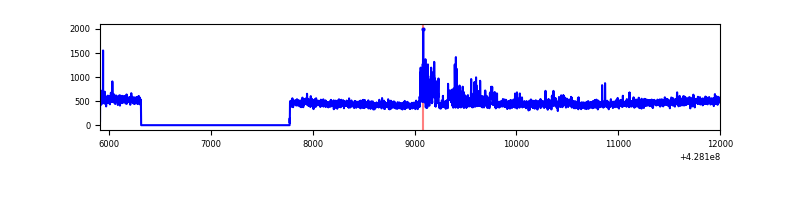 |
| D | 6089 | 4629 | 73 | 73 | 1.20% | 1.58% | 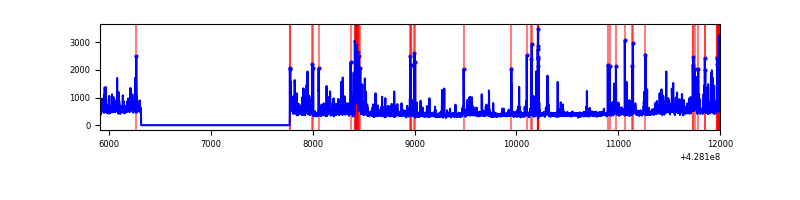 |
Top three noisy pixels from each quadrant. If the there are fewer than three noisy pixels in the level2.evt file, extra rows are filled as -1
| Pixel properties | Quadrant properties | ||||||
|---|---|---|---|---|---|---|---|
| Quadrant | DetID | PixID | Counts | Sigma | Mean | Median | Sigma |
| A | 15 | 223 | 411244 | 4027.71 | 489 | 477 | 102.0 |
| A | 10 | 83 | 404740 | 3963.94 | 489 | 477 | 102.0 |
| A | 13 | 248 | 15861 | 150.85 | 489 | 477 | 102.0 |
| B | 5 | 255 | 73260 | 768.54 | 486 | 472 | 94.7 |
| B | 5 | 172 | 73199 | 767.89 | 486 | 472 | 94.7 |
| B | 3 | 112 | 33351 | 347.16 | 486 | 472 | 94.7 |
| C | 15 | 214 | 190030 | 1681.71 | 479 | 481 | 112.7 |
| C | 9 | 54 | 139892 | 1236.88 | 479 | 481 | 112.7 |
| C | 12 | 249 | 6210 | 50.83 | 479 | 481 | 112.7 |
| D | 1 | 52 | 233406 | 1992.37 | 477 | 462 | 116.9 |
| D | 5 | 70 | 133187 | 1135.2 | 477 | 462 | 116.9 |
| D | 12 | 6 | 95984 | 817.0 | 477 | 462 | 116.9 |
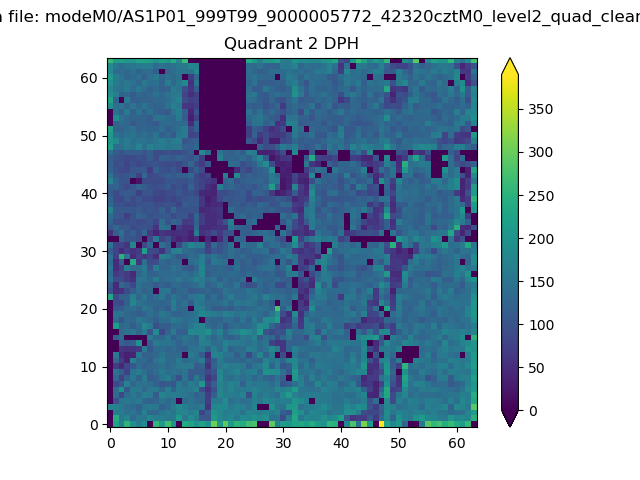
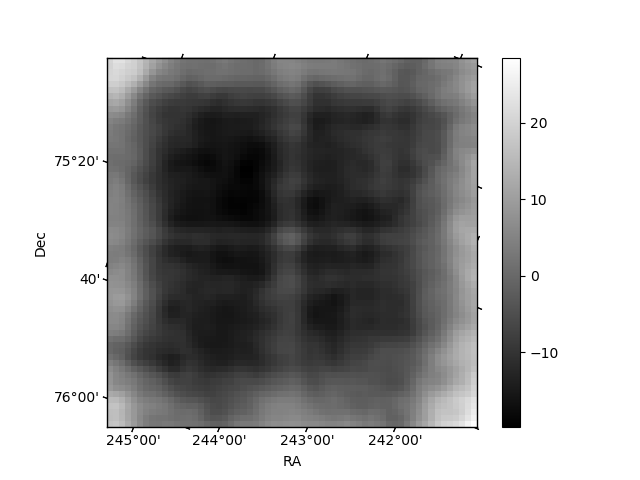
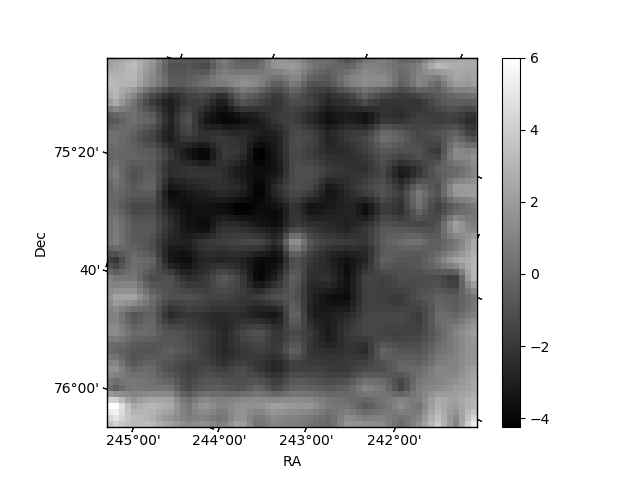
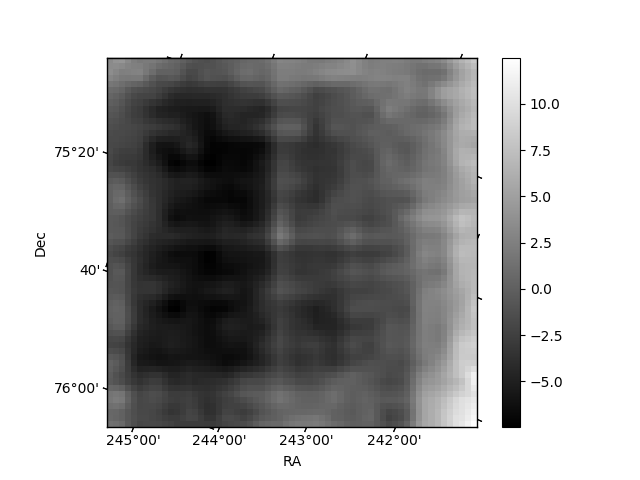
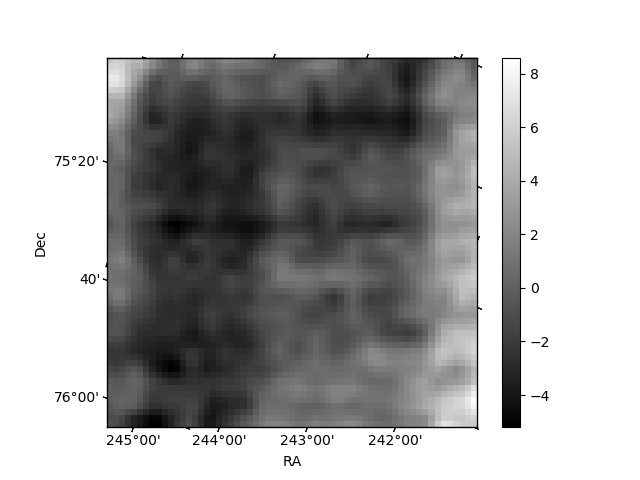
Histogram calculated using DETX and DETY for each event in the final _common_clean file
| Quadrant A | 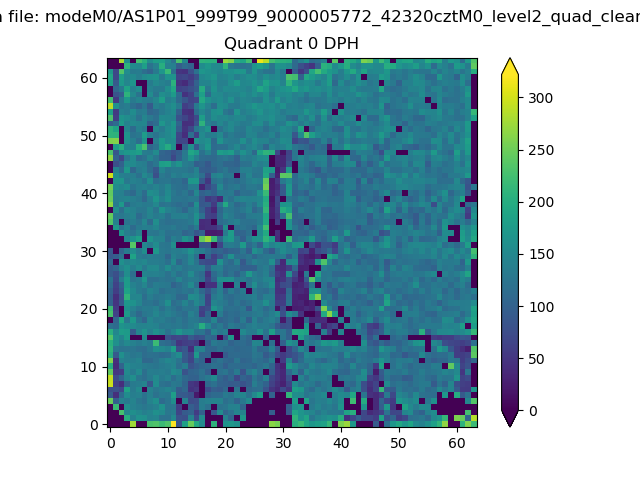 |
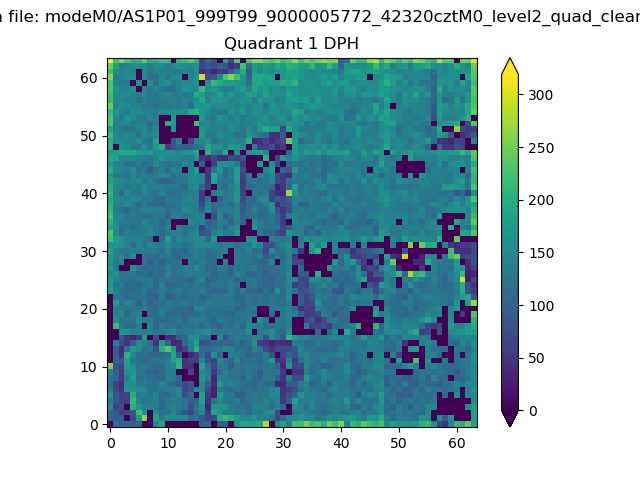 |
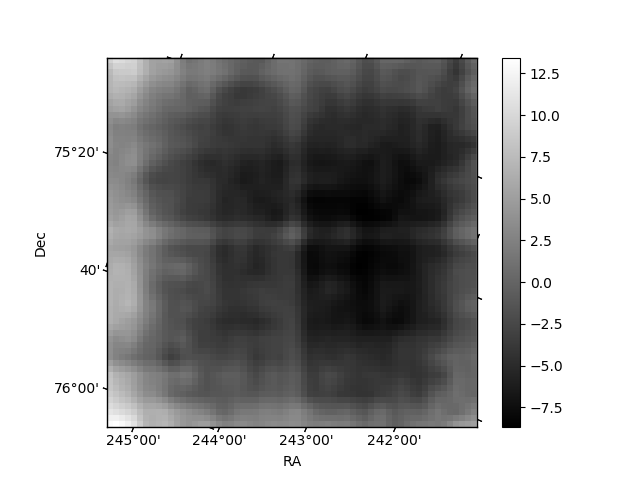
Quadrant B |
|---|---|---|---|
| Quadrant D | 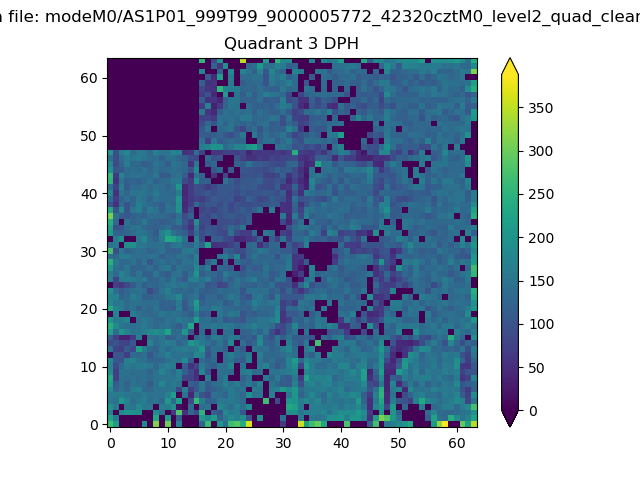 |
 |
Quadrant C |
| Plot type | Count rate plots | Images |
|---|---|---|
| Comparison with Poisson distribution Blue bars denote a histogram of data divided into 1 sec bins. Red curve is a Poisson curve with rate = median count rate of data. |
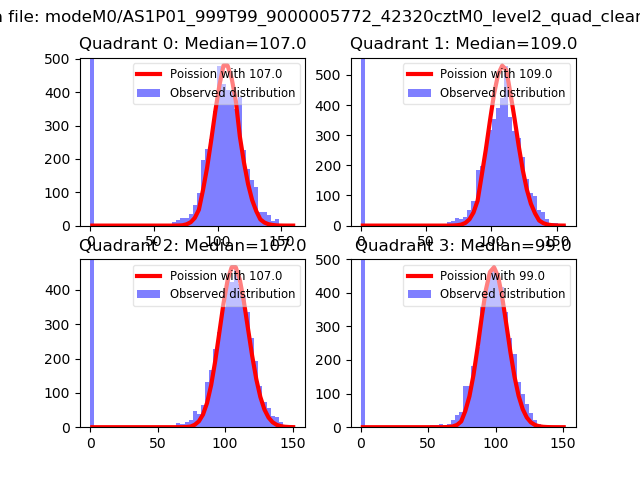 |
 |
| Quadrant-wise count rates Data is divided into 100 sec bins |
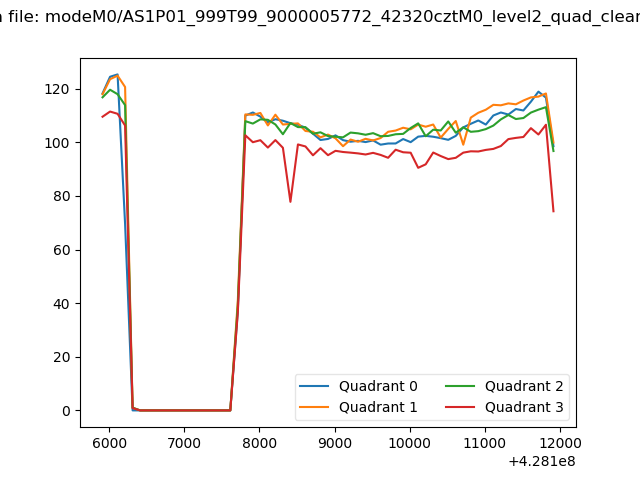 |
|
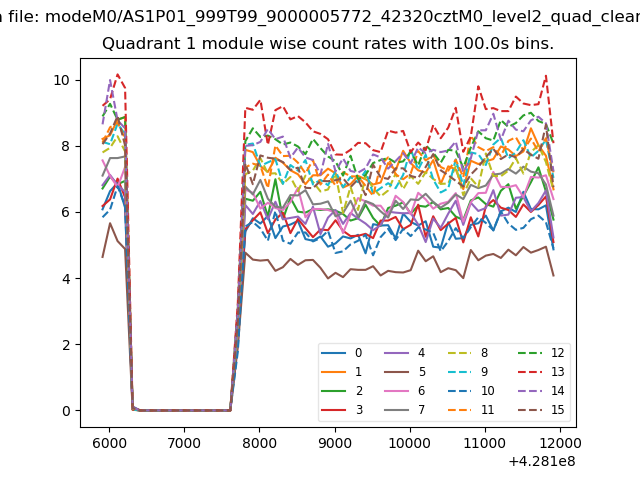
| Module-wise count rates for Quadrant A Data is divided into 100 sec bins |
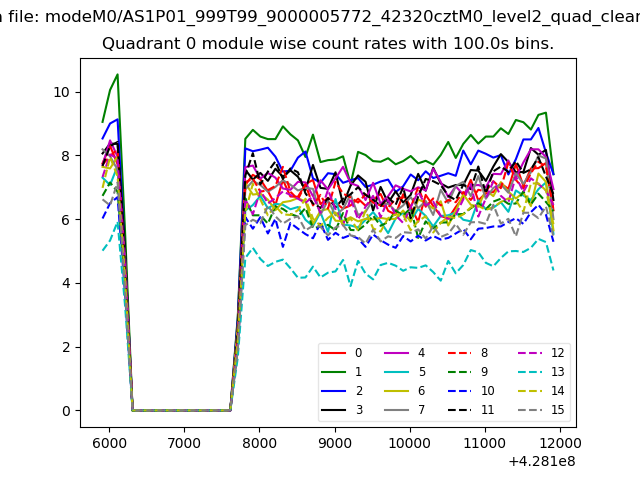 |
 |
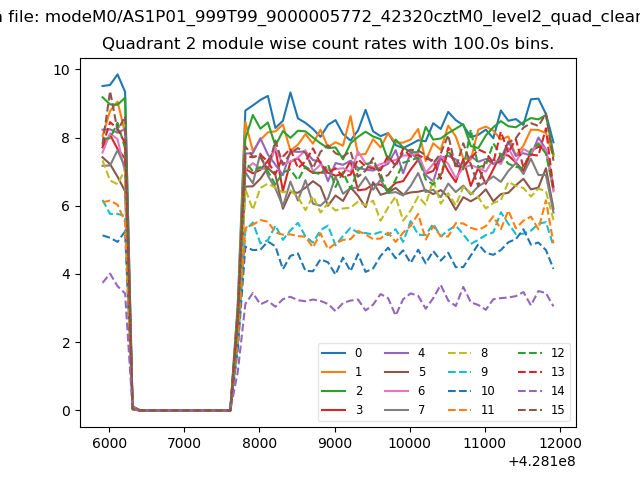
| Module-wise count rates for Quadrant B Data is divided into 100 sec bins |
 |
 |
| Module-wise count rates for Quadrant C Data is divided into 100 sec bins |
 |
 |
| Module-wise count rates for Quadrant D Data is divided into 100 sec bins |
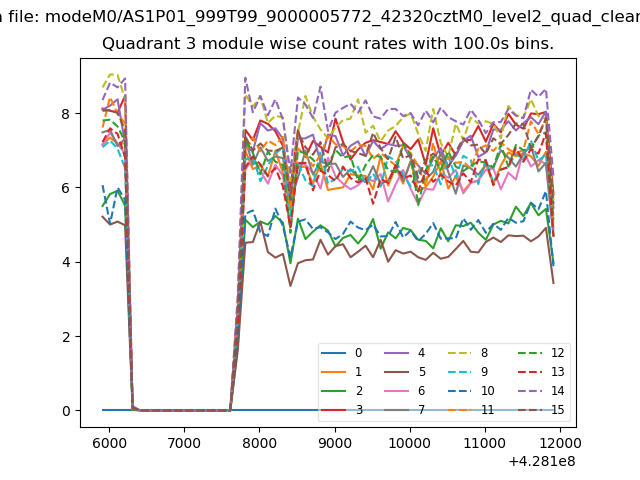 |
 |
| Parameter | Plot |
|---|---|
| CZT HV Monitor | 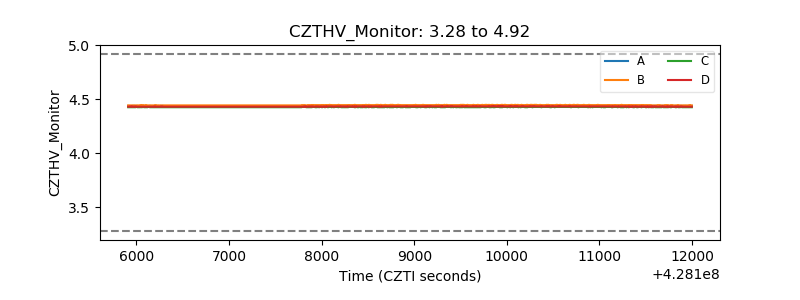 |
| D_VDD | 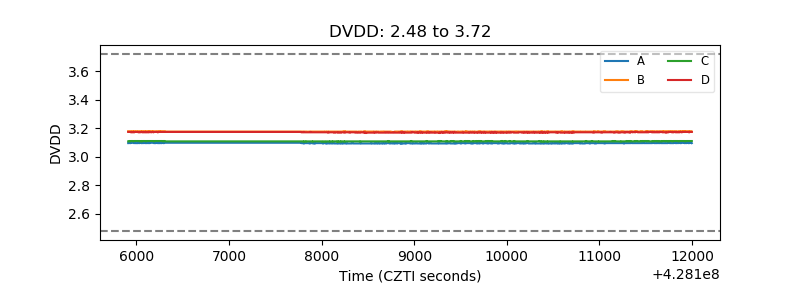 |
| Temperature 1 | 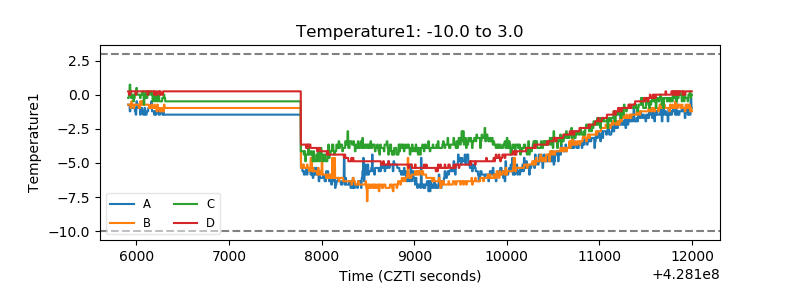 |
| Veto HV Monitor | 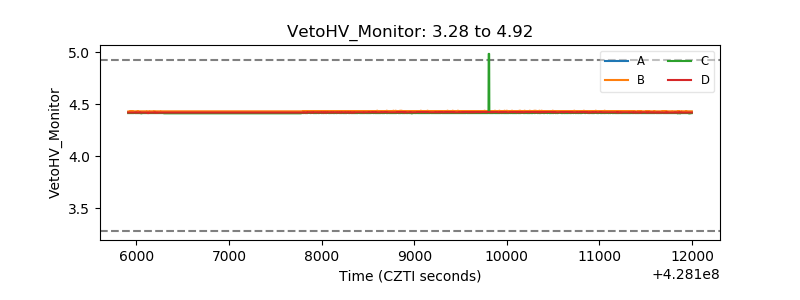 |
| Veto LLD | 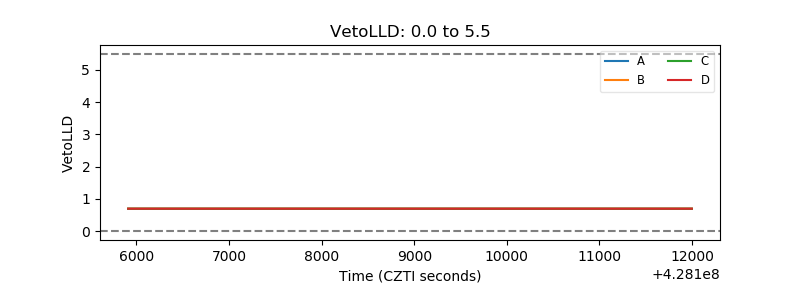 |
| Alpha Counter | 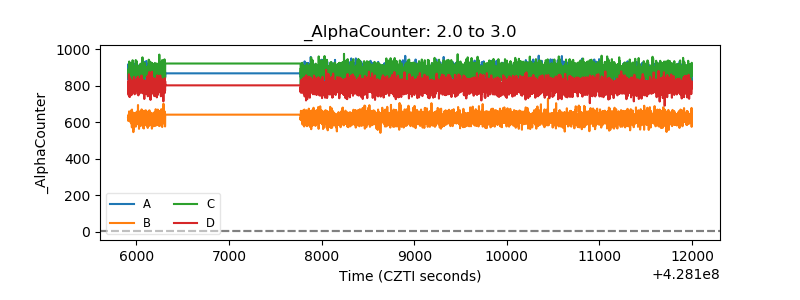 |
| _CPM_Rate |  |
| CZT Counter | 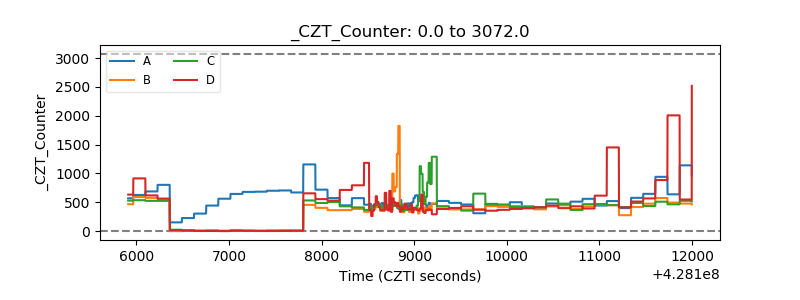 |
| +2.5 Volts monitor | 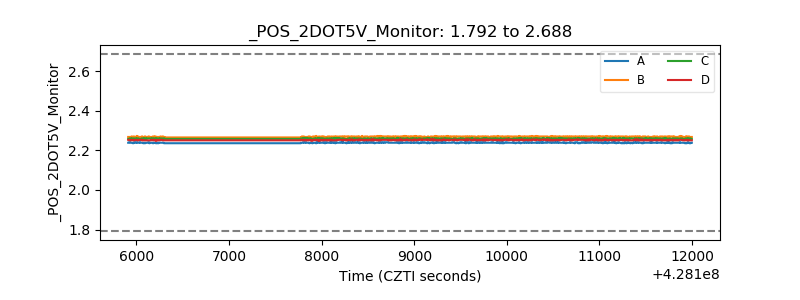 |
| +5 Volts monitor |  |
| _ROLL_ROT | 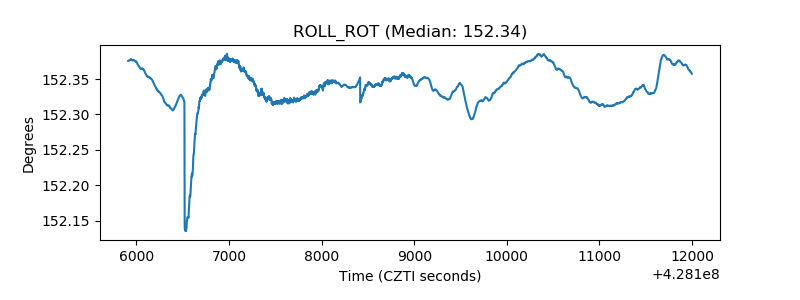 |
| _Roll_DEC | 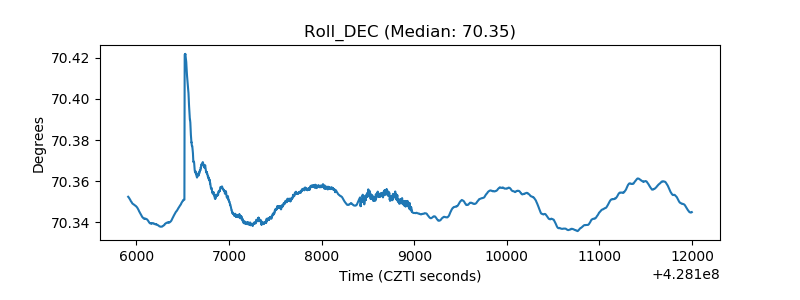 |
| _Roll_RA | 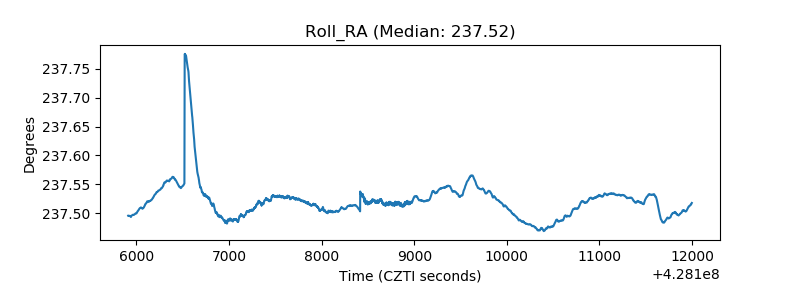 |
| Veto Counter | 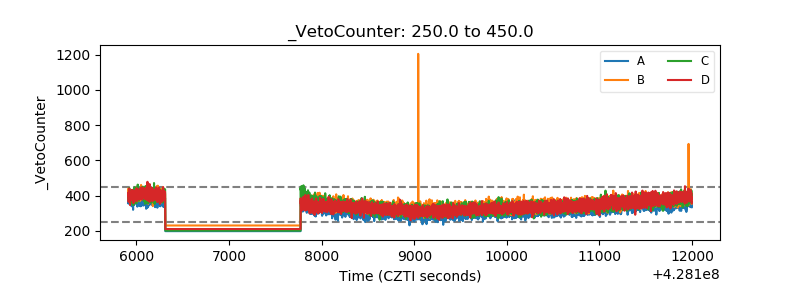 |