| Param | Original file | Final file |
|---|---|---|
| Filename | modeM0/AS1A12_088T24_9000005768_42184cztM0_level2.fits | modeM0/AS1A12_088T24_9000005768_42184cztM0_level2_quad_clean.evt |
| Size (bytes) | 183,096,000 | 51,315,840 |
| Size | 174.6 MB | 48.9 MB |
| Events in quadrant A | 1,727,899 | 346,918 |
| Events in quadrant B | 1,400,165 | 360,042 |
| Events in quadrant C | 1,671,178 | 330,824 |
| Events in quadrant D | 1,749,294 | 308,127 |
| Mode M0 | |||
|---|---|---|---|
| Quadrant | BADHDUFLAG | Total packets | Discarded packets |
| A | 0 | 6887 | 1 |
| B | 0 | 6047 | 1 |
| C | 0 | 6756 | 1 |
| D | 0 | 7236 | 1 |
| Mode M9 | |||
|---|---|---|---|
| Quadrant | BADHDUFLAG | Total packets | Discarded packets |
| A | 0 | 21 | 0 |
| B | 0 | 21 | 0 |
| C | 0 | 21 | 0 |
| D | 0 | 21 | 0 |
| Mode SS | |||
|---|---|---|---|
| Quadrant | BADHDUFLAG | Total packets | Discarded packets |
| A | 0 | 60 | 0 |
| B | 0 | 60 | 0 |
| C | 0 | 60 | 0 |
| D | 0 | 60 | 0 |
| Quadrant | Total seconds | Saturated seconds | Saturation percentage |
|---|---|---|---|
| A | 2919 | 20 | 0.685166% |
| B | 2919 | 9 | 0.308325% |
| C | 2919 | 64 | 2.192532% |
| D | 2919 | 40 | 1.370332% |
Noise dominated data is calculated using 1-second bins in cleaned event files. If a bin has >2000 counts, and if more than 50% of those come from <1% of pixels, then it is considered to be noise-dominated and hence unusable.
| Quadrant | # 1 sec bins | Bins with >0 counts | Bins with >2000 counts | High rate bins dominated by noise | Noise dominated (total time) | Noise dominated (detector-on time) | Marked lightcurve |
|---|---|---|---|---|---|---|---|
| A | 4982 | 2920 | 11 | 11 | 0.22% | 0.38% | 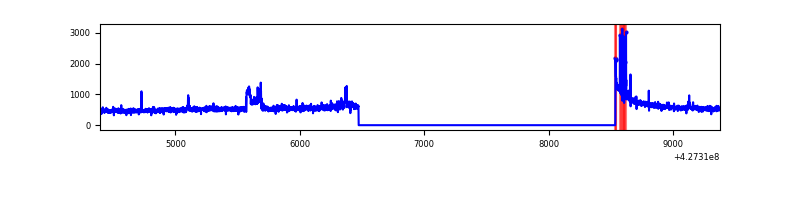 |
| B | 4982 | 2920 | 3 | 3 | 0.06% | 0.10% | 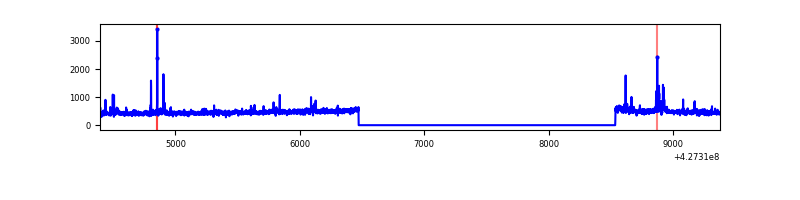 |
| C | 4982 | 2920 | 62 | 62 | 1.24% | 2.12% | 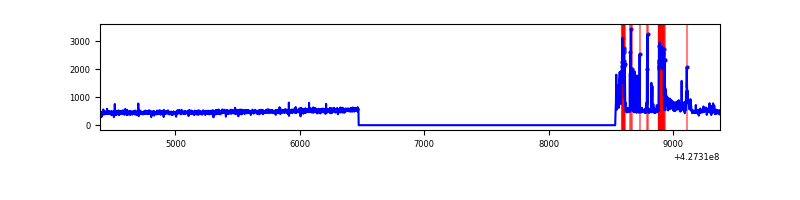 |
| D | 4982 | 2920 | 49 | 49 | 0.98% | 1.68% | 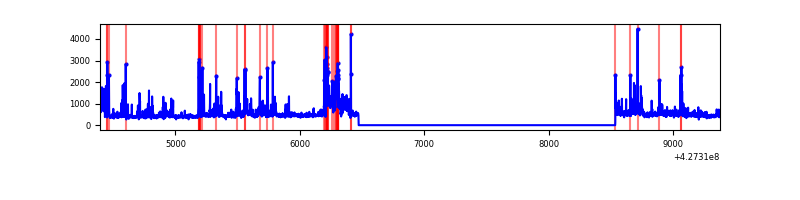 |
Top three noisy pixels from each quadrant. If the there are fewer than three noisy pixels in the level2.evt file, extra rows are filled as -1
| Pixel properties | Quadrant properties | ||||||
|---|---|---|---|---|---|---|---|
| Quadrant | DetID | PixID | Counts | Sigma | Mean | Median | Sigma |
| A | 10 | 83 | 289922 | 4152.32 | 334 | 327 | 69.7 |
| A | 15 | 223 | 113611 | 1624.31 | 334 | 327 | 69.7 |
| A | 13 | 248 | 31981 | 453.87 | 334 | 327 | 69.7 |
| B | 5 | 255 | 30822 | 462.89 | 336 | 328 | 65.9 |
| B | 0 | 229 | 28523 | 427.99 | 336 | 328 | 65.9 |
| B | 15 | 85 | 12589 | 186.12 | 336 | 328 | 65.9 |
| C | 8 | 79 | 271574 | 3514.07 | 325 | 326 | 77.2 |
| C | 15 | 214 | 120225 | 1553.32 | 325 | 326 | 77.2 |
| C | 7 | 220 | 6198 | 76.07 | 325 | 326 | 77.2 |
| D | 12 | 6 | 239394 | 2979.51 | 321 | 311 | 80.2 |
| D | 1 | 52 | 104773 | 1301.83 | 321 | 311 | 80.2 |
| D | 2 | 16 | 63772 | 790.87 | 321 | 311 | 80.2 |
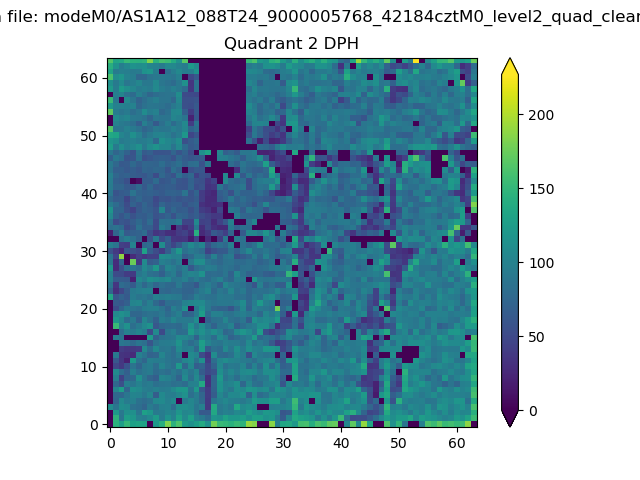
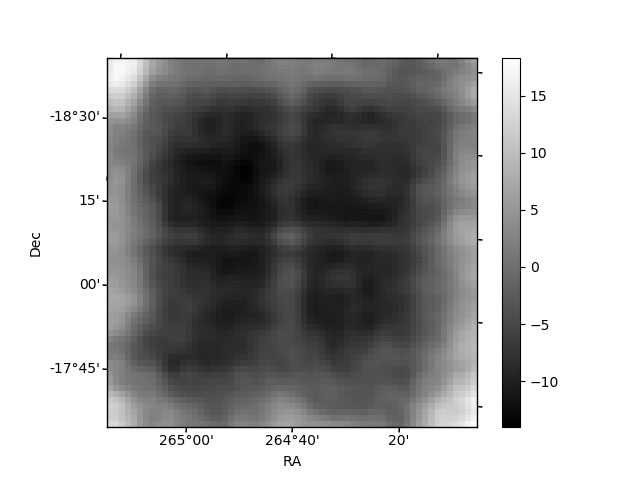
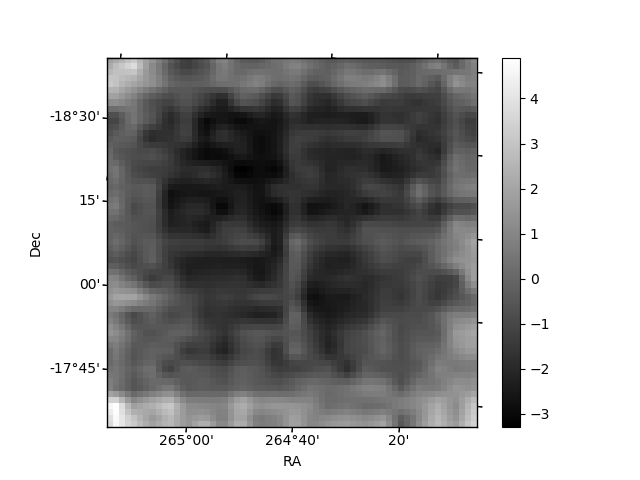
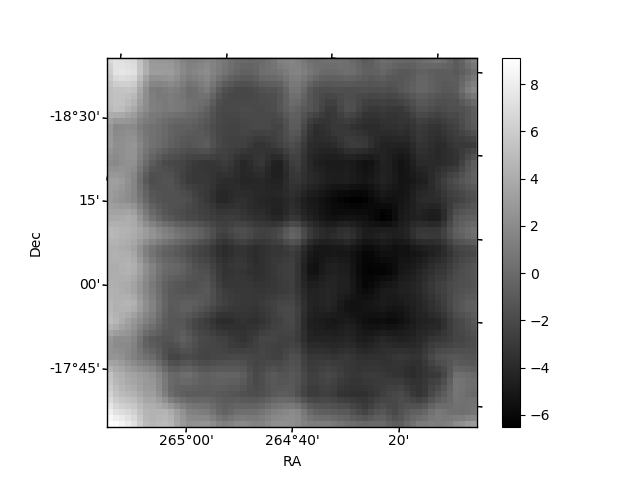
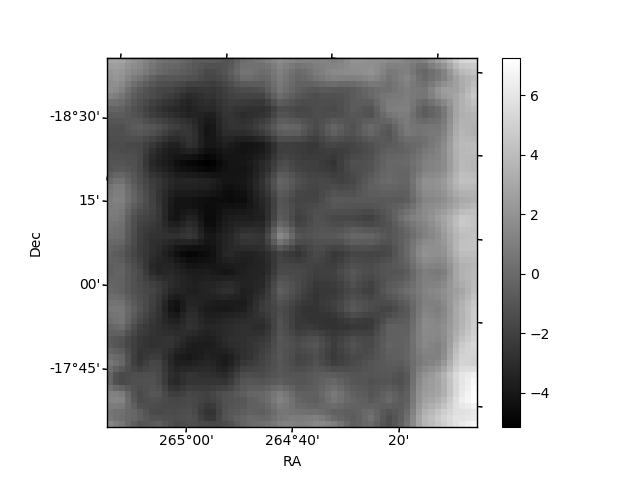
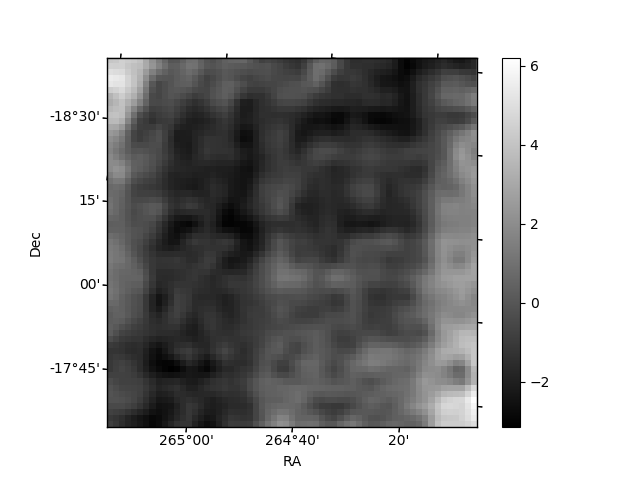
Histogram calculated using DETX and DETY for each event in the final _common_clean file
| Quadrant A | 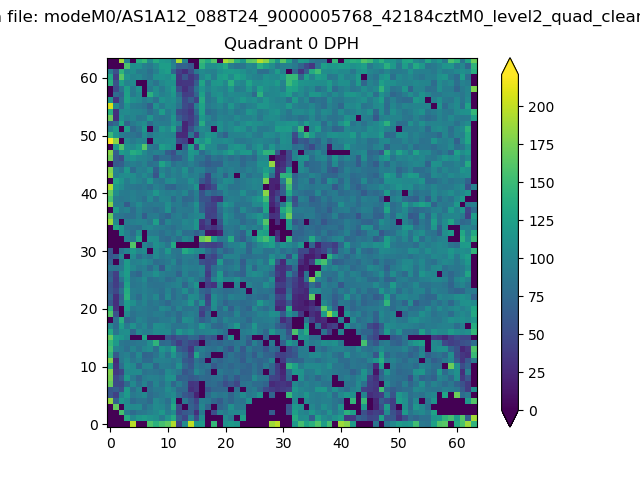 |
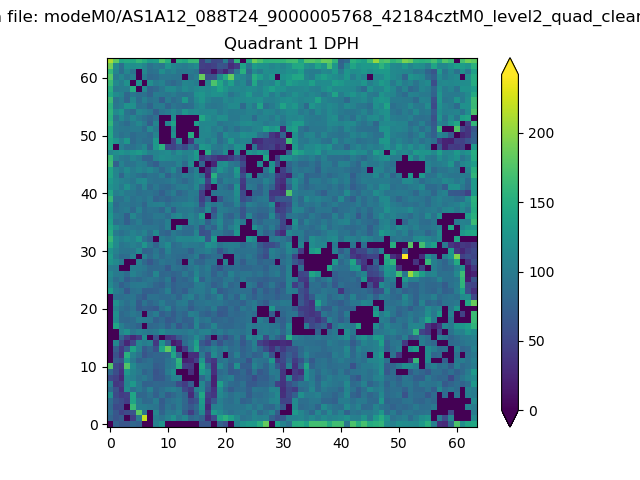 |
Quadrant B |
|---|---|---|---|
| Quadrant D | 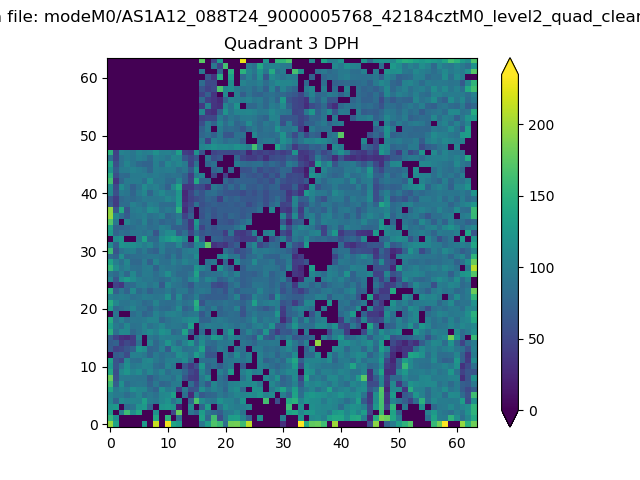 |
 |
Quadrant C |
| Plot type | Count rate plots | Images |
|---|---|---|
| Comparison with Poisson distribution Blue bars denote a histogram of data divided into 1 sec bins. Red curve is a Poisson curve with rate = median count rate of data. |
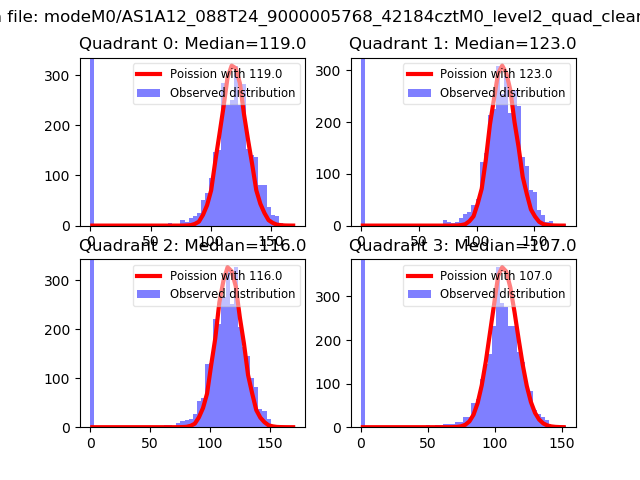 |
 |
| Quadrant-wise count rates Data is divided into 100 sec bins |
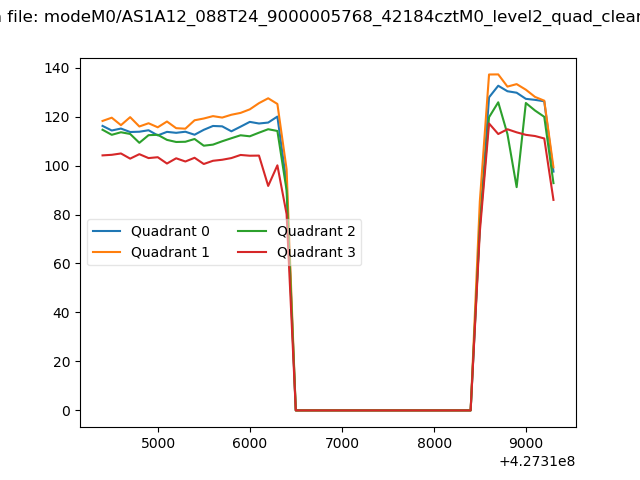 |
|
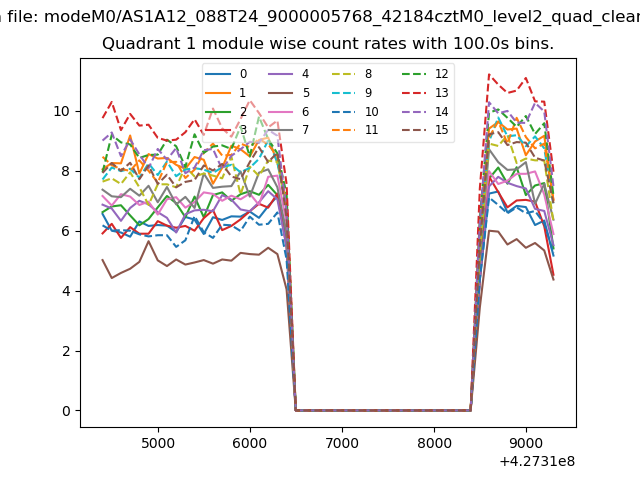
| Module-wise count rates for Quadrant A Data is divided into 100 sec bins |
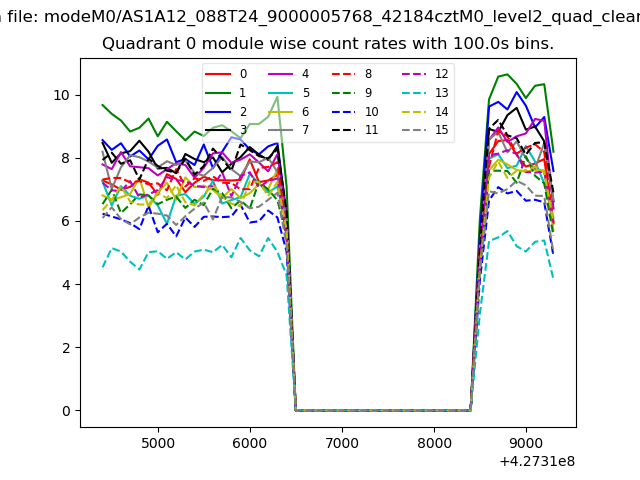 |
 |
| Module-wise count rates for Quadrant B Data is divided into 100 sec bins |
 |
 |
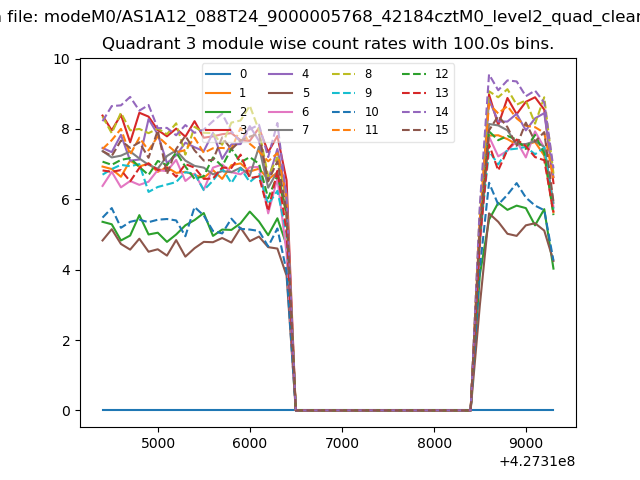
| Module-wise count rates for Quadrant C Data is divided into 100 sec bins |
 |
 |
| Module-wise count rates for Quadrant D Data is divided into 100 sec bins |
 |
 |
| Parameter | Plot |
|---|---|
| CZT HV Monitor | 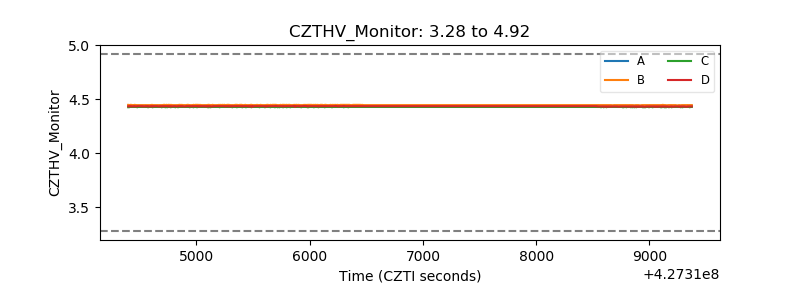 |
| D_VDD |  |
| Temperature 1 | 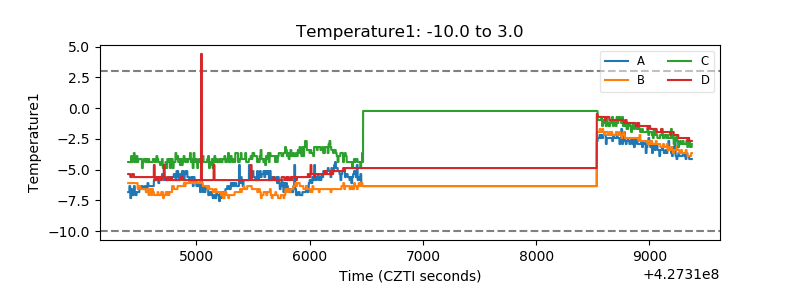 |
| Veto HV Monitor | 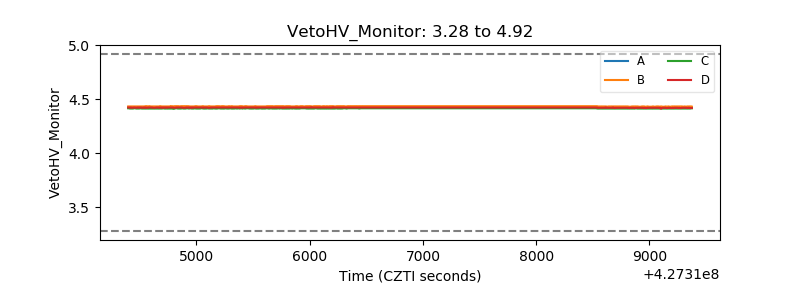 |
| Veto LLD | 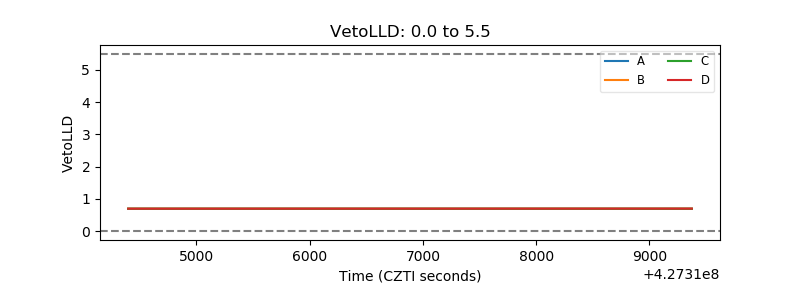 |
| Alpha Counter | 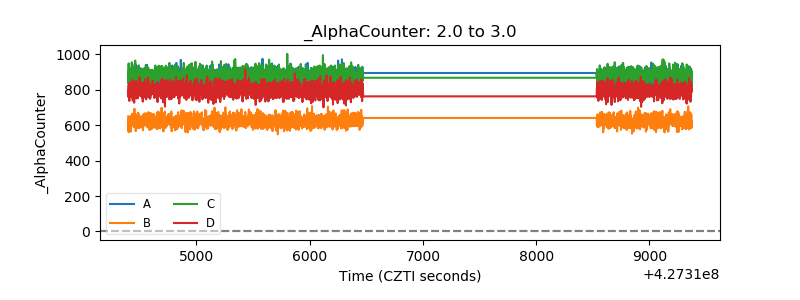 |
| _CPM_Rate | 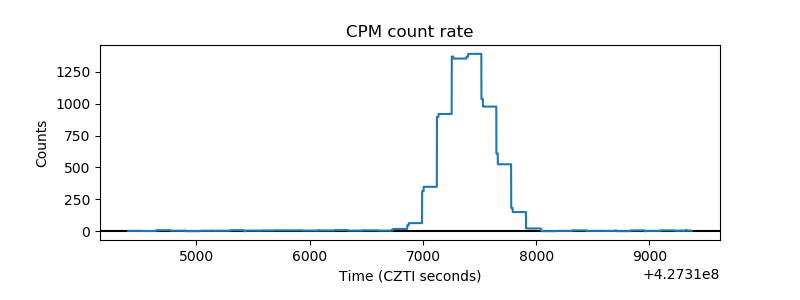 |
| CZT Counter | 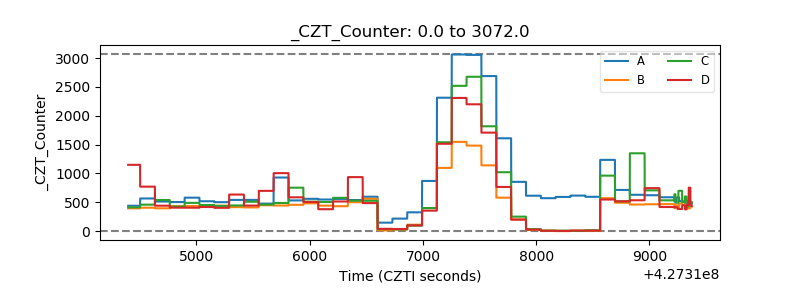 |
| +2.5 Volts monitor | 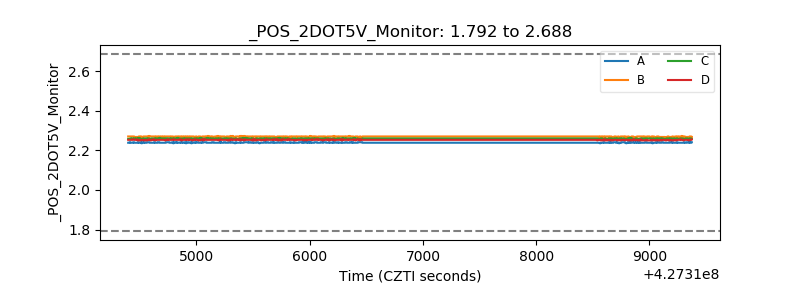 |
| +5 Volts monitor | 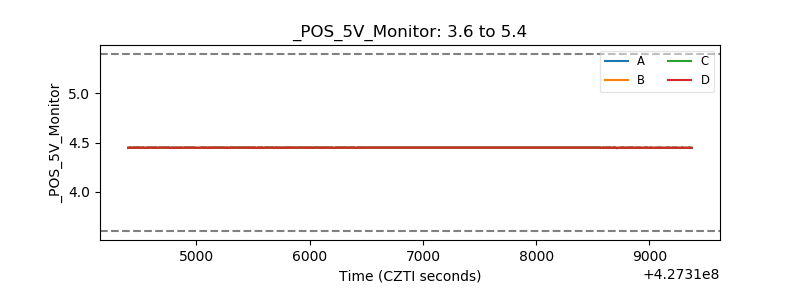 |
| _ROLL_ROT | 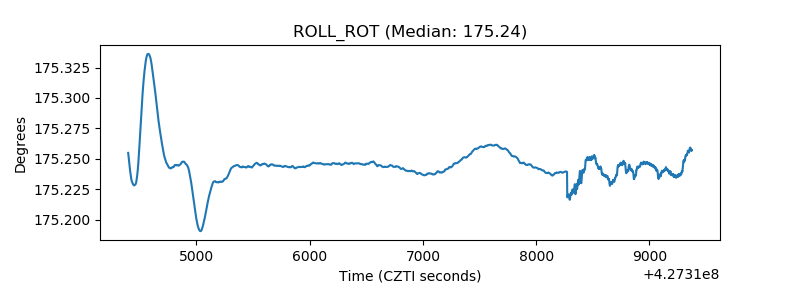 |
| _Roll_DEC | 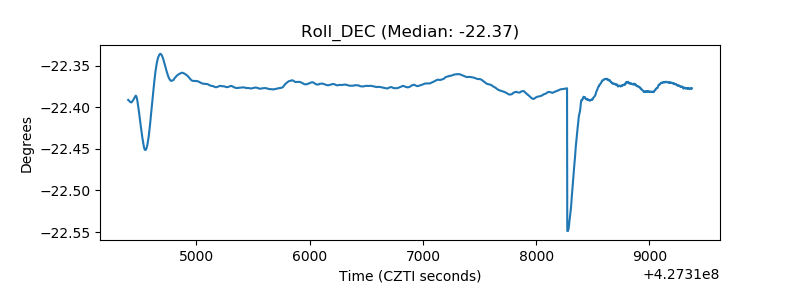 |
| _Roll_RA | 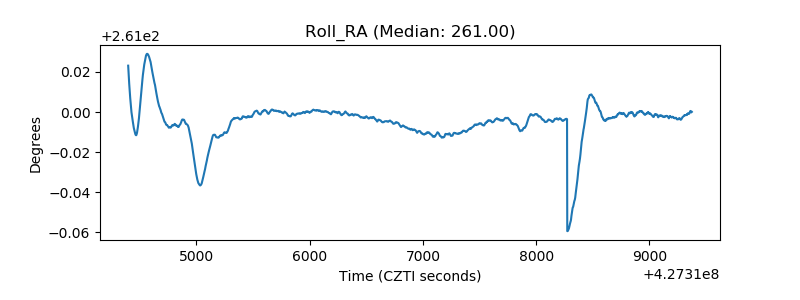 |
| Veto Counter | 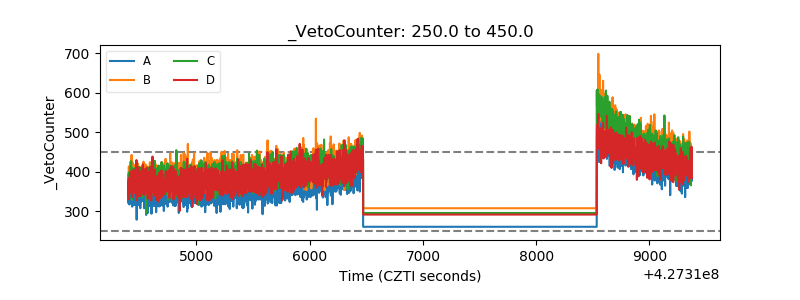 |