| Param | Original file | Final file |
|---|---|---|
| Filename | modeM0/AS1A12_088T24_9000005768_42185cztM0_level2.fits | modeM0/AS1A12_088T24_9000005768_42185cztM0_level2_quad_clean.evt |
| Size (bytes) | 330,474,240 | 83,995,200 |
| Size | 315.2 MB | 80.1 MB |
| Events in quadrant A | 4,208,143 | 526,309 |
| Events in quadrant B | 2,299,056 | 602,297 |
| Events in quadrant C | 2,596,167 | 557,128 |
| Events in quadrant D | 2,747,356 | 513,651 |
| Mode M0 | |||
|---|---|---|---|
| Quadrant | BADHDUFLAG | Total packets | Discarded packets |
| A | 0 | 15811 | 6 |
| B | 0 | 10144 | 2 |
| C | 0 | 10822 | 2 |
| D | 0 | 11631 | 2 |
| Mode M9 | |||
|---|---|---|---|
| Quadrant | BADHDUFLAG | Total packets | Discarded packets |
| A | 0 | 31 | 0 |
| B | 0 | 31 | 0 |
| C | 0 | 32 | 0 |
| D | 0 | 32 | 0 |
| Mode SS | |||
|---|---|---|---|
| Quadrant | BADHDUFLAG | Total packets | Discarded packets |
| A | 0 | 100 | 0 |
| B | 0 | 100 | 0 |
| C | 0 | 100 | 0 |
| D | 0 | 100 | 0 |
| Quadrant | Total seconds | Saturated seconds | Saturation percentage |
|---|---|---|---|
| A | 4904 | 520 | 10.603589% |
| B | 4904 | 9 | 0.183524% |
| C | 4904 | 63 | 1.284666% |
| D | 4904 | 65 | 1.325449% |
Noise dominated data is calculated using 1-second bins in cleaned event files. If a bin has >2000 counts, and if more than 50% of those come from <1% of pixels, then it is considered to be noise-dominated and hence unusable.
| Quadrant | # 1 sec bins | Bins with >0 counts | Bins with >2000 counts | High rate bins dominated by noise | Noise dominated (total time) | Noise dominated (detector-on time) | Marked lightcurve |
|---|---|---|---|---|---|---|---|
| A | 7057 | 4905 | 505 | 505 | 7.16% | 10.30% | 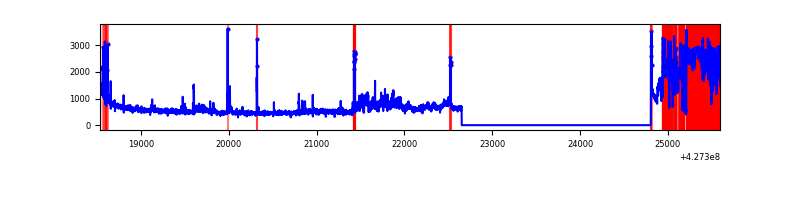 |
| B | 7057 | 4905 | 1 | 1 | 0.01% | 0.02% | 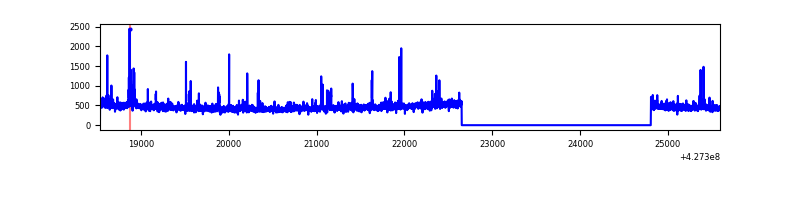 |
| C | 7057 | 4905 | 62 | 62 | 0.88% | 1.26% | 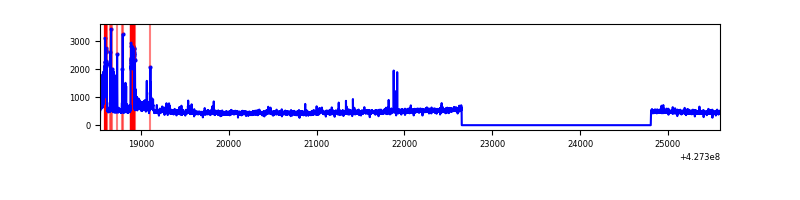 |
| D | 7057 | 4905 | 61 | 61 | 0.86% | 1.24% | 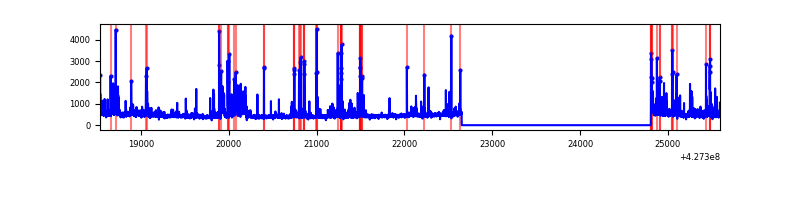 |
Top three noisy pixels from each quadrant. If the there are fewer than three noisy pixels in the level2.evt file, extra rows are filled as -1
| Pixel properties | Quadrant properties | ||||||
|---|---|---|---|---|---|---|---|
| Quadrant | DetID | PixID | Counts | Sigma | Mean | Median | Sigma |
| A | 15 | 223 | 1647741 | 15352.14 | 526 | 515 | 107.3 |
| A | 10 | 83 | 509081 | 4739.83 | 526 | 515 | 107.3 |
| A | 13 | 248 | 13273 | 118.9 | 526 | 515 | 107.3 |
| B | 0 | 229 | 63862 | 594.0 | 551 | 537 | 106.6 |
| B | 5 | 255 | 39209 | 362.75 | 551 | 537 | 106.6 |
| B | 15 | 35 | 14540 | 131.35 | 551 | 537 | 106.6 |
| C | 8 | 79 | 276302 | 2215.02 | 531 | 536 | 124.5 |
| C | 15 | 214 | 204249 | 1636.27 | 531 | 536 | 124.5 |
| C | 7 | 220 | 24971 | 196.27 | 531 | 536 | 124.5 |
| D | 2 | 16 | 125887 | 971.4 | 527 | 513 | 129.1 |
| D | 12 | 6 | 117997 | 910.27 | 527 | 513 | 129.1 |
| D | 1 | 52 | 117386 | 905.54 | 527 | 513 | 129.1 |
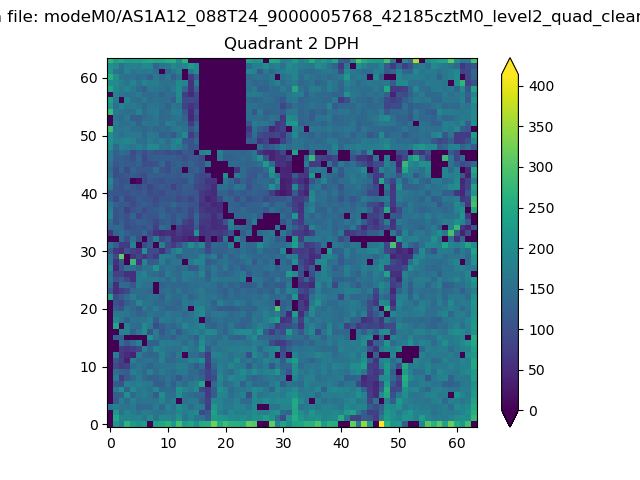
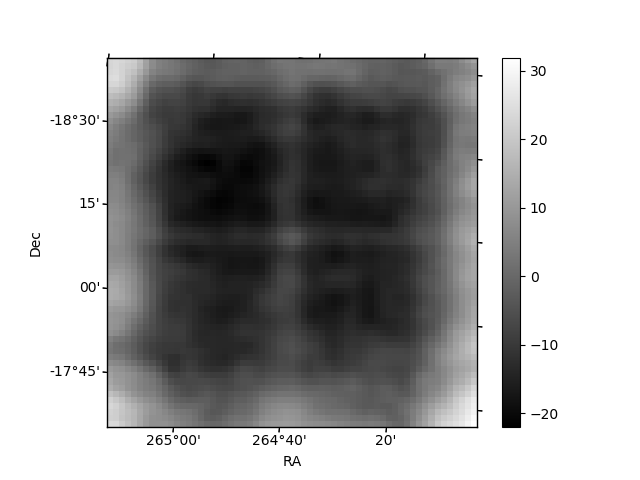
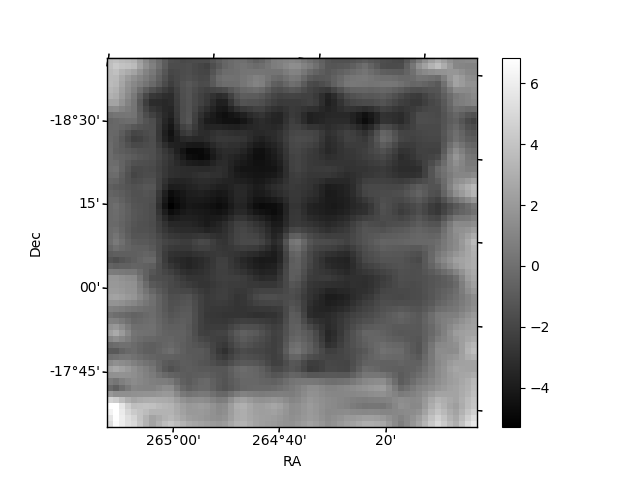
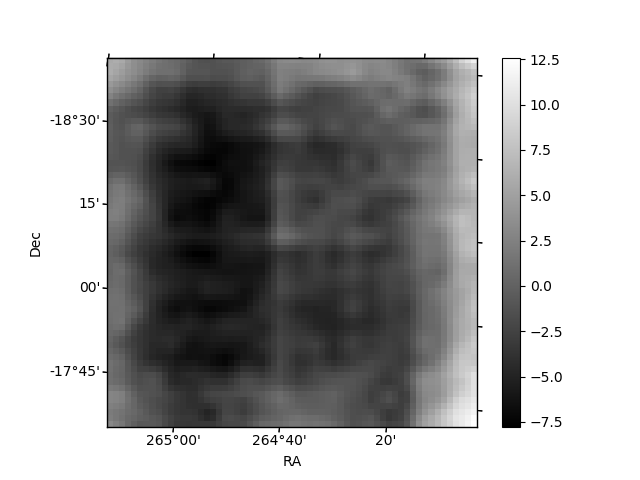
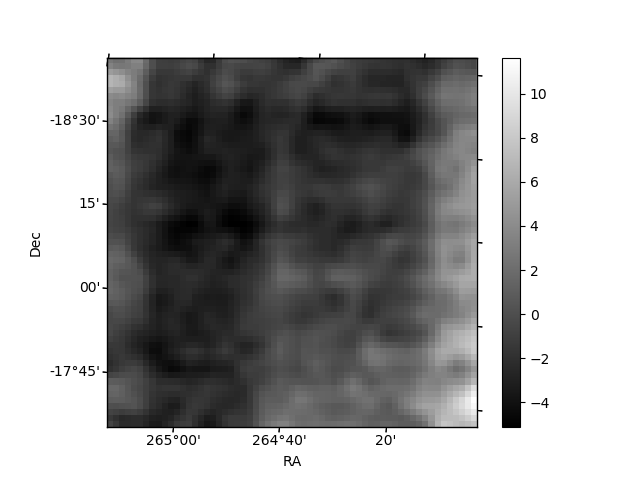
Histogram calculated using DETX and DETY for each event in the final _common_clean file
| Quadrant A | 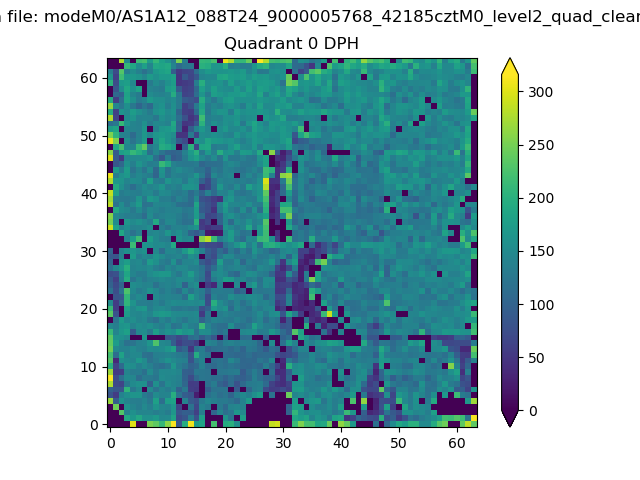 |
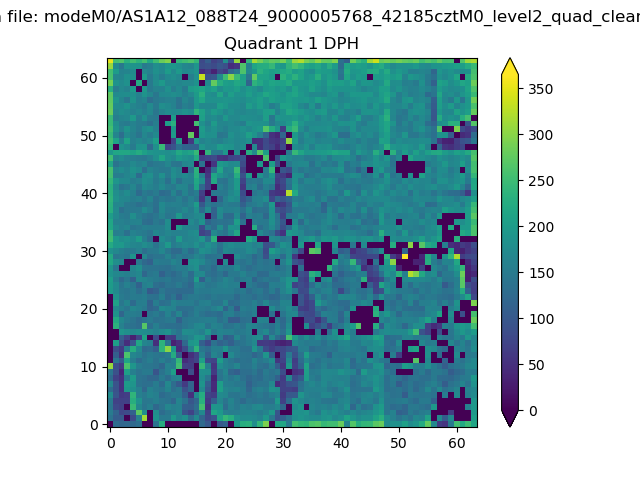 |
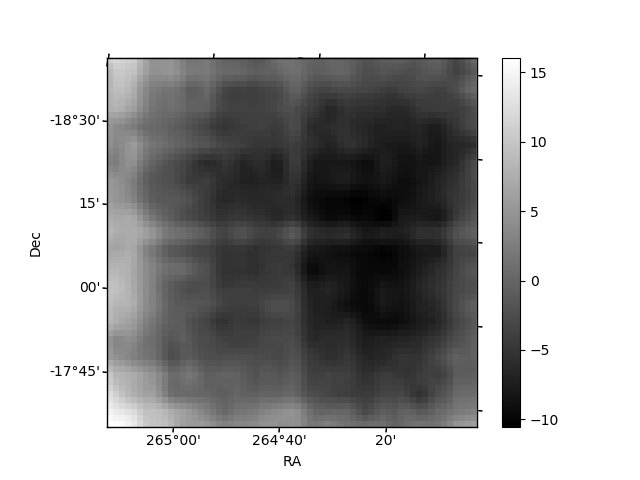
Quadrant B |
|---|---|---|---|
| Quadrant D | 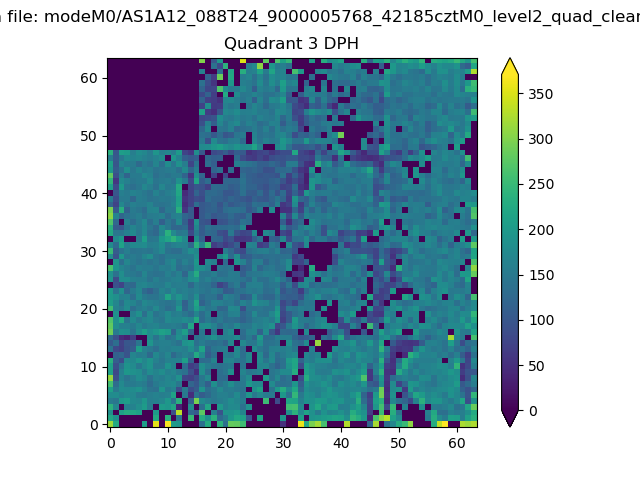 |
 |
Quadrant C |
| Plot type | Count rate plots | Images |
|---|---|---|
| Comparison with Poisson distribution Blue bars denote a histogram of data divided into 1 sec bins. Red curve is a Poisson curve with rate = median count rate of data. |
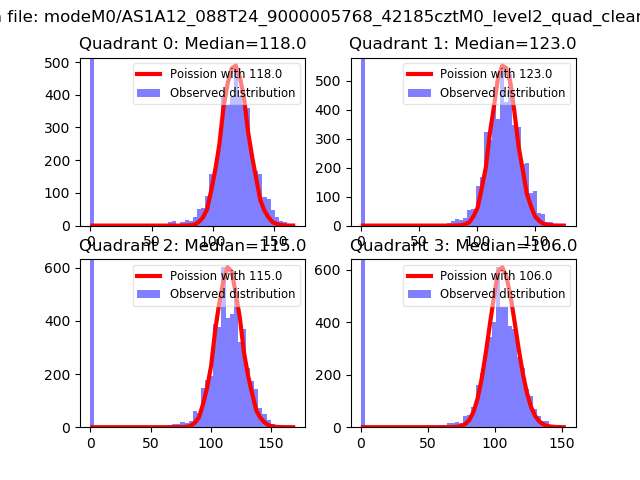 |
 |
| Quadrant-wise count rates Data is divided into 100 sec bins |
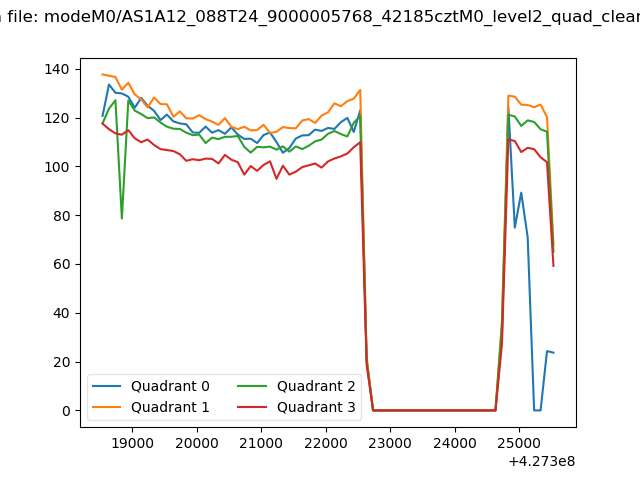 |
|
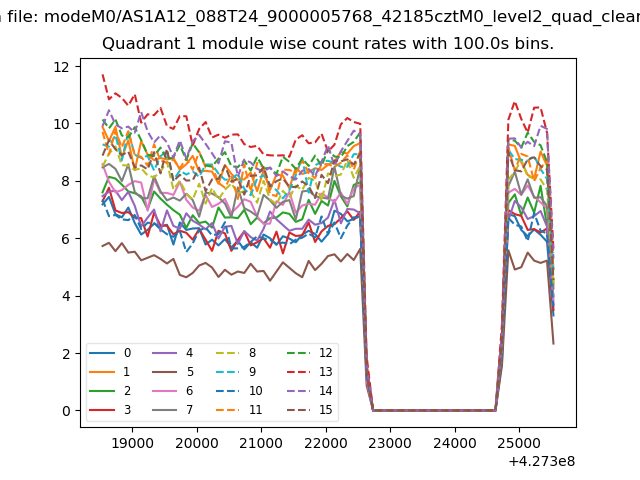
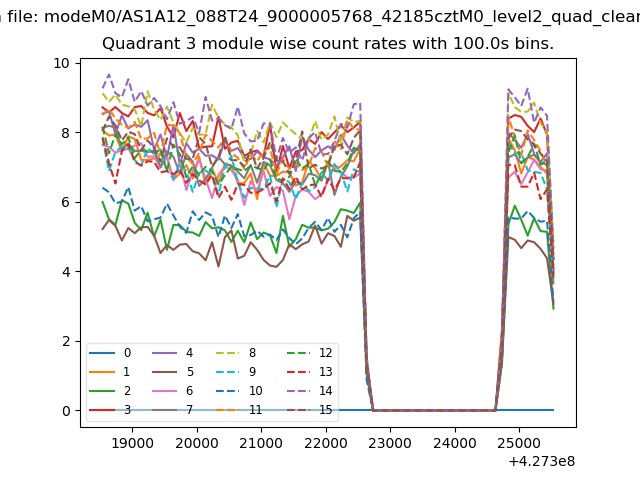
| Module-wise count rates for Quadrant A Data is divided into 100 sec bins |
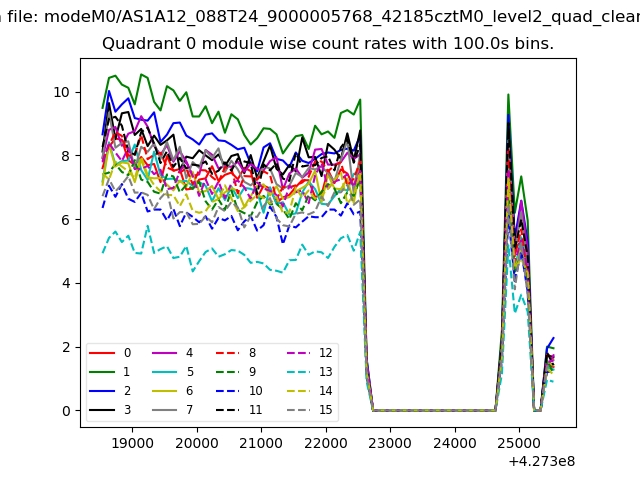 |
 |
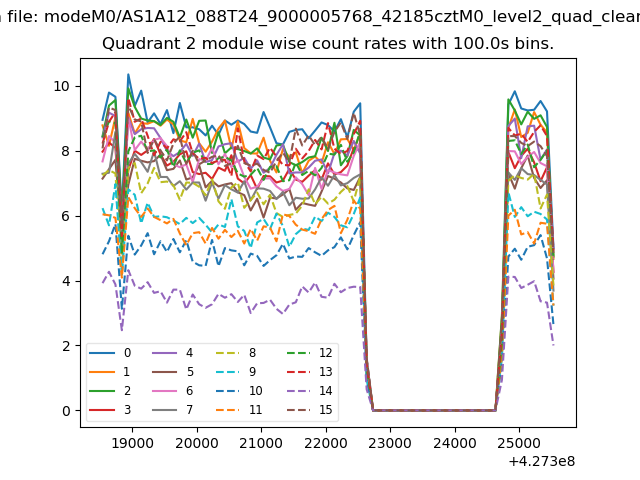
| Module-wise count rates for Quadrant B Data is divided into 100 sec bins |
 |
 |
| Module-wise count rates for Quadrant C Data is divided into 100 sec bins |
 |
 |
| Module-wise count rates for Quadrant D Data is divided into 100 sec bins |
 |
 |
| Parameter | Plot |
|---|---|
| CZT HV Monitor | 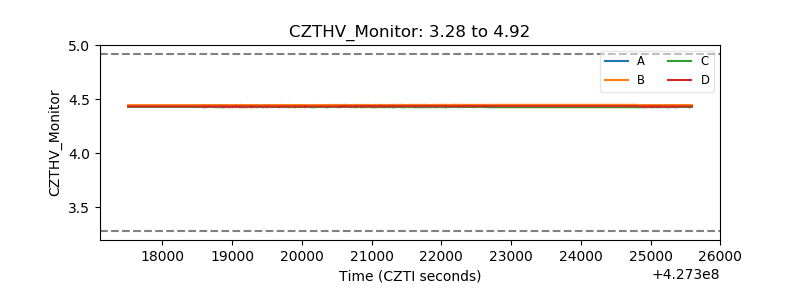 |
| D_VDD | 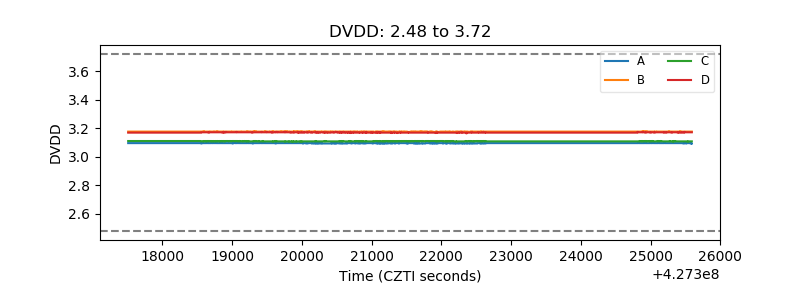 |
| Temperature 1 | 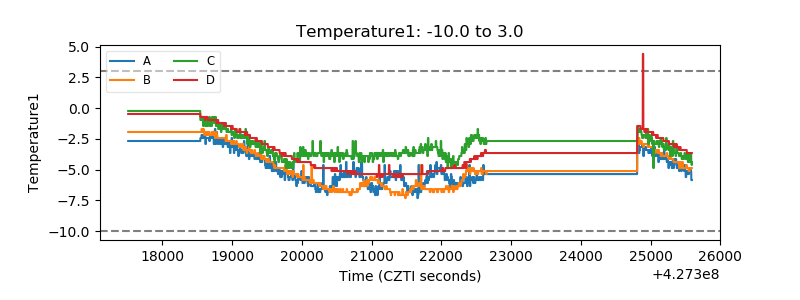 |
| Veto HV Monitor | 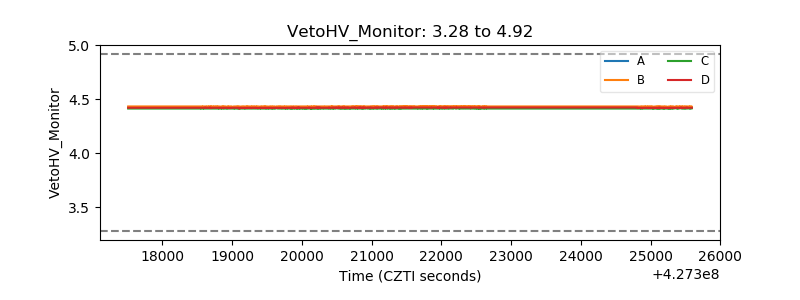 |
| Veto LLD | 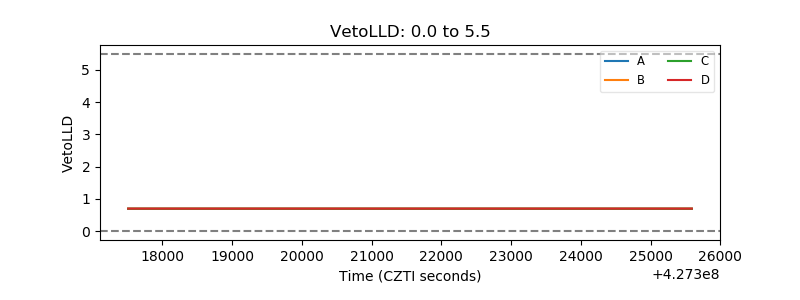 |
| Alpha Counter | 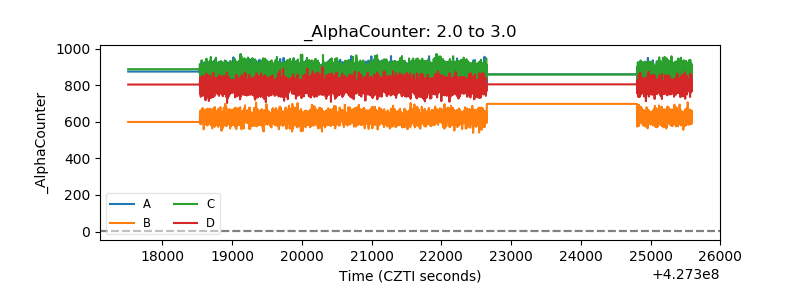 |
| _CPM_Rate | 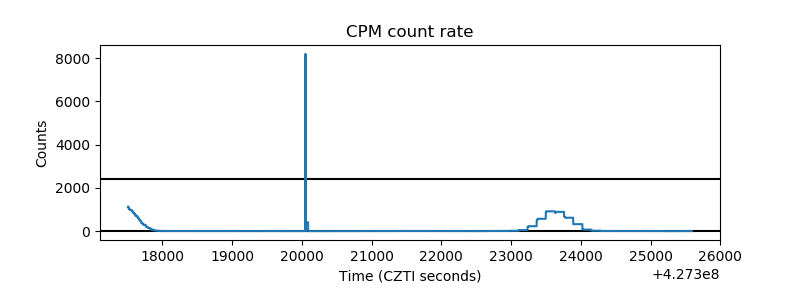 |
| CZT Counter |  |
| +2.5 Volts monitor | 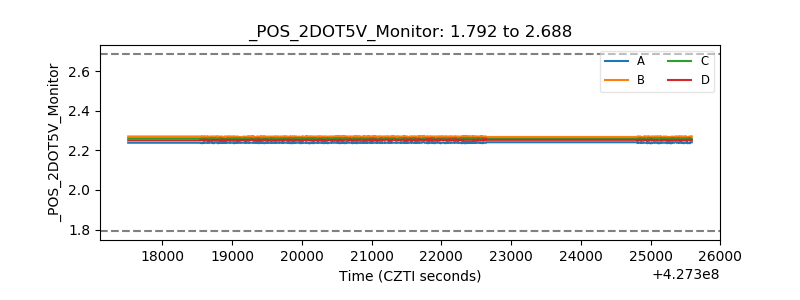 |
| +5 Volts monitor | 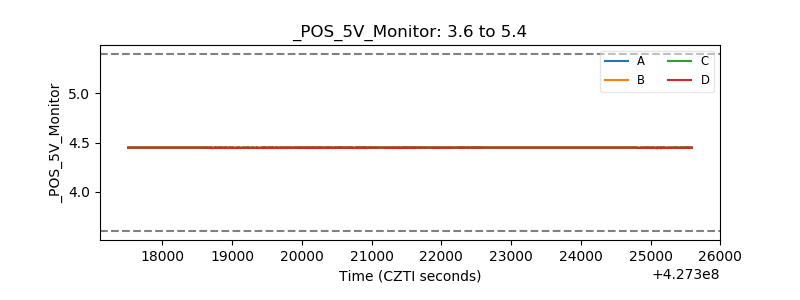 |
| _ROLL_ROT | 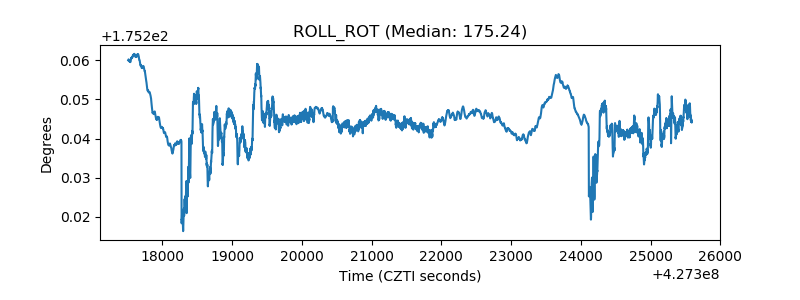 |
| _Roll_DEC | 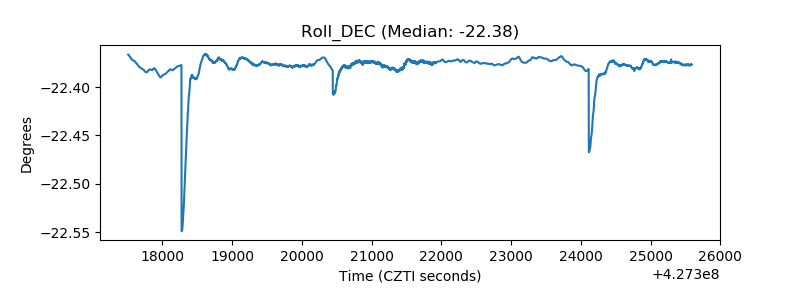 |
| _Roll_RA | 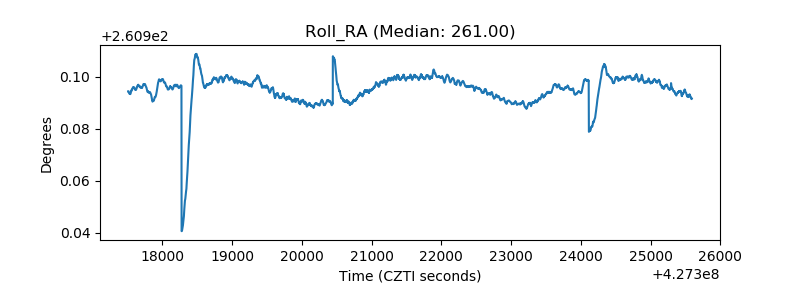 |
| Veto Counter | 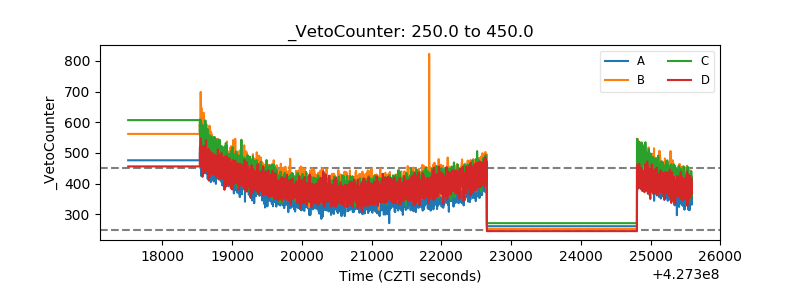 |