| Param | Original file | Final file |
|---|---|---|
| Filename | modeM0/AS1A12_088T24_9000005768_42186cztM0_level2.fits | modeM0/AS1A12_088T24_9000005768_42186cztM0_level2_quad_clean.evt |
| Size (bytes) | 365,538,240 | 79,404,480 |
| Size | 348.6 MB | 75.7 MB |
| Events in quadrant A | 5,821,425 | 461,834 |
| Events in quadrant B | 2,269,155 | 575,957 |
| Events in quadrant C | 2,251,477 | 540,265 |
| Events in quadrant D | 2,809,672 | 484,712 |
| Mode M0 | |||
|---|---|---|---|
| Quadrant | BADHDUFLAG | Total packets | Discarded packets |
| A | 0 | 20483 | 2 |
| B | 0 | 10081 | 4 |
| C | 0 | 9830 | 2 |
| D | 0 | 11860 | 2 |
| Mode M9 | |||
|---|---|---|---|
| Quadrant | BADHDUFLAG | Total packets | Discarded packets |
| A | 0 | 34 | 0 |
| B | 0 | 35 | 0 |
| C | 0 | 35 | 0 |
| D | 0 | 35 | 0 |
| Mode SS | |||
|---|---|---|---|
| Quadrant | BADHDUFLAG | Total packets | Discarded packets |
| A | 0 | 100 | 0 |
| B | 0 | 100 | 0 |
| C | 0 | 100 | 0 |
| D | 0 | 100 | 0 |
| Quadrant | Total seconds | Saturated seconds | Saturation percentage |
|---|---|---|---|
| A | 4868 | 961 | 19.741167% |
| B | 4867 | 15 | 0.308198% |
| C | 4867 | 4 | 0.082186% |
| D | 4867 | 149 | 3.061434% |
Noise dominated data is calculated using 1-second bins in cleaned event files. If a bin has >2000 counts, and if more than 50% of those come from <1% of pixels, then it is considered to be noise-dominated and hence unusable.
| Quadrant | # 1 sec bins | Bins with >0 counts | Bins with >2000 counts | High rate bins dominated by noise | Noise dominated (total time) | Noise dominated (detector-on time) | Marked lightcurve |
|---|---|---|---|---|---|---|---|
| A | 6991 | 4869 | 995 | 995 | 14.23% | 20.44% | 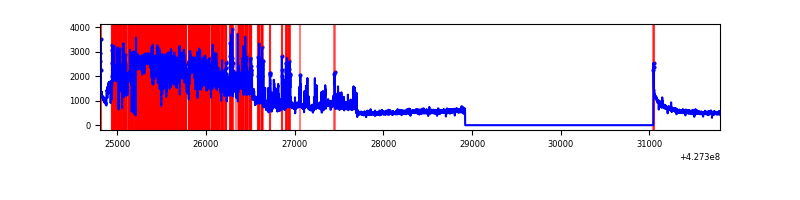 |
| B | 6990 | 4868 | 9 | 9 | 0.13% | 0.18% | 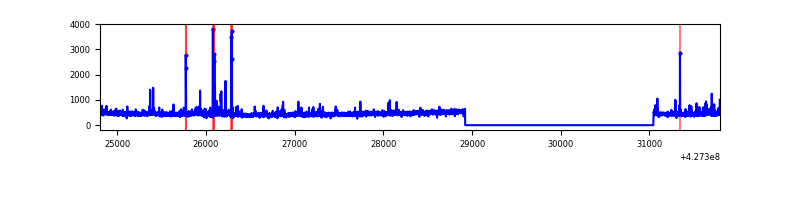 |
| C | 6990 | 4868 | 0 | 0 | 0.00% | 0.00% | 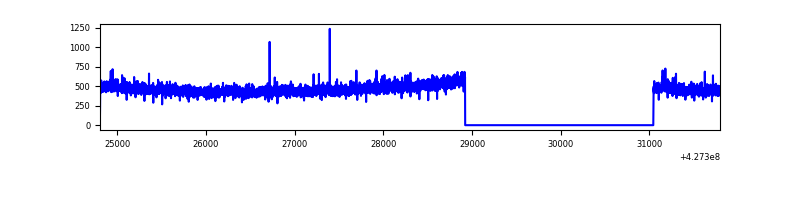 |
| D | 6990 | 4868 | 139 | 139 | 1.99% | 2.86% | 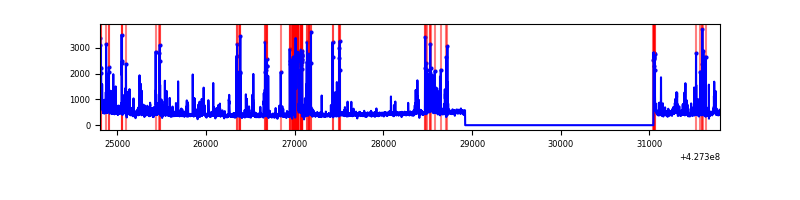 |
Top three noisy pixels from each quadrant. If the there are fewer than three noisy pixels in the level2.evt file, extra rows are filled as -1
| Pixel properties | Quadrant properties | ||||||
|---|---|---|---|---|---|---|---|
| Quadrant | DetID | PixID | Counts | Sigma | Mean | Median | Sigma |
| A | 15 | 223 | 3387706 | 32776.14 | 498 | 487 | 103.3 |
| A | 10 | 83 | 488981 | 4726.87 | 498 | 487 | 103.3 |
| A | 15 | 252 | 14896 | 139.43 | 498 | 487 | 103.3 |
| B | 5 | 255 | 107682 | 1041.93 | 535 | 522 | 102.8 |
| B | 0 | 229 | 47145 | 453.32 | 535 | 522 | 102.8 |
| B | 12 | 111 | 12880 | 120.16 | 535 | 522 | 102.8 |
| C | 15 | 214 | 206059 | 1671.35 | 521 | 524 | 123.0 |
| C | 7 | 247 | 4550 | 32.74 | 521 | 524 | 123.0 |
| C | 0 | 207 | 4153 | 29.51 | 521 | 524 | 123.0 |
| D | 13 | 249 | 246664 | 1960.51 | 508 | 493 | 125.6 |
| D | 12 | 6 | 150480 | 1194.5 | 508 | 493 | 125.6 |
| D | 1 | 52 | 126382 | 1002.58 | 508 | 493 | 125.6 |
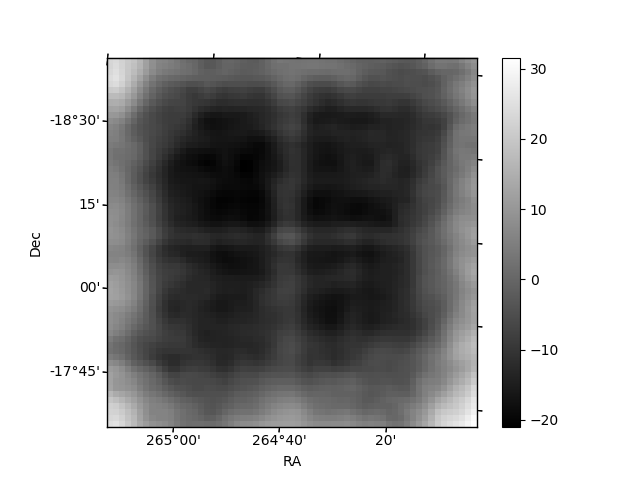
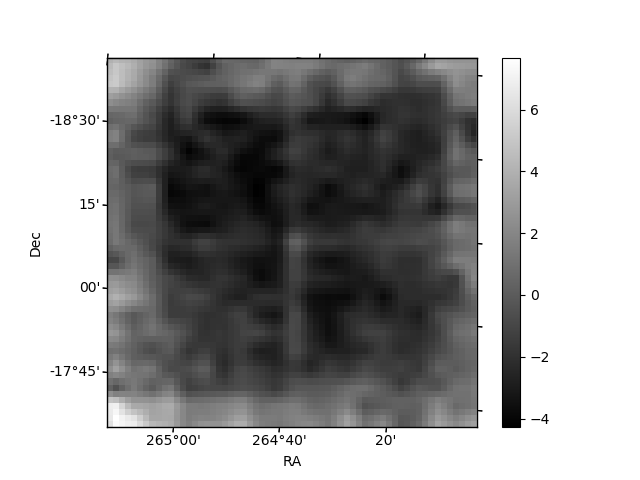
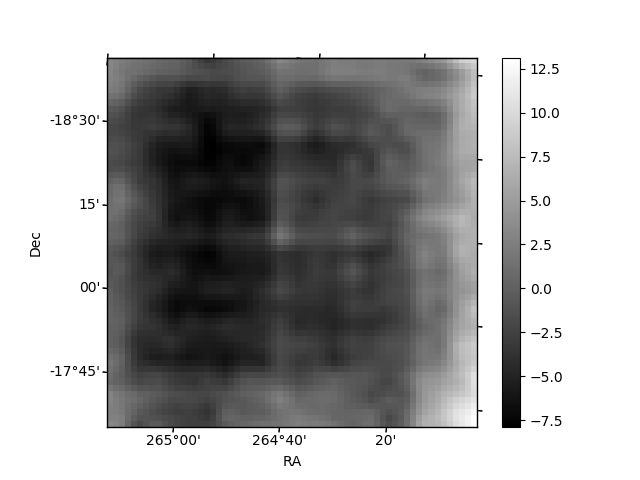
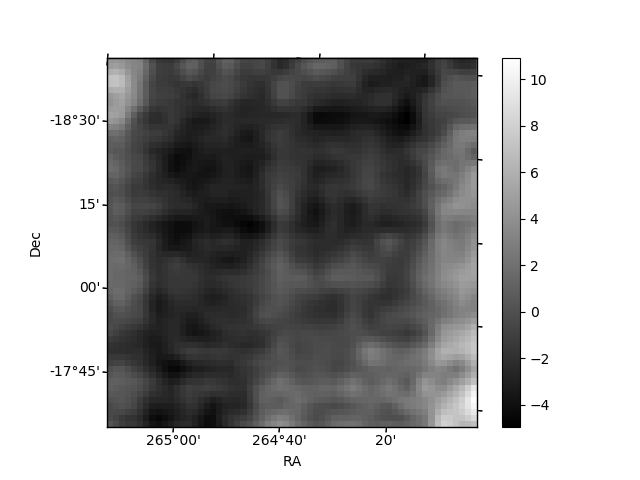
Histogram calculated using DETX and DETY for each event in the final _common_clean file
| Quadrant A | 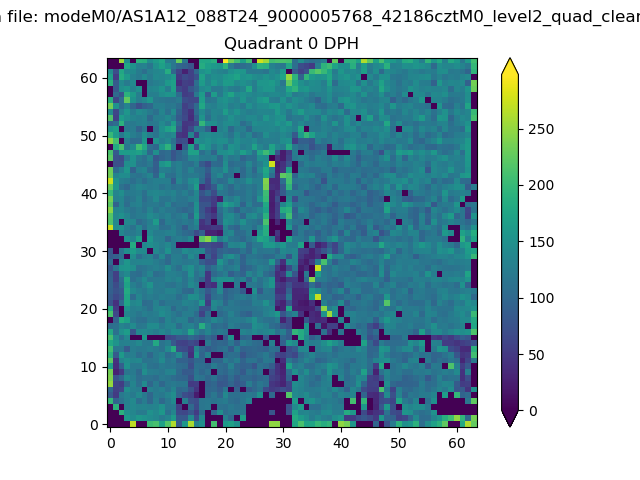 |
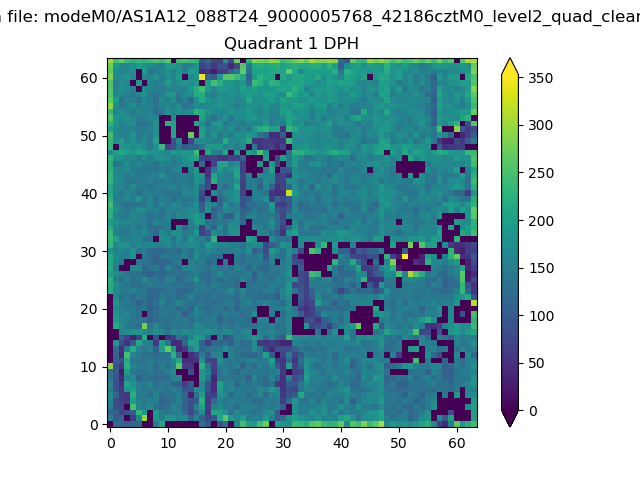 |
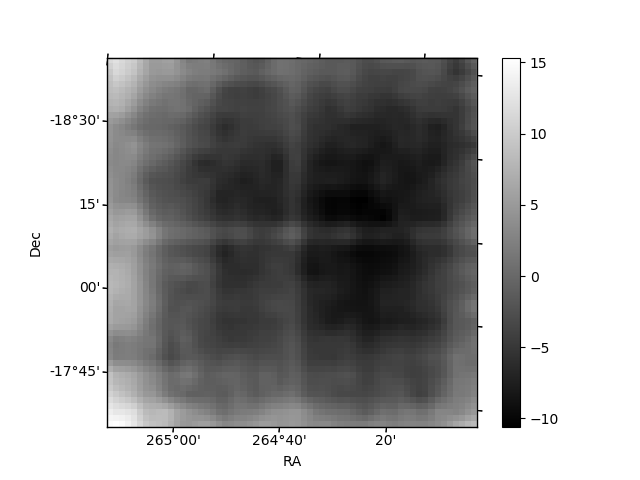
Quadrant B |
|---|---|---|---|
| Quadrant D | 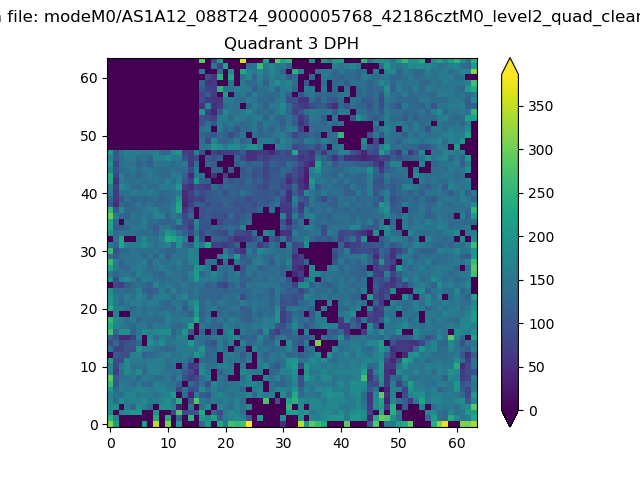 |
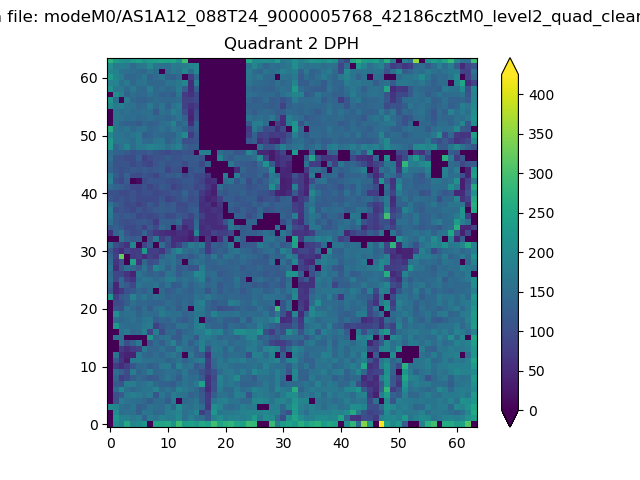 |
Quadrant C |
| Plot type | Count rate plots | Images |
|---|---|---|
| Comparison with Poisson distribution Blue bars denote a histogram of data divided into 1 sec bins. Red curve is a Poisson curve with rate = median count rate of data. |
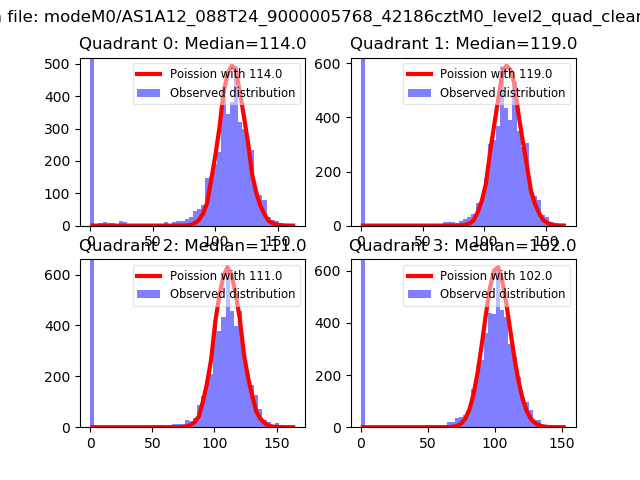 |
 |
| Quadrant-wise count rates Data is divided into 100 sec bins |
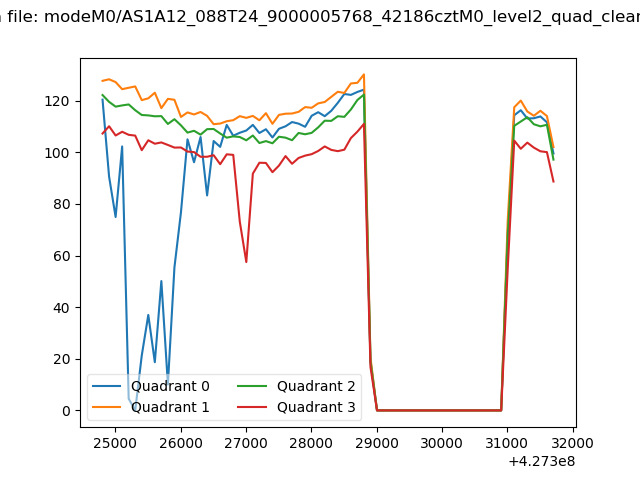 |
|
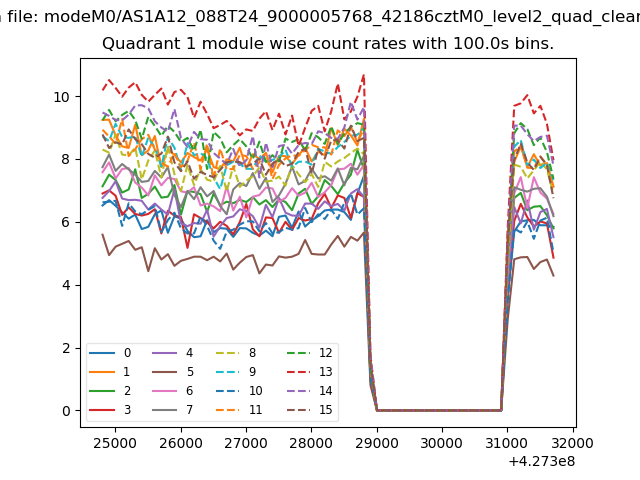
| Module-wise count rates for Quadrant A Data is divided into 100 sec bins |
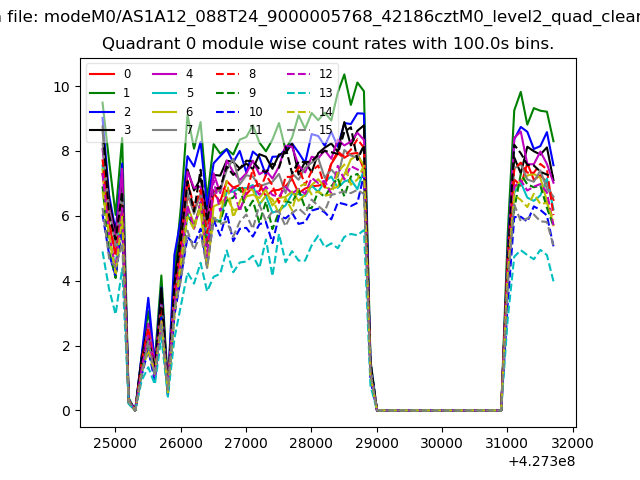 |
 |
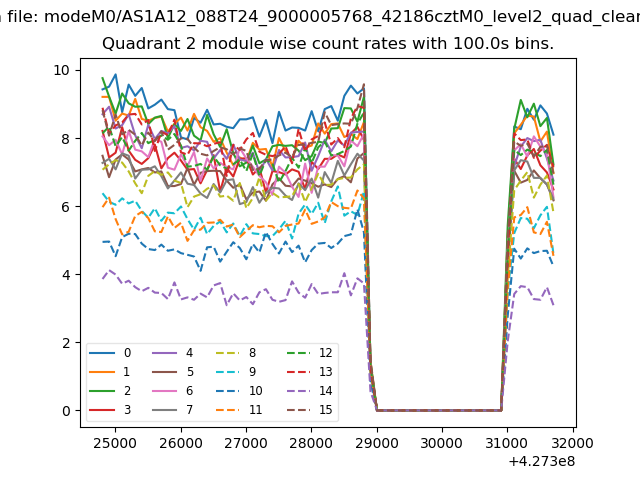
| Module-wise count rates for Quadrant B Data is divided into 100 sec bins |
 |
 |
| Module-wise count rates for Quadrant C Data is divided into 100 sec bins |
 |
 |
| Module-wise count rates for Quadrant D Data is divided into 100 sec bins |
 |
 |
| Parameter | Plot |
|---|---|
| CZT HV Monitor | 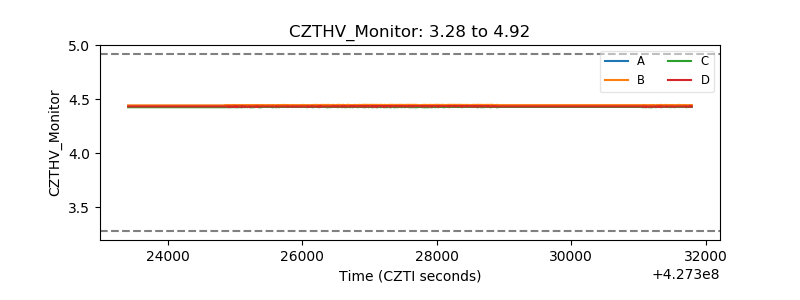 |
| D_VDD | 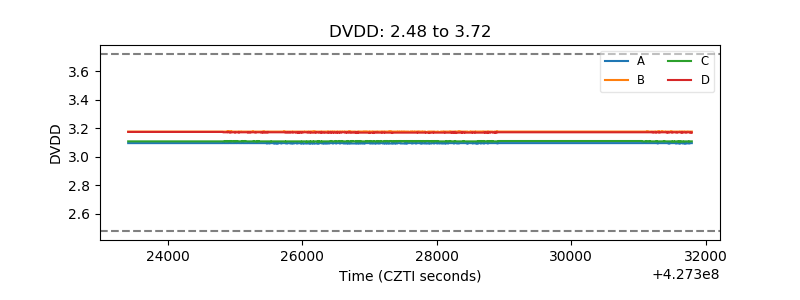 |
| Temperature 1 | 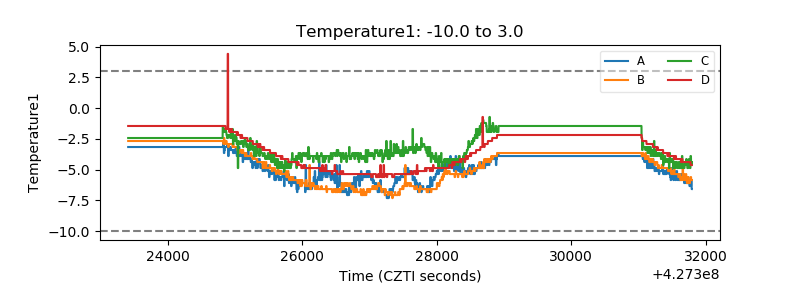 |
| Veto HV Monitor | 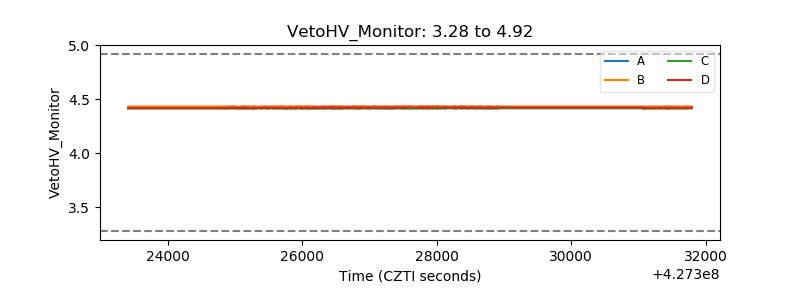 |
| Veto LLD | 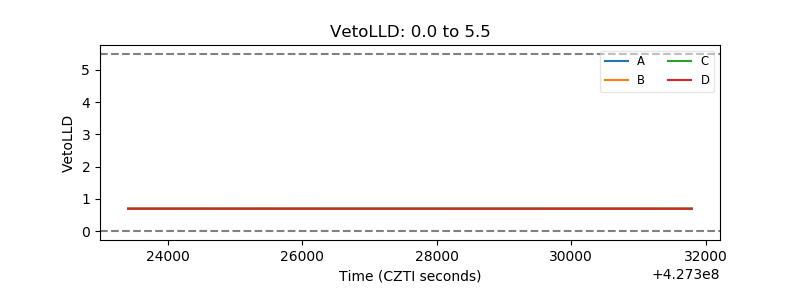 |
| Alpha Counter | 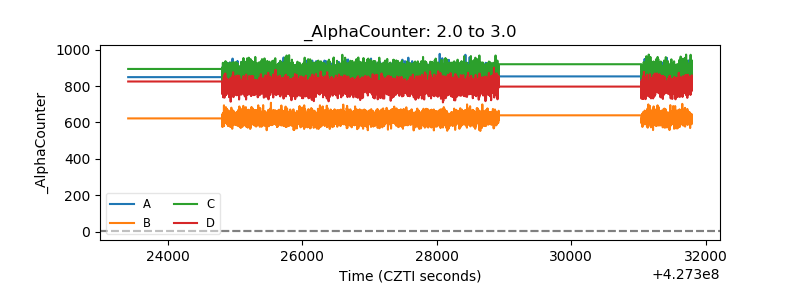 |
| _CPM_Rate | 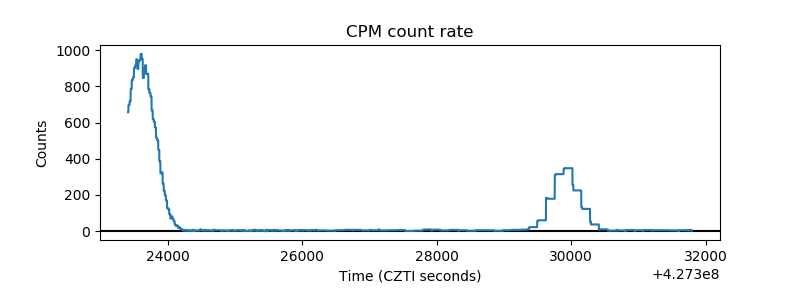 |
| CZT Counter | 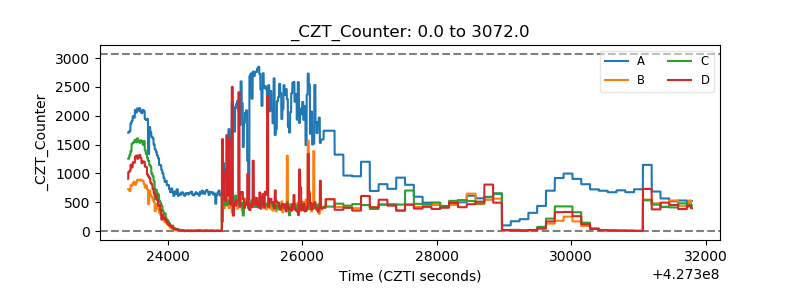 |
| +2.5 Volts monitor | 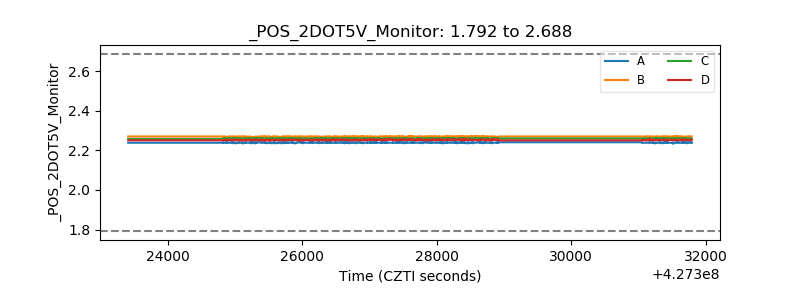 |
| +5 Volts monitor | 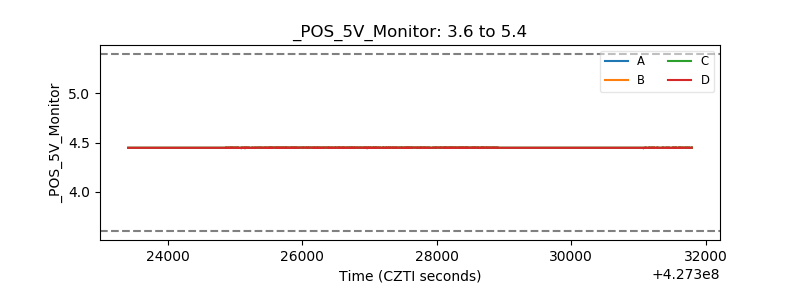 |
| _ROLL_ROT | 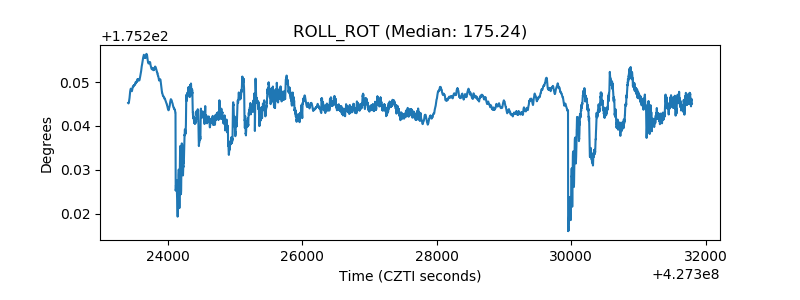 |
| _Roll_DEC | 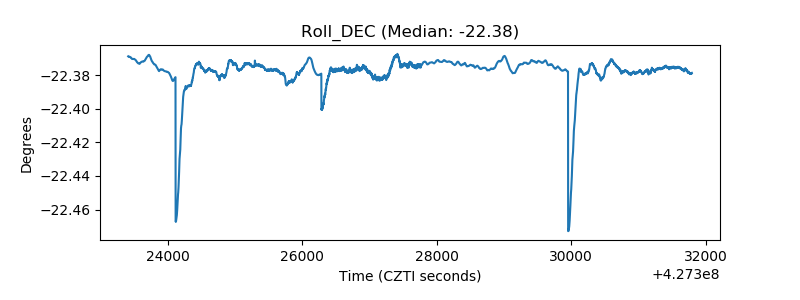 |
| _Roll_RA | 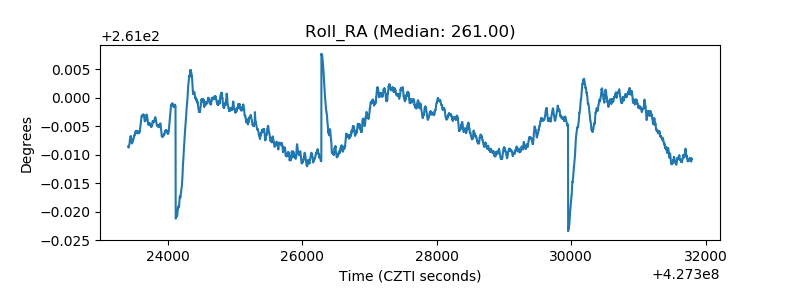 |
| Veto Counter | 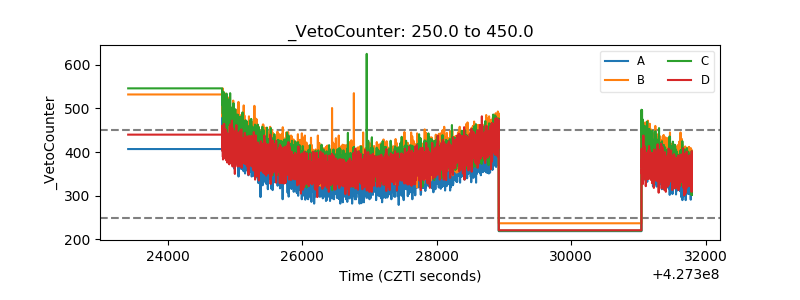 |