| Param | Original file | Final file |
|---|---|---|
| Filename | modeM0/AS1A12_088T24_9000005768_42187cztM0_level2.fits | modeM0/AS1A12_088T24_9000005768_42187cztM0_level2_quad_clean.evt |
| Size (bytes) | 303,442,560 | 86,955,840 |
| Size | 289.4 MB | 82.9 MB |
| Events in quadrant A | 2,826,744 | 584,143 |
| Events in quadrant B | 2,522,644 | 604,970 |
| Events in quadrant C | 2,402,346 | 568,731 |
| Events in quadrant D | 3,072,778 | 509,005 |
| Mode M0 | |||
|---|---|---|---|
| Quadrant | BADHDUFLAG | Total packets | Discarded packets |
| A | 0 | 11538 | 2 |
| B | 0 | 11123 | 2 |
| C | 0 | 10535 | 2 |
| D | 0 | 12968 | 2 |
| Mode M9 | |||
|---|---|---|---|
| Quadrant | BADHDUFLAG | Total packets | Discarded packets |
| A | 0 | 41 | 0 |
| B | 0 | 41 | 0 |
| C | 0 | 41 | 0 |
| D | 0 | 41 | 0 |
| Mode SS | |||
|---|---|---|---|
| Quadrant | BADHDUFLAG | Total packets | Discarded packets |
| A | 0 | 108 | 0 |
| B | 0 | 108 | 0 |
| C | 0 | 108 | 0 |
| D | 0 | 108 | 0 |
| Quadrant | Total seconds | Saturated seconds | Saturation percentage |
|---|---|---|---|
| A | 5231 | 13 | 0.248518% |
| B | 5232 | 17 | 0.324924% |
| C | 5231 | 4 | 0.076467% |
| D | 5231 | 153 | 2.924871% |
Noise dominated data is calculated using 1-second bins in cleaned event files. If a bin has >2000 counts, and if more than 50% of those come from <1% of pixels, then it is considered to be noise-dominated and hence unusable.
| Quadrant | # 1 sec bins | Bins with >0 counts | Bins with >2000 counts | High rate bins dominated by noise | Noise dominated (total time) | Noise dominated (detector-on time) | Marked lightcurve |
|---|---|---|---|---|---|---|---|
| A | 9327 | 5233 | 11 | 11 | 0.12% | 0.21% | 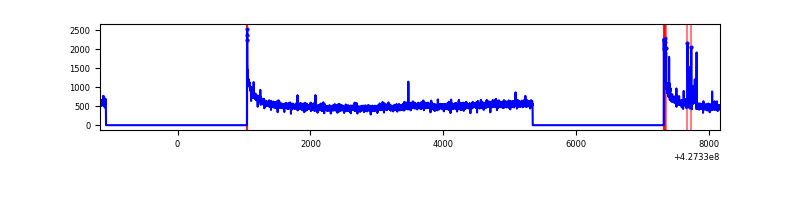 |
| B | 9328 | 5234 | 13 | 13 | 0.14% | 0.25% | 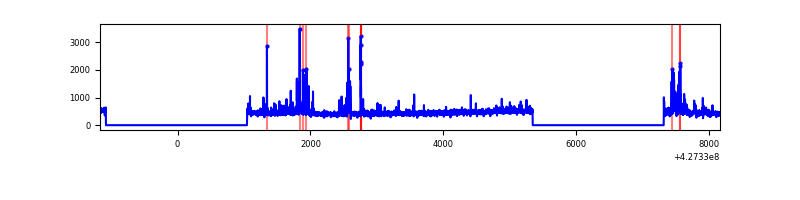 |
| C | 9327 | 5233 | 0 | 0 | 0.00% | 0.00% | 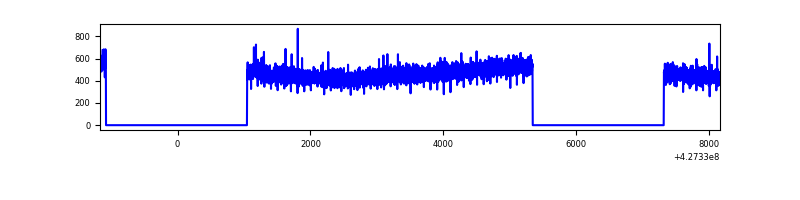 |
| D | 9327 | 5232 | 171 | 171 | 1.83% | 3.27% | 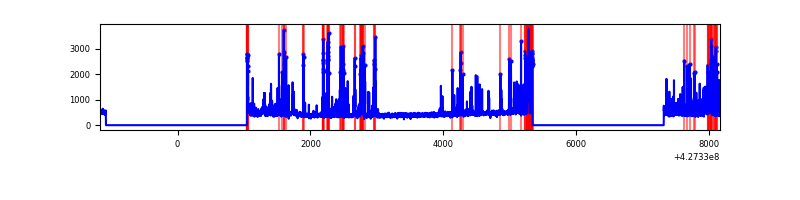 |
Top three noisy pixels from each quadrant. If the there are fewer than three noisy pixels in the level2.evt file, extra rows are filled as -1
| Pixel properties | Quadrant properties | ||||||
|---|---|---|---|---|---|---|---|
| Quadrant | DetID | PixID | Counts | Sigma | Mean | Median | Sigma |
| A | 10 | 83 | 523416 | 4463.84 | 571 | 559 | 117.1 |
| A | 15 | 223 | 82706 | 701.32 | 571 | 559 | 117.1 |
| A | 15 | 252 | 6838 | 53.61 | 571 | 559 | 117.1 |
| B | 5 | 255 | 172264 | 1550.85 | 571 | 556 | 110.7 |
| B | 0 | 229 | 87113 | 781.77 | 571 | 556 | 110.7 |
| B | 15 | 35 | 17163 | 149.99 | 571 | 556 | 110.7 |
| C | 15 | 214 | 219358 | 1668.25 | 558 | 562 | 131.2 |
| C | 13 | 61 | 3788 | 24.6 | 558 | 562 | 131.2 |
| C | 15 | 111 | 2721 | 16.46 | 558 | 562 | 131.2 |
| D | 12 | 218 | 269920 | 1995.41 | 542 | 525 | 135.0 |
| D | 12 | 6 | 237631 | 1756.24 | 542 | 525 | 135.0 |
| D | 7 | 55 | 175224 | 1293.99 | 542 | 525 | 135.0 |
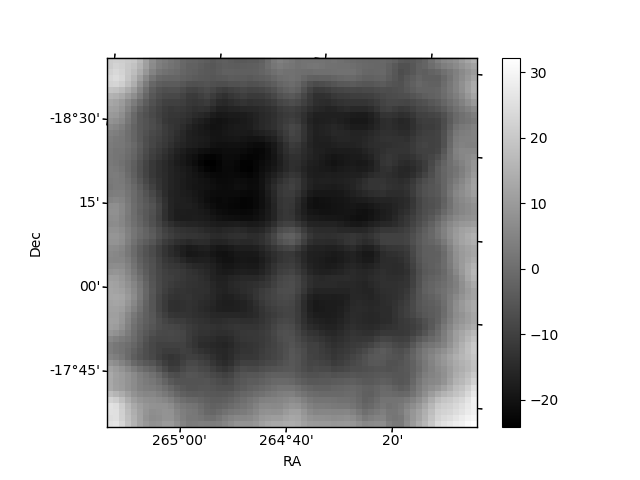
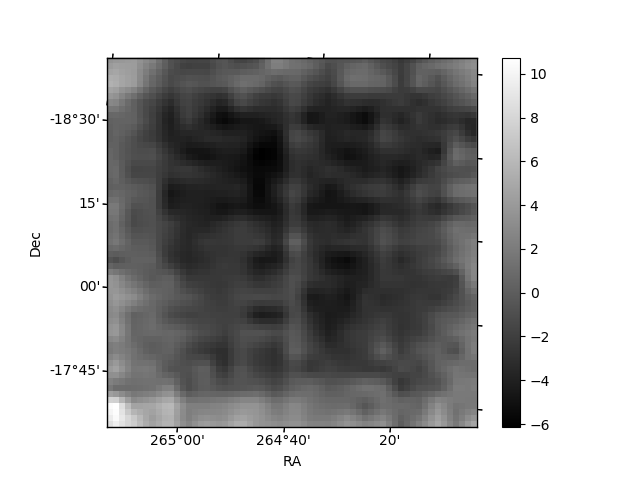
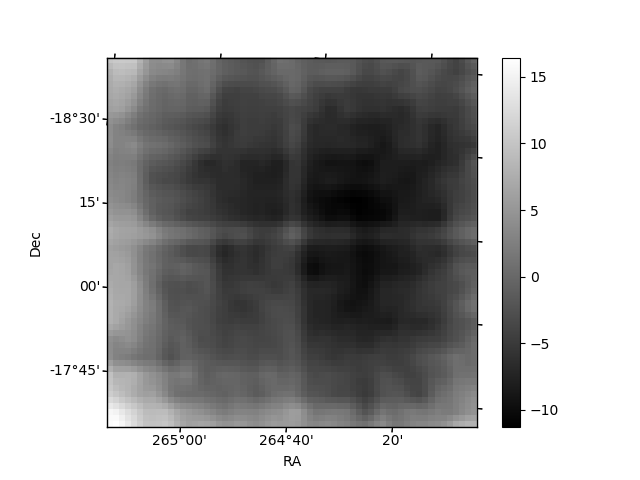
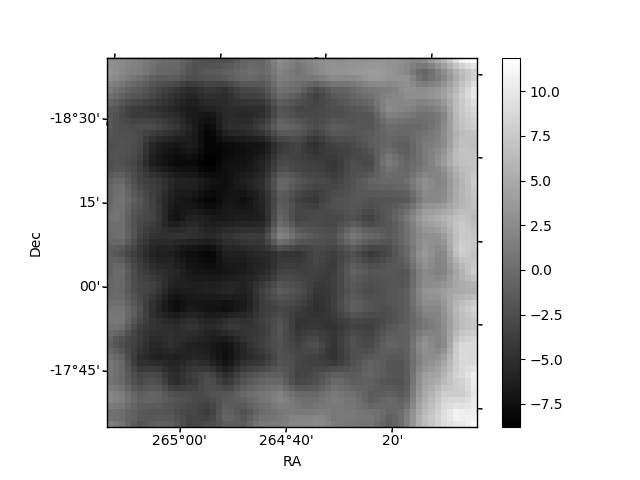
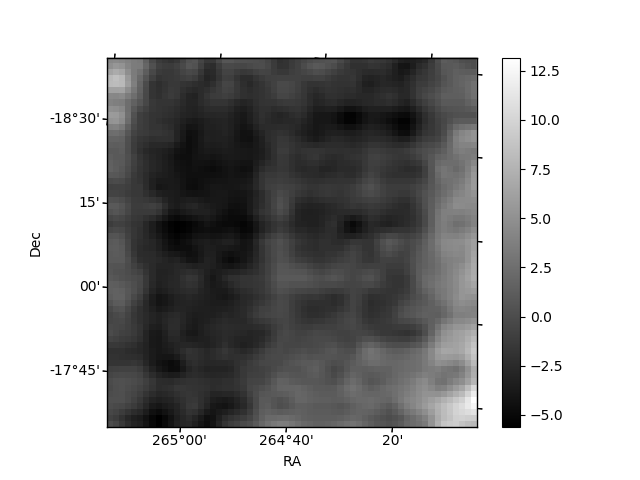
Histogram calculated using DETX and DETY for each event in the final _common_clean file
| Quadrant A | 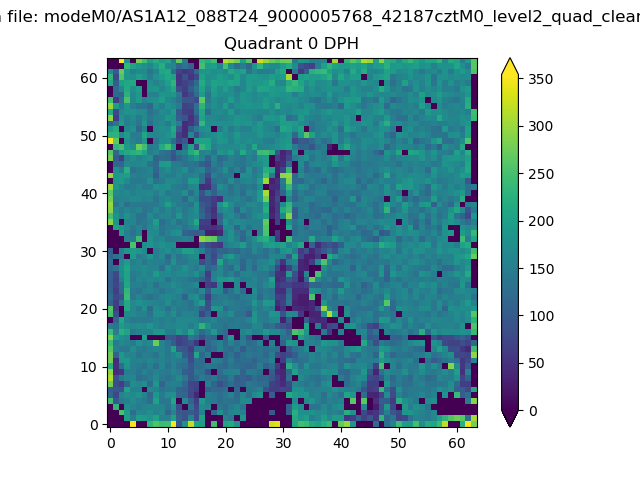 |
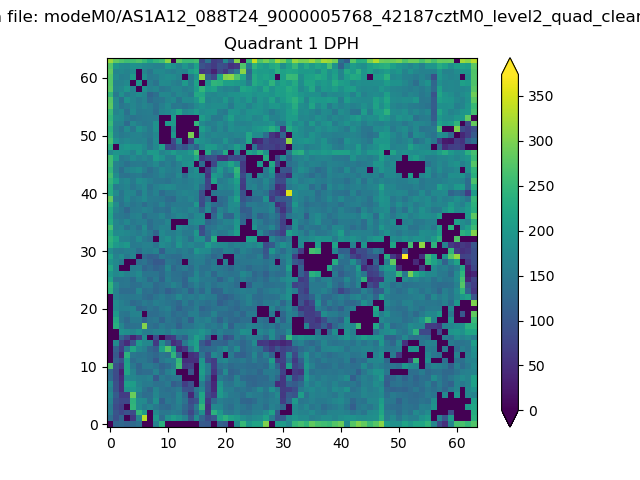 |
Quadrant B |
|---|---|---|---|
| Quadrant D | 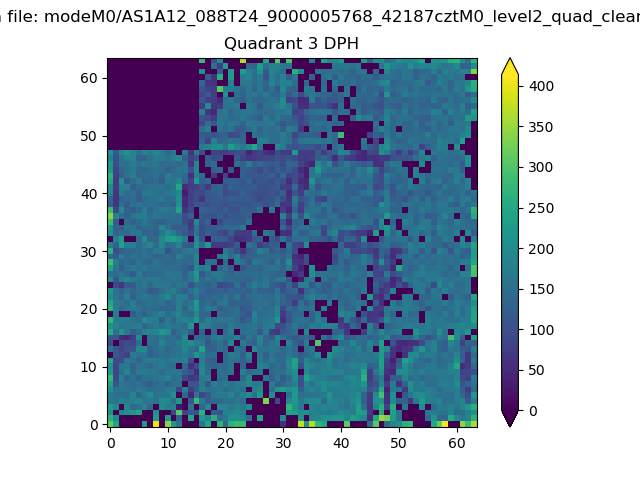 |
 |
Quadrant C |
| Plot type | Count rate plots | Images |
|---|---|---|
| Comparison with Poisson distribution Blue bars denote a histogram of data divided into 1 sec bins. Red curve is a Poisson curve with rate = median count rate of data. |
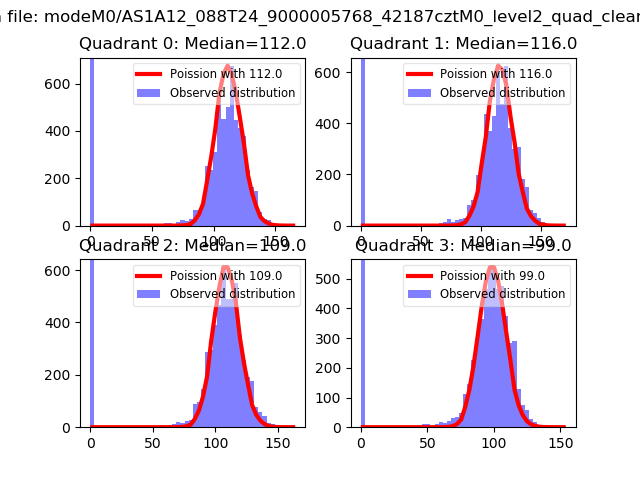 |
 |
| Quadrant-wise count rates Data is divided into 100 sec bins |
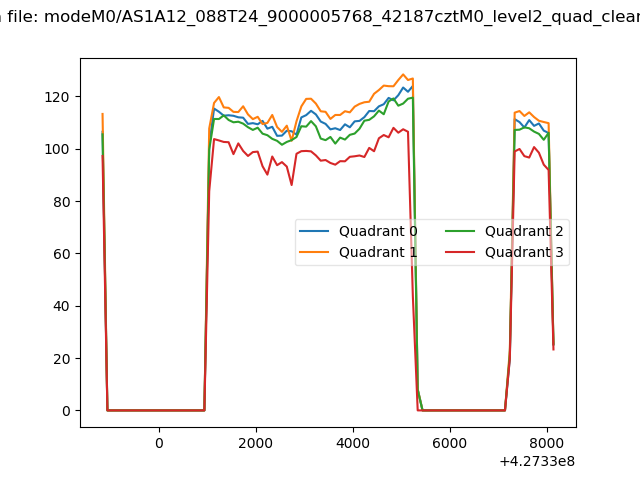 |
|
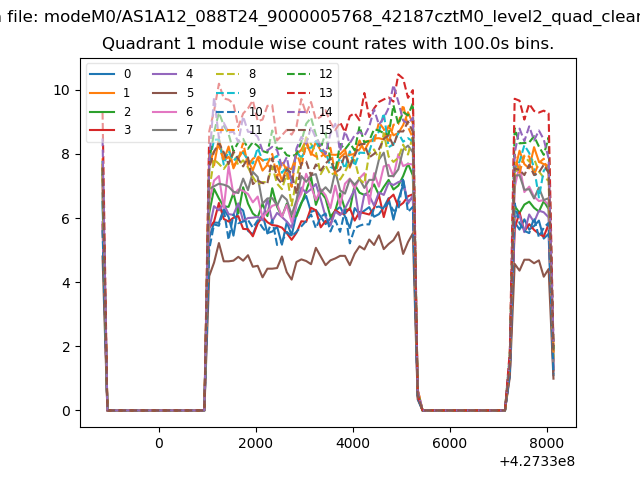
| Module-wise count rates for Quadrant A Data is divided into 100 sec bins |
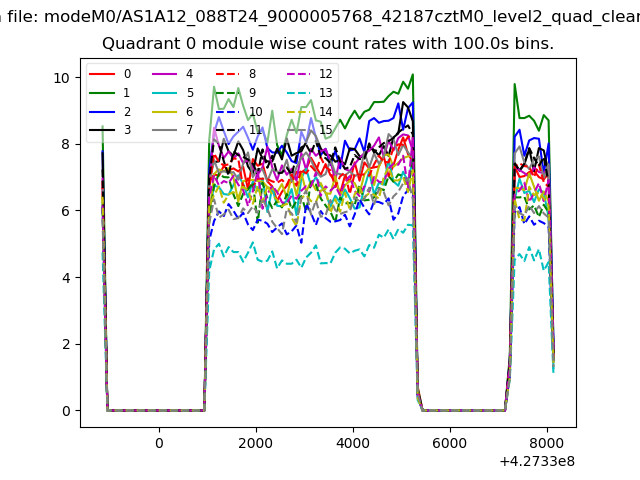 |
 |
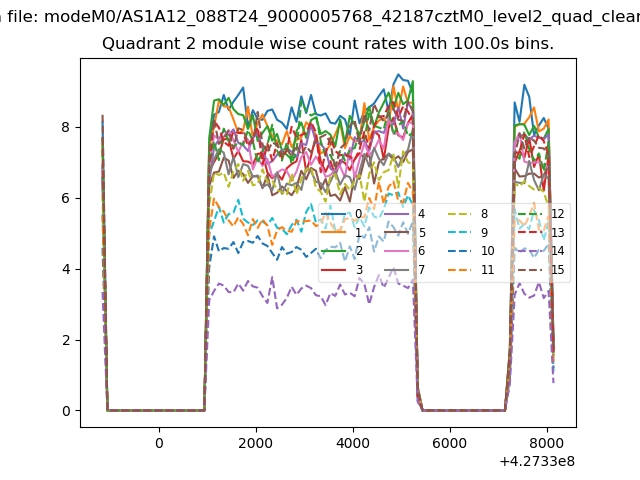
| Module-wise count rates for Quadrant B Data is divided into 100 sec bins |
 |
 |
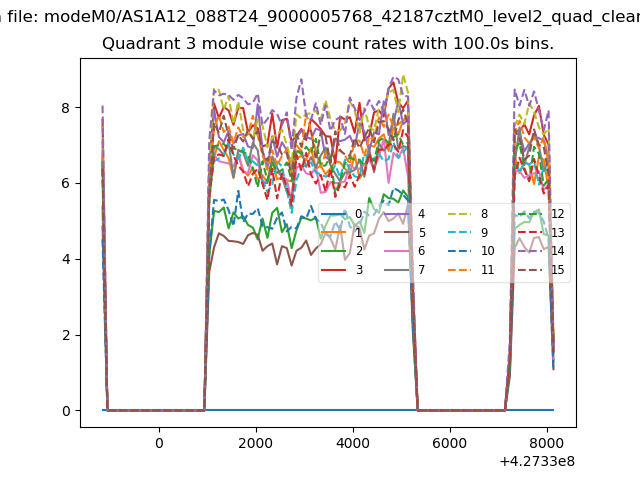
| Module-wise count rates for Quadrant C Data is divided into 100 sec bins |
 |
 |
| Module-wise count rates for Quadrant D Data is divided into 100 sec bins |
 |
 |
| Parameter | Plot |
|---|---|
| CZT HV Monitor | 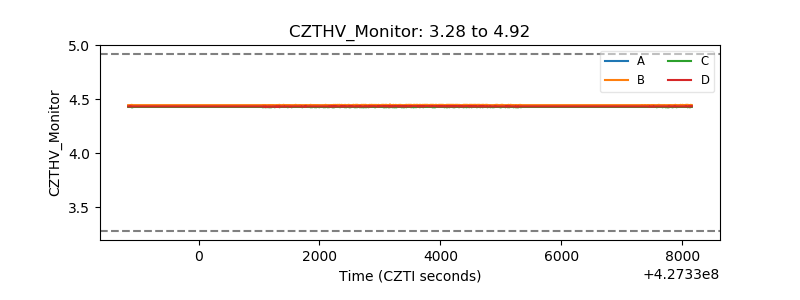 |
| D_VDD | 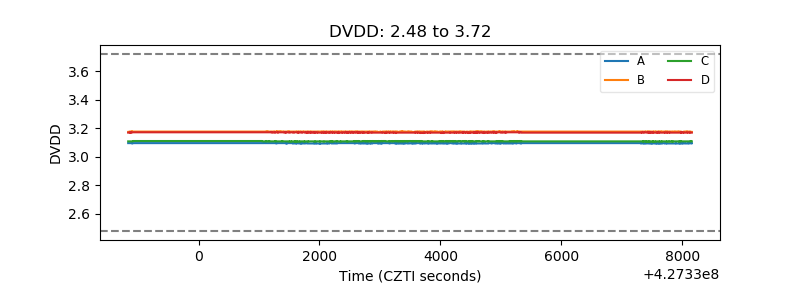 |
| Temperature 1 | 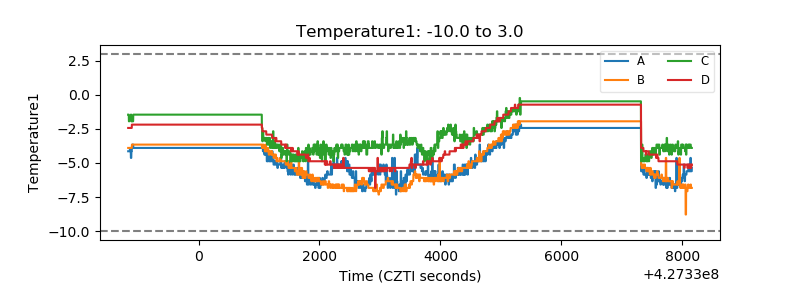 |
| Veto HV Monitor | 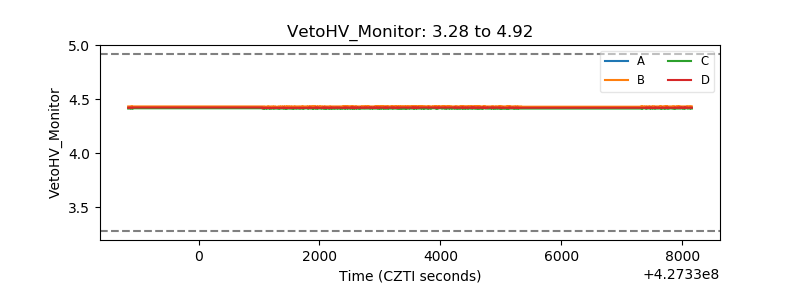 |
| Veto LLD | 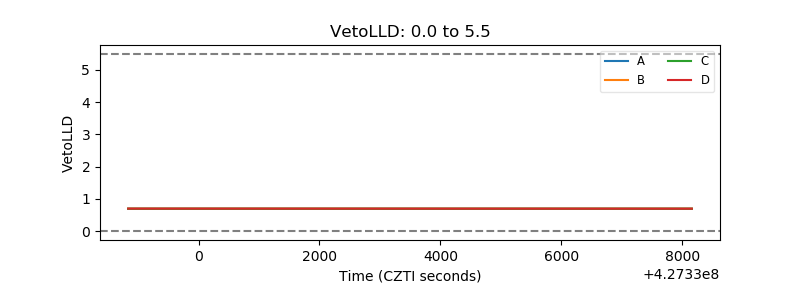 |
| Alpha Counter | 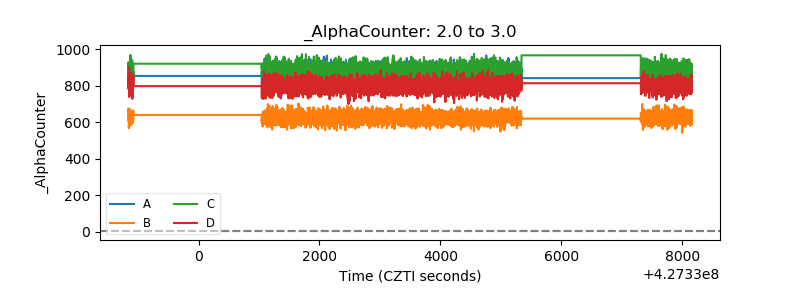 |
| _CPM_Rate | 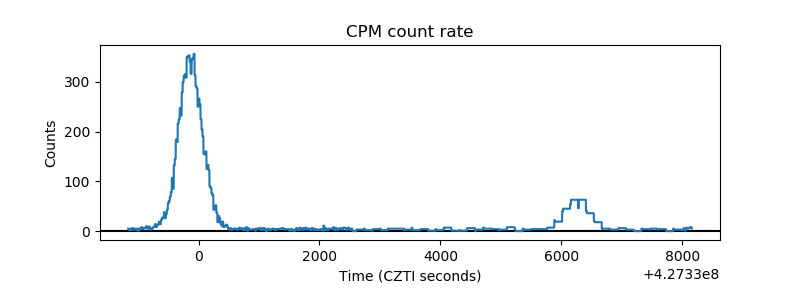 |
| CZT Counter | 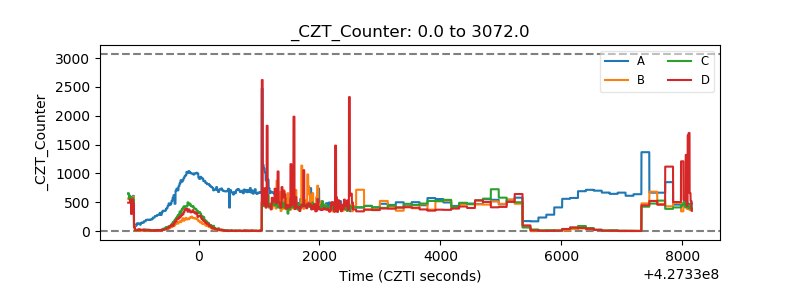 |
| +2.5 Volts monitor | 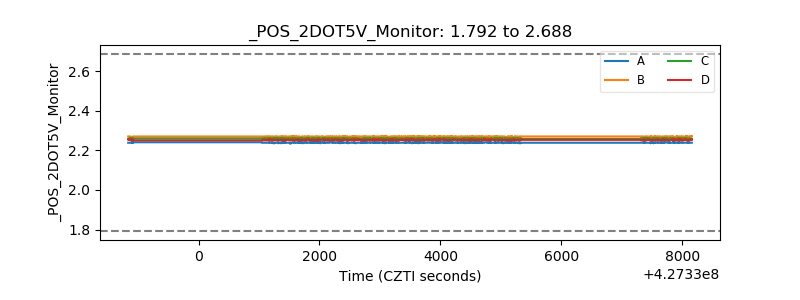 |
| +5 Volts monitor | 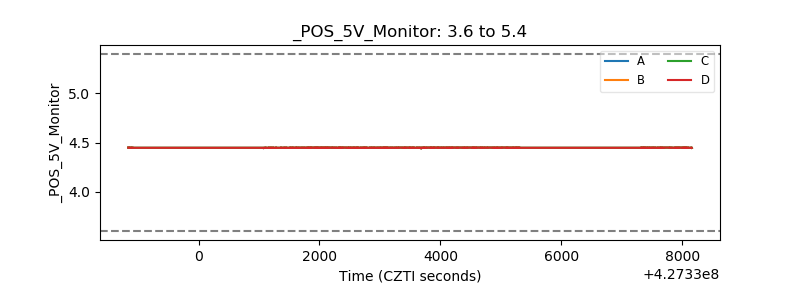 |
| _ROLL_ROT | 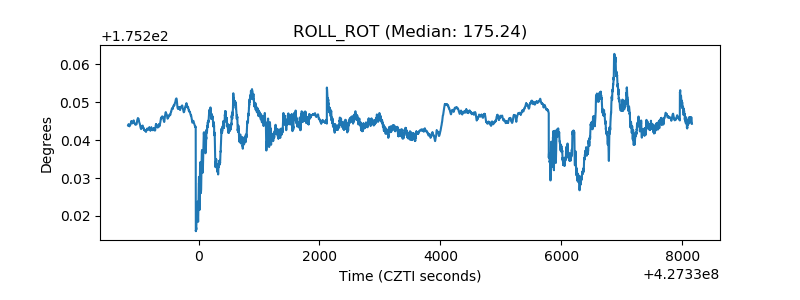 |
| _Roll_DEC | 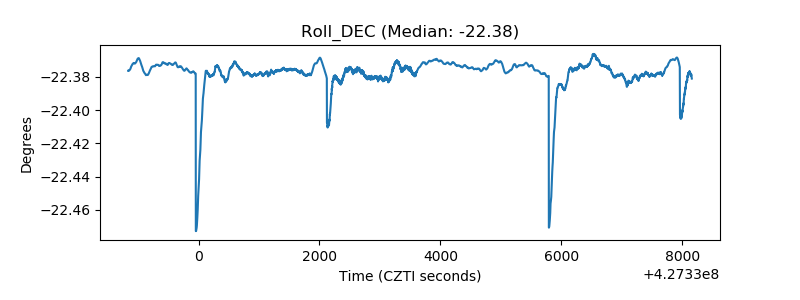 |
| _Roll_RA | 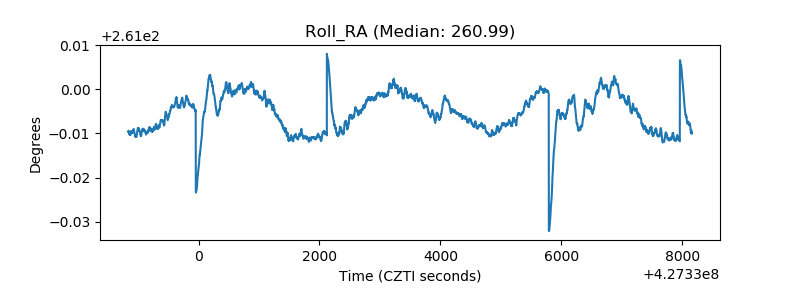 |
| Veto Counter | 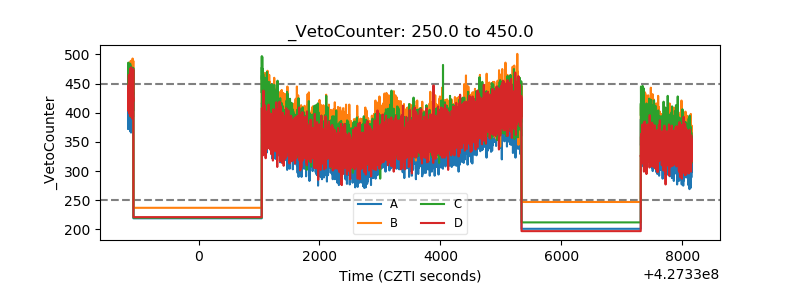 |