| Param | Original file | Final file |
|---|---|---|
| Filename | modeM0/AS1A12_088T24_9000005768_42189cztM0_level2.fits | modeM0/AS1A12_088T24_9000005768_42189cztM0_level2_quad_clean.evt |
| Size (bytes) | 249,575,040 | 70,496,640 |
| Size | 238.0 MB | 67.2 MB |
| Events in quadrant A | 2,431,497 | 467,814 |
| Events in quadrant B | 2,061,635 | 486,037 |
| Events in quadrant C | 2,010,353 | 456,903 |
| Events in quadrant D | 2,392,942 | 415,924 |
| Mode M0 | |||
|---|---|---|---|
| Quadrant | BADHDUFLAG | Total packets | Discarded packets |
| A | 0 | 9856 | 1 |
| B | 0 | 9189 | 1 |
| C | 0 | 8797 | 1 |
| D | 0 | 10380 | 1 |
| Mode M9 | |||
|---|---|---|---|
| Quadrant | BADHDUFLAG | Total packets | Discarded packets |
| A | 0 | 4 | 0 |
| B | 0 | 5 | 0 |
| C | 0 | 5 | 0 |
| D | 0 | 5 | 0 |
| Mode SS | |||
|---|---|---|---|
| Quadrant | BADHDUFLAG | Total packets | Discarded packets |
| A | 0 | 88 | 0 |
| B | 0 | 88 | 0 |
| C | 0 | 88 | 0 |
| D | 0 | 88 | 0 |
| Quadrant | Total seconds | Saturated seconds | Saturation percentage |
|---|---|---|---|
| A | 4377 | 45 | 1.028101% |
| B | 4377 | 13 | 0.297007% |
| C | 4377 | 2 | 0.045693% |
| D | 4377 | 105 | 2.398903% |
Noise dominated data is calculated using 1-second bins in cleaned event files. If a bin has >2000 counts, and if more than 50% of those come from <1% of pixels, then it is considered to be noise-dominated and hence unusable.
| Quadrant | # 1 sec bins | Bins with >0 counts | Bins with >2000 counts | High rate bins dominated by noise | Noise dominated (total time) | Noise dominated (detector-on time) | Marked lightcurve |
|---|---|---|---|---|---|---|---|
| A | 4377 | 4377 | 31 | 31 | 0.71% | 0.71% | 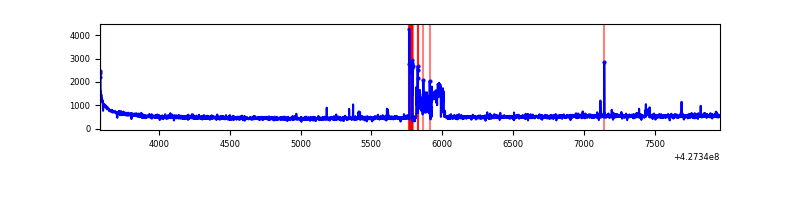 |
| B | 4377 | 4377 | 5 | 5 | 0.11% | 0.11% | 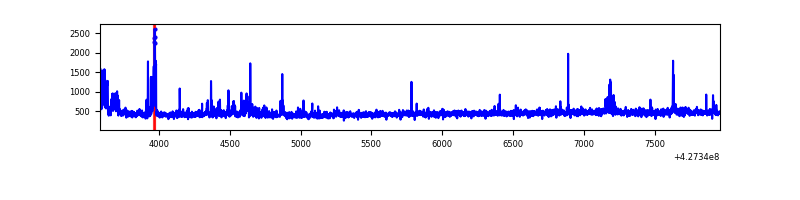 |
| C | 4377 | 4377 | 0 | 0 | 0.00% | 0.00% | 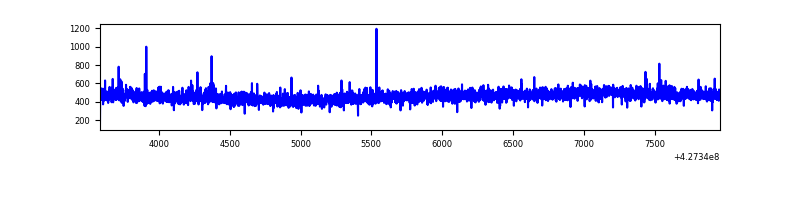 |
| D | 4377 | 4377 | 78 | 78 | 1.78% | 1.78% | 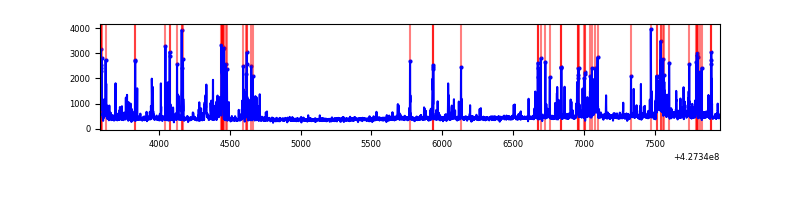 |
Top three noisy pixels from each quadrant. If the there are fewer than three noisy pixels in the level2.evt file, extra rows are filled as -1
| Pixel properties | Quadrant properties | ||||||
|---|---|---|---|---|---|---|---|
| Quadrant | DetID | PixID | Counts | Sigma | Mean | Median | Sigma |
| A | 10 | 83 | 370835 | 3759.75 | 473 | 463 | 98.5 |
| A | 15 | 223 | 220662 | 2235.3 | 473 | 463 | 98.5 |
| A | 13 | 248 | 7337 | 69.78 | 473 | 463 | 98.5 |
| B | 0 | 229 | 121432 | 1303.04 | 472 | 458 | 92.8 |
| B | 5 | 255 | 74335 | 795.75 | 472 | 458 | 92.8 |
| B | 12 | 111 | 11921 | 123.47 | 472 | 458 | 92.8 |
| C | 15 | 214 | 182806 | 1671.95 | 463 | 467 | 109.1 |
| C | 0 | 207 | 12265 | 108.18 | 463 | 467 | 109.1 |
| C | 5 | 254 | 5356 | 44.83 | 463 | 467 | 109.1 |
| D | 12 | 6 | 199504 | 1745.43 | 457 | 444 | 114.0 |
| D | 13 | 249 | 85912 | 749.42 | 457 | 444 | 114.0 |
| D | 12 | 233 | 69341 | 604.11 | 457 | 444 | 114.0 |
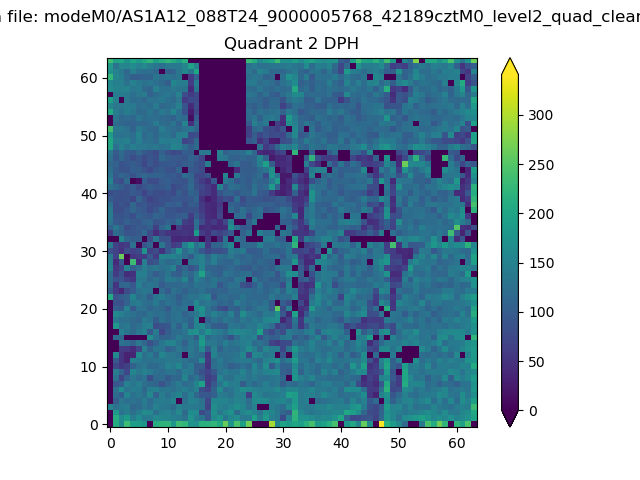
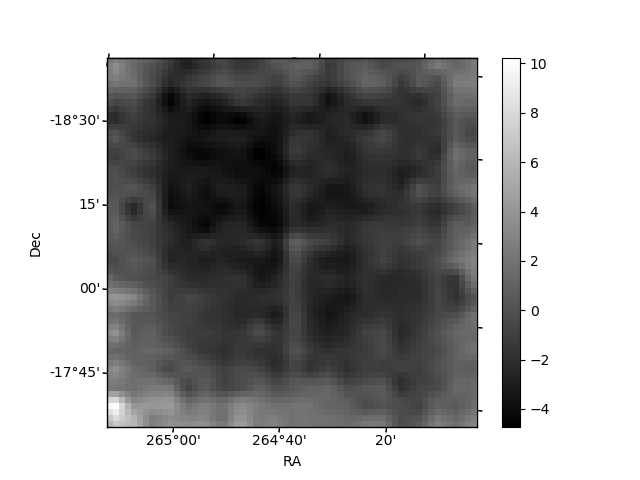
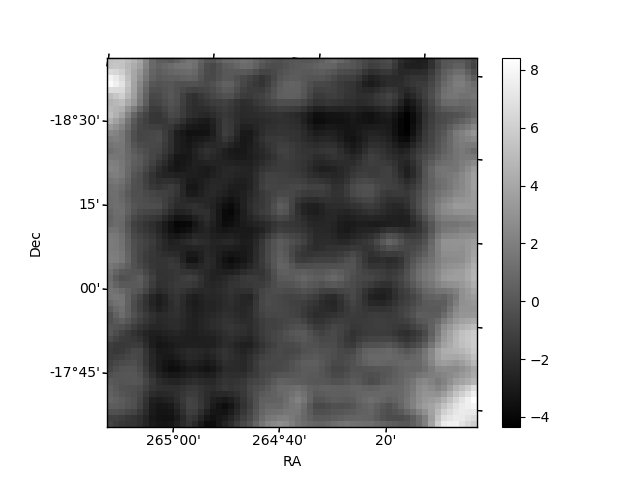
Histogram calculated using DETX and DETY for each event in the final _common_clean file
| Quadrant A | 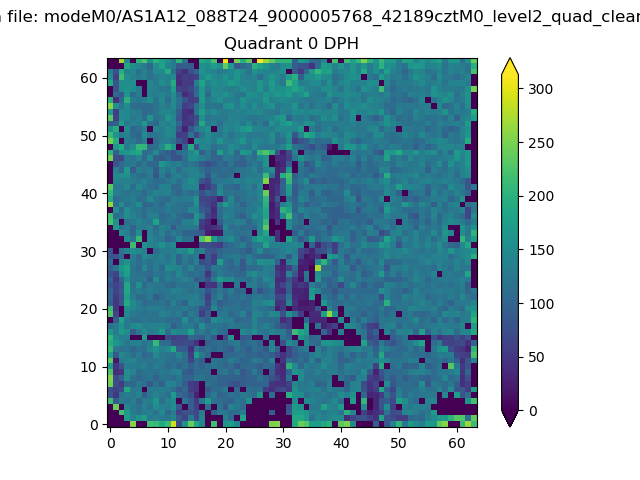 |
 |
Quadrant B |
|---|---|---|---|
| Quadrant D |  |
 |
Quadrant C |
| Plot type | Count rate plots | Images |
|---|---|---|
| Comparison with Poisson distribution Blue bars denote a histogram of data divided into 1 sec bins. Red curve is a Poisson curve with rate = median count rate of data. |
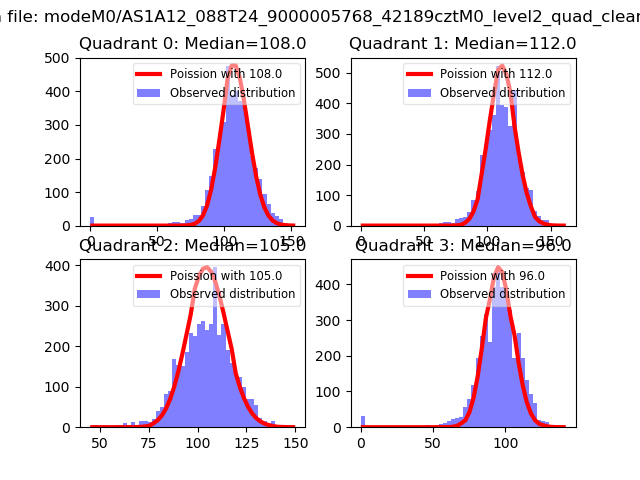 |
 |
| Quadrant-wise count rates Data is divided into 100 sec bins |
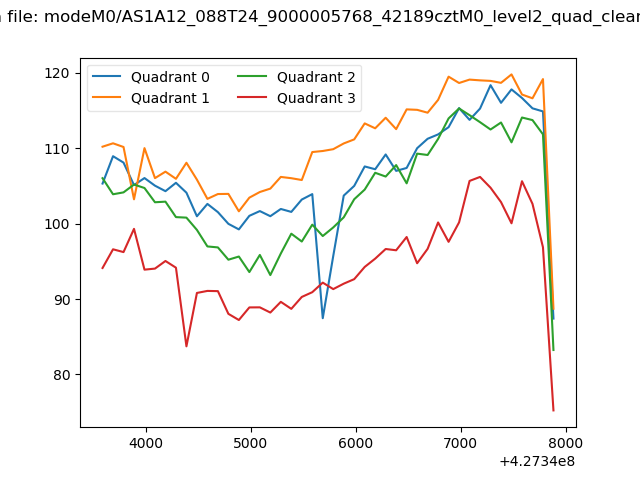 |
|
| Module-wise count rates for Quadrant A Data is divided into 100 sec bins |
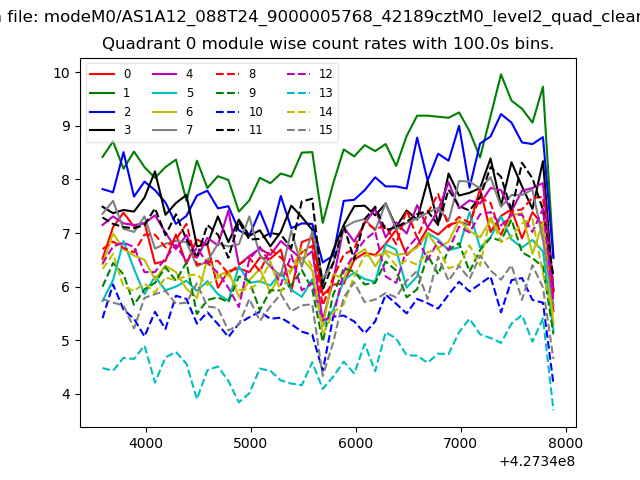 |
 |
| Module-wise count rates for Quadrant B Data is divided into 100 sec bins |
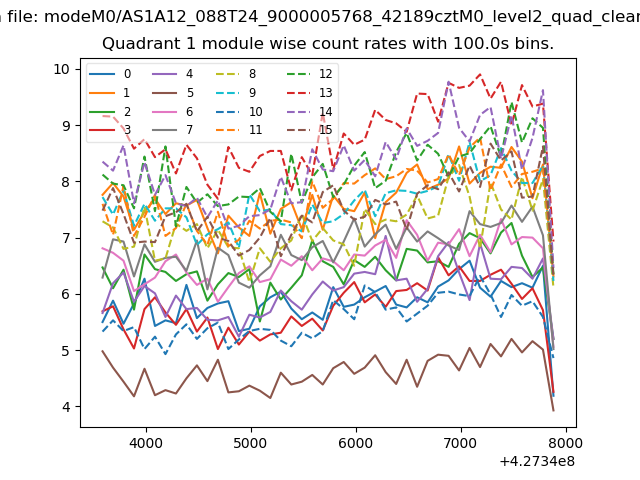 |
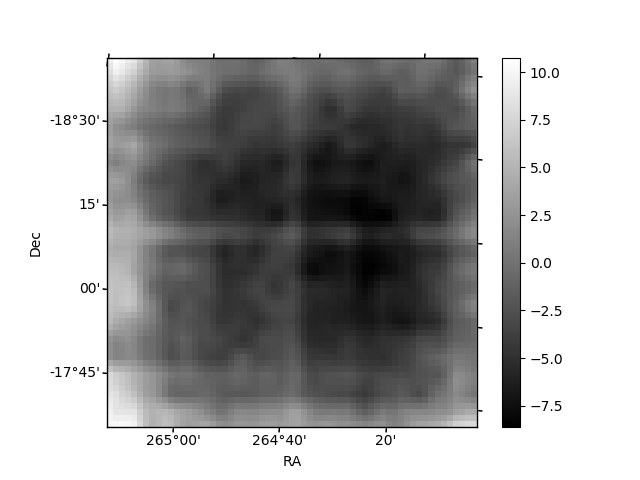 |
| Module-wise count rates for Quadrant C Data is divided into 100 sec bins |
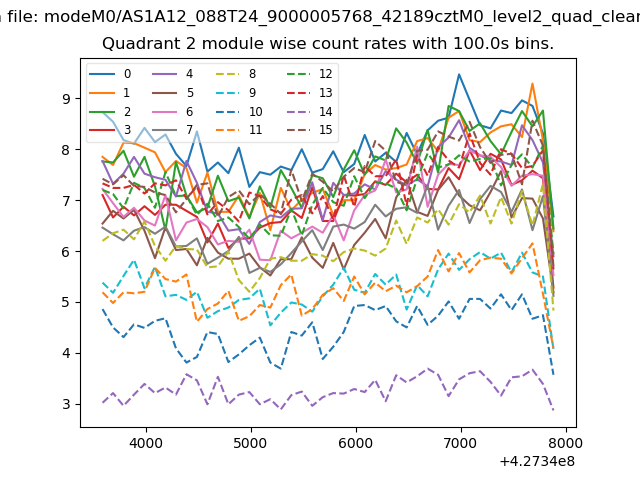 |
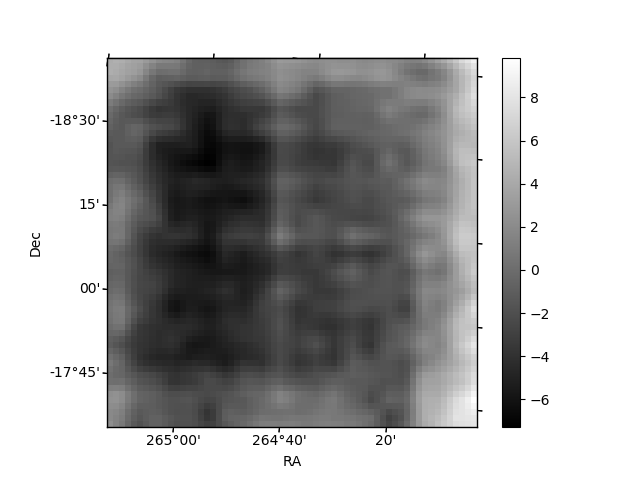 |
| Module-wise count rates for Quadrant D Data is divided into 100 sec bins |
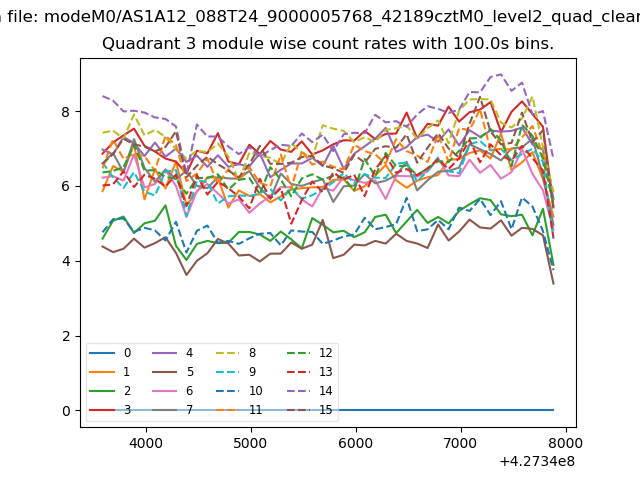 |
 |
| Parameter | Plot |
|---|---|
| CZT HV Monitor | 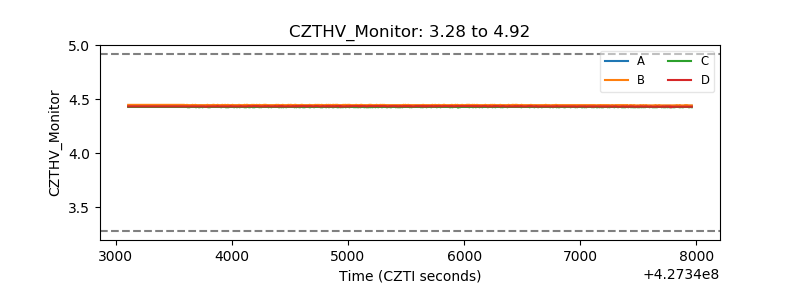 |
| D_VDD | 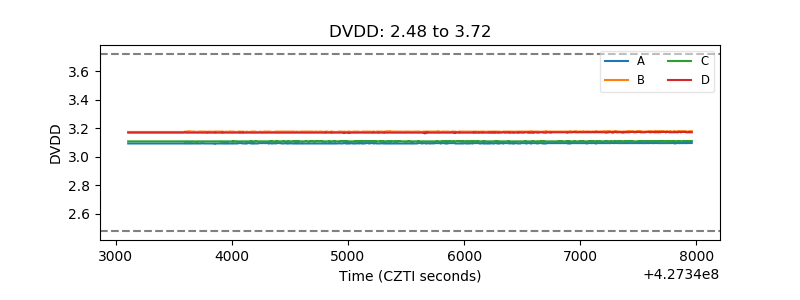 |
| Temperature 1 | 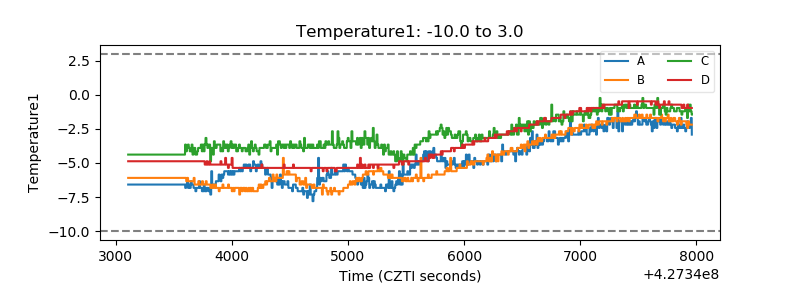 |
| Veto HV Monitor | 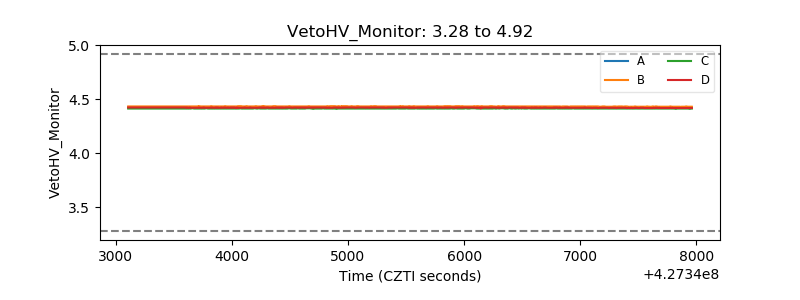 |
| Veto LLD | 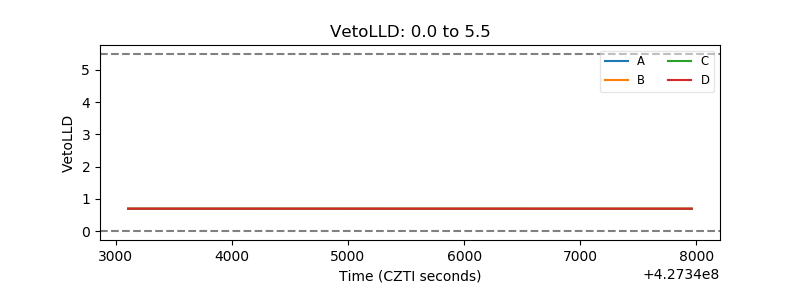 |
| Alpha Counter | 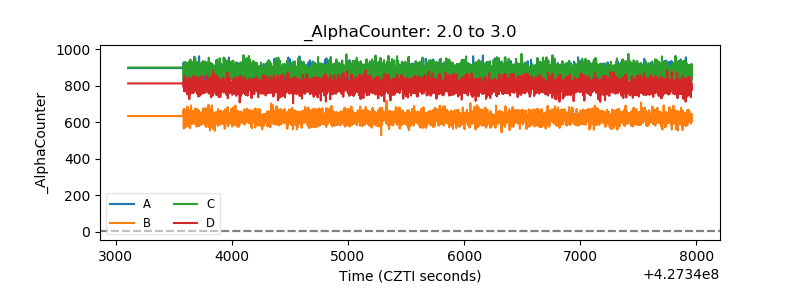 |
| _CPM_Rate | 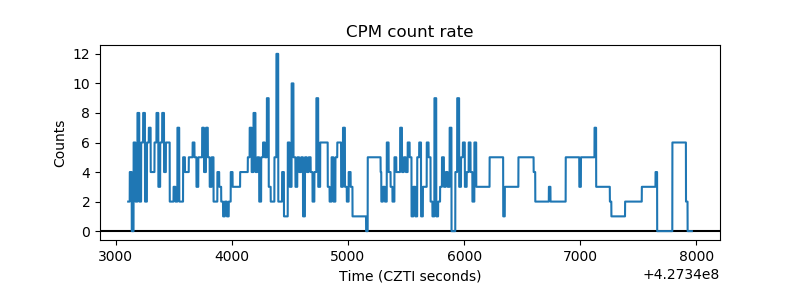 |
| CZT Counter | 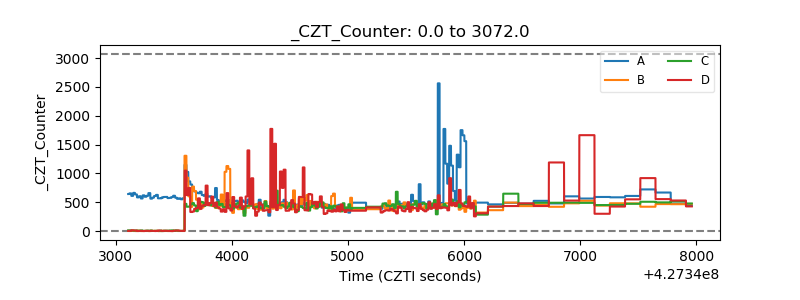 |
| +2.5 Volts monitor | 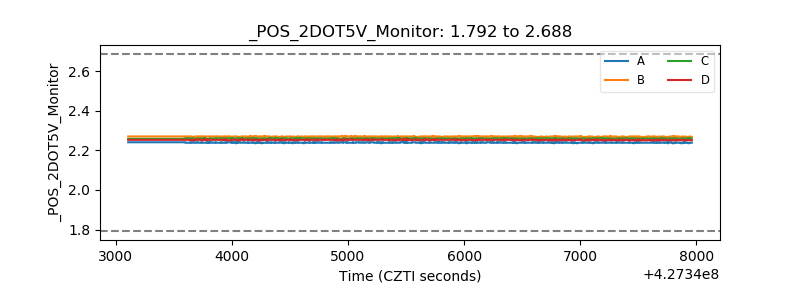 |
| +5 Volts monitor | 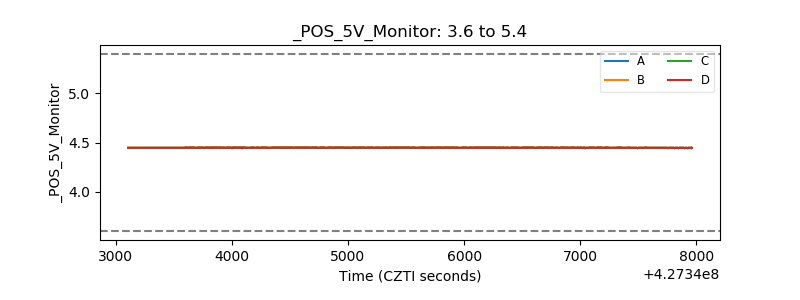 |
| _ROLL_ROT | 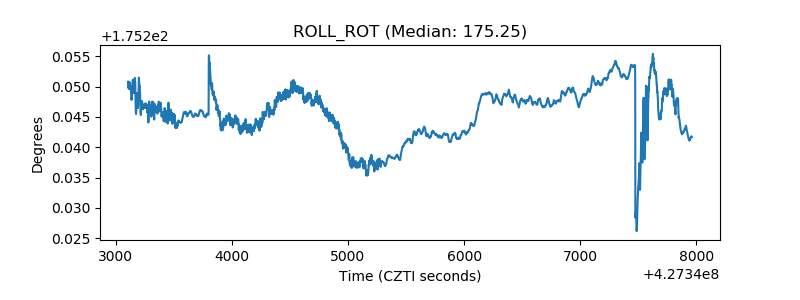 |
| _Roll_DEC | 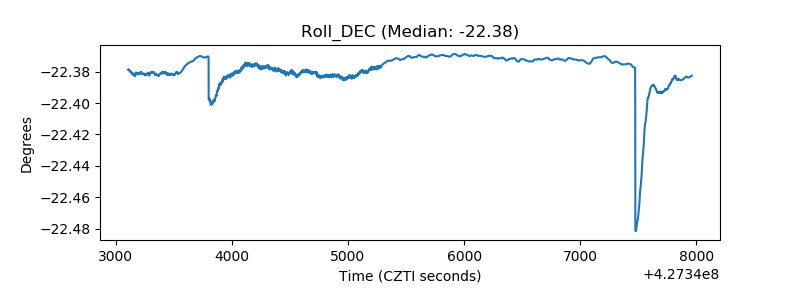 |
| _Roll_RA | 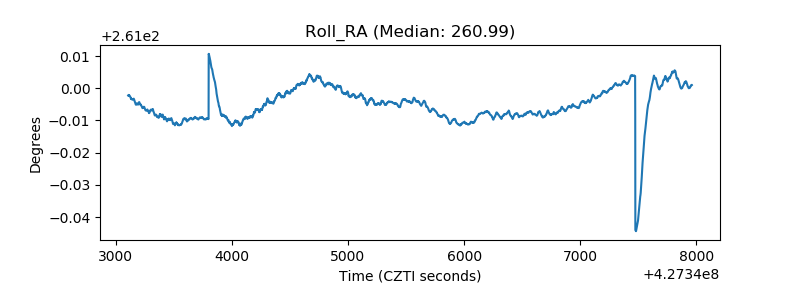 |
| Veto Counter | 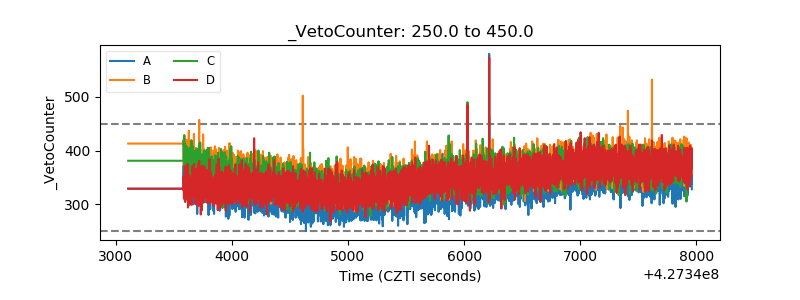 |