| Param | Original file | Final file |
|---|---|---|
| Filename | modeM0/AS1A12_088T25_9000005770_42189cztM0_level2.fits | modeM0/AS1A12_088T25_9000005770_42189cztM0_level2_quad_clean.evt |
| Size (bytes) | 54,348,480 | 14,883,840 |
| Size | 51.8 MB | 14.2 MB |
| Events in quadrant A | 542,493 | 97,435 |
| Events in quadrant B | 428,881 | 99,646 |
| Events in quadrant C | 417,375 | 95,469 |
| Events in quadrant D | 547,449 | 86,517 |
| Mode M0 | |||
|---|---|---|---|
| Quadrant | BADHDUFLAG | Total packets | Discarded packets |
| A | 0 | 2182 | 1 |
| B | 0 | 1933 | 1 |
| C | 0 | 1861 | 1 |
| D | 0 | 2329 | 1 |
| Mode M9 | |||
|---|---|---|---|
| Quadrant | BADHDUFLAG | Total packets | Discarded packets |
| A | 0 | 14 | 0 |
| B | 0 | 14 | 0 |
| C | 0 | 14 | 0 |
| D | 0 | 14 | 0 |
| Mode SS | |||
|---|---|---|---|
| Quadrant | BADHDUFLAG | Total packets | Discarded packets |
| A | 0 | 20 | 0 |
| B | 0 | 20 | 0 |
| C | 0 | 20 | 0 |
| D | 0 | 20 | 0 |
| Quadrant | Total seconds | Saturated seconds | Saturation percentage |
|---|---|---|---|
| A | 929 | 4 | 0.430571% |
| B | 929 | 1 | 0.107643% |
| C | 929 | 1 | 0.107643% |
| D | 929 | 22 | 2.368138% |
Noise dominated data is calculated using 1-second bins in cleaned event files. If a bin has >2000 counts, and if more than 50% of those come from <1% of pixels, then it is considered to be noise-dominated and hence unusable.
| Quadrant | # 1 sec bins | Bins with >0 counts | Bins with >2000 counts | High rate bins dominated by noise | Noise dominated (total time) | Noise dominated (detector-on time) | Marked lightcurve |
|---|---|---|---|---|---|---|---|
| A | 2332 | 930 | 2 | 2 | 0.09% | 0.22% | 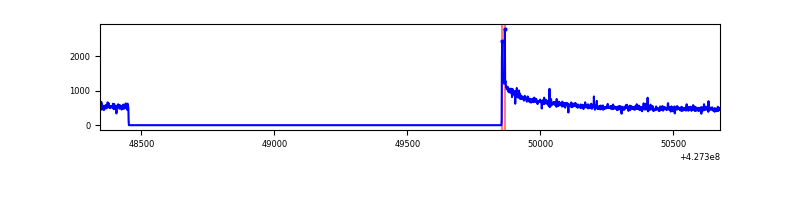 |
| B | 2332 | 930 | 0 | 0 | 0.00% | 0.00% | 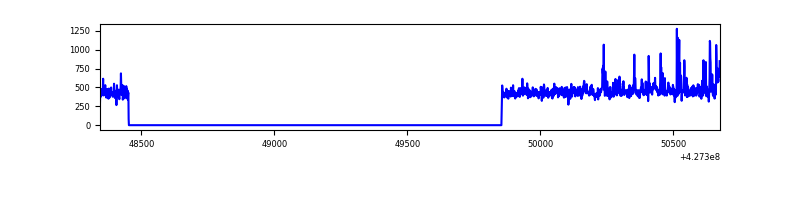 |
| C | 2332 | 930 | 0 | 0 | 0.00% | 0.00% | 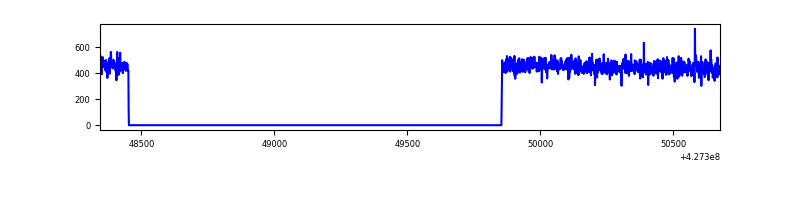 |
| D | 2332 | 930 | 24 | 24 | 1.03% | 2.58% | 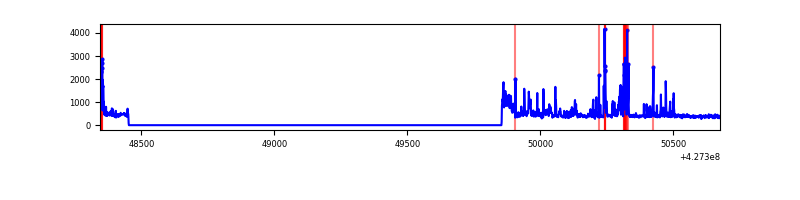 |
Top three noisy pixels from each quadrant. If the there are fewer than three noisy pixels in the level2.evt file, extra rows are filled as -1
| Pixel properties | Quadrant properties | ||||||
|---|---|---|---|---|---|---|---|
| Quadrant | DetID | PixID | Counts | Sigma | Mean | Median | Sigma |
| A | 10 | 83 | 160208 | 7340.76 | 96 | 94 | 21.8 |
| A | 2 | 247 | 2825 | 125.21 | 96 | 94 | 21.8 |
| A | 13 | 6 | 2796 | 123.88 | 96 | 94 | 21.8 |
| B | 5 | 255 | 35179 | 1653.02 | 97 | 95 | 21.2 |
| B | 0 | 229 | 6612 | 307.06 | 97 | 95 | 21.2 |
| B | 12 | 111 | 2553 | 115.81 | 97 | 95 | 21.2 |
| C | 15 | 214 | 43915 | 1811.16 | 95 | 95 | 24.2 |
| C | 0 | 207 | 925 | 34.31 | 95 | 95 | 24.2 |
| C | 13 | 61 | 644 | 22.69 | 95 | 95 | 24.2 |
| D | 12 | 6 | 86034 | 3440.85 | 92 | 88 | 25.0 |
| D | 1 | 52 | 59263 | 2369.07 | 92 | 88 | 25.0 |
| D | 1 | 47 | 23920 | 954.11 | 92 | 88 | 25.0 |
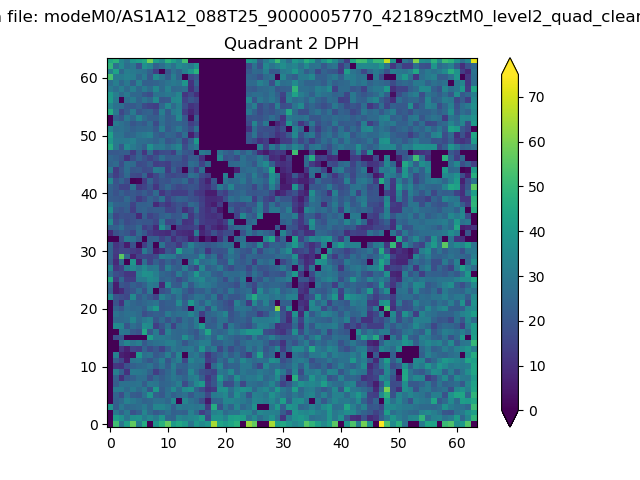
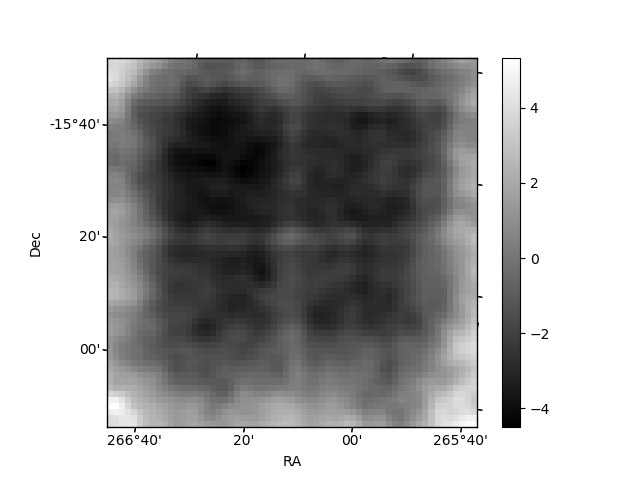
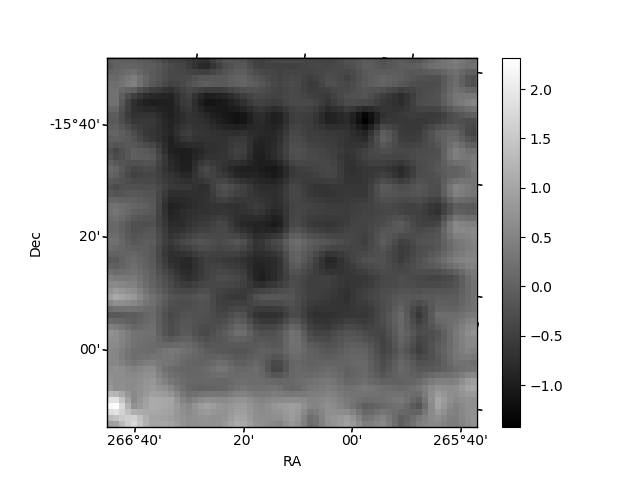
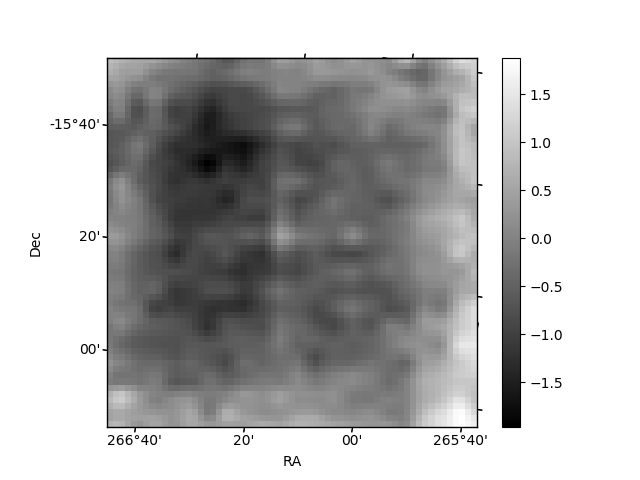
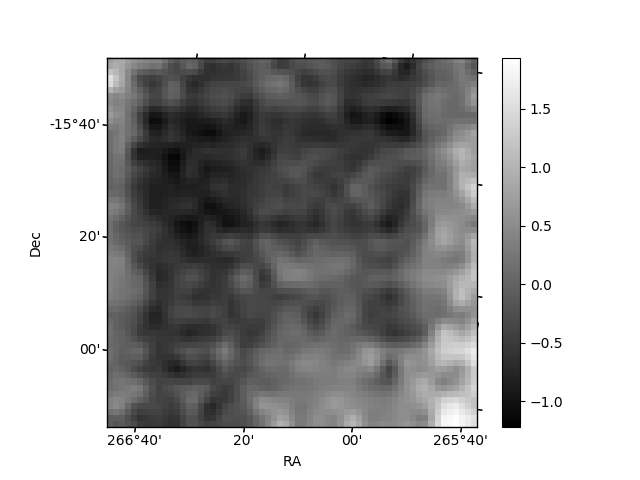
Histogram calculated using DETX and DETY for each event in the final _common_clean file
| Quadrant A | 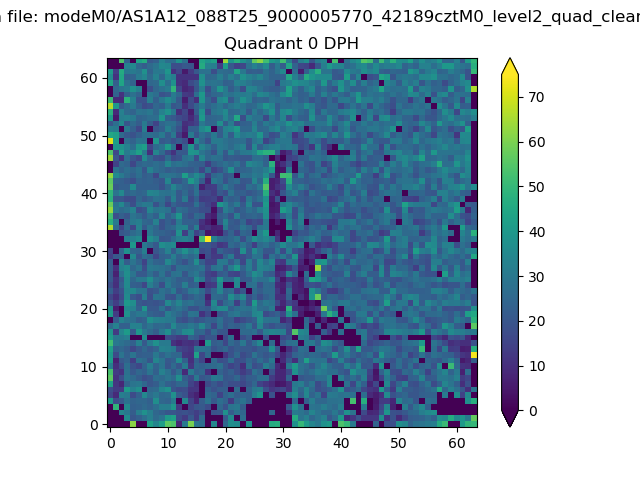 |
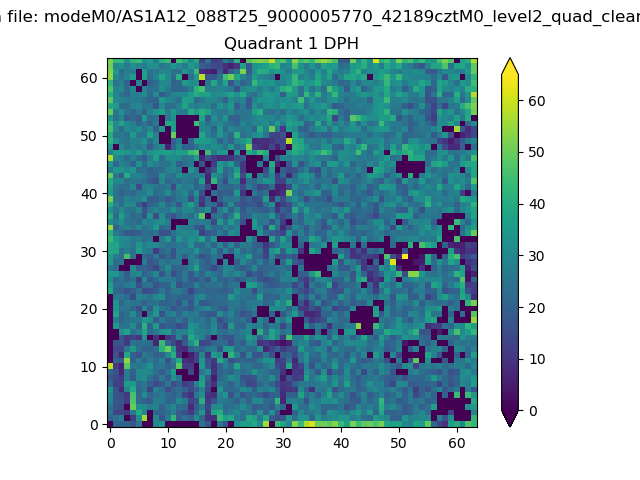 |
Quadrant B |
|---|---|---|---|
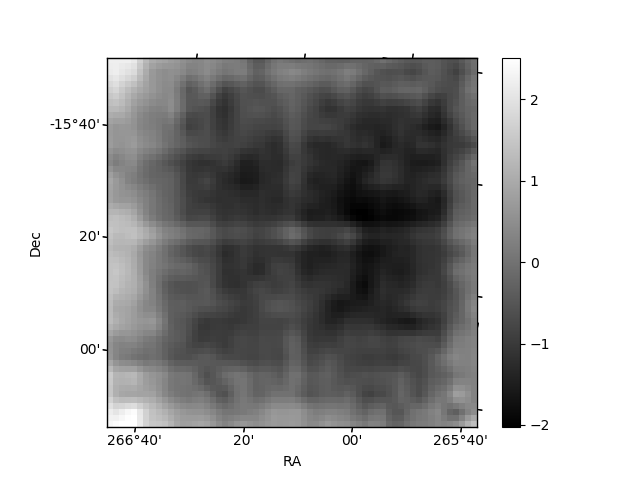
| Quadrant D | 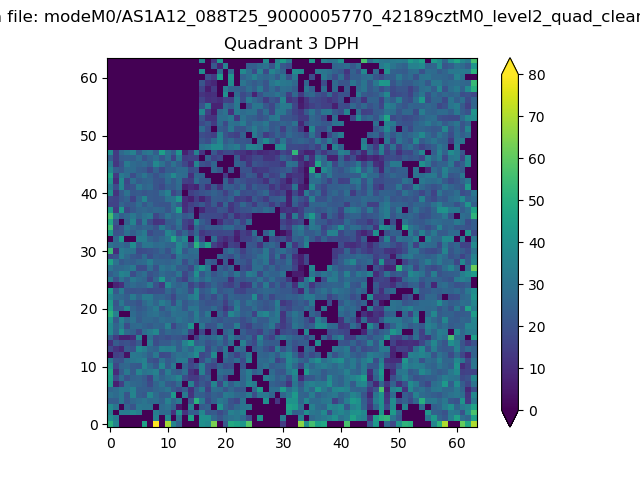 |
 |
Quadrant C |
| Plot type | Count rate plots | Images |
|---|---|---|
| Comparison with Poisson distribution Blue bars denote a histogram of data divided into 1 sec bins. Red curve is a Poisson curve with rate = median count rate of data. |
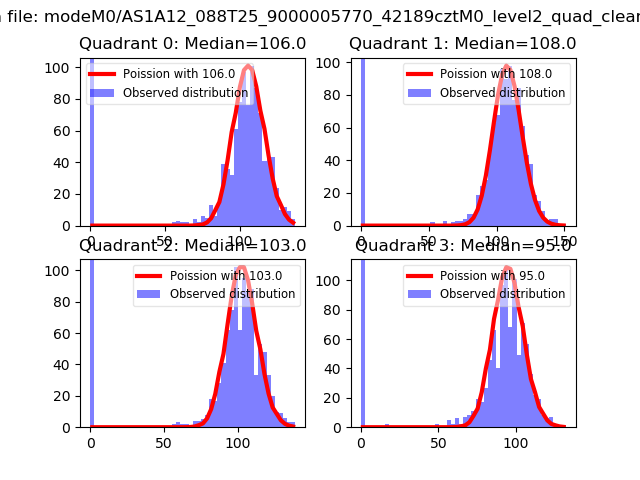 |
 |
| Quadrant-wise count rates Data is divided into 100 sec bins |
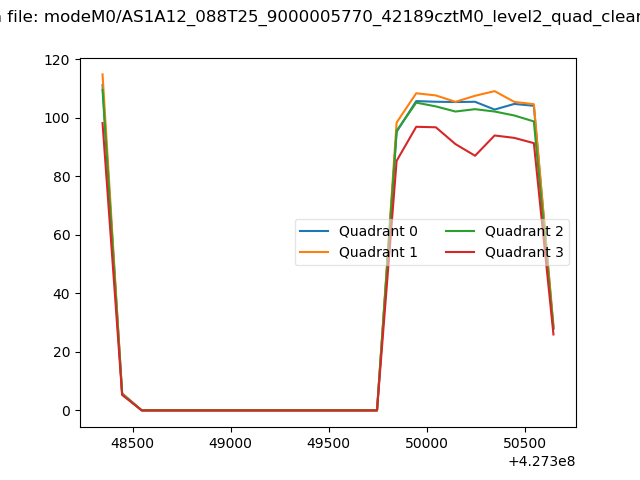 |
|
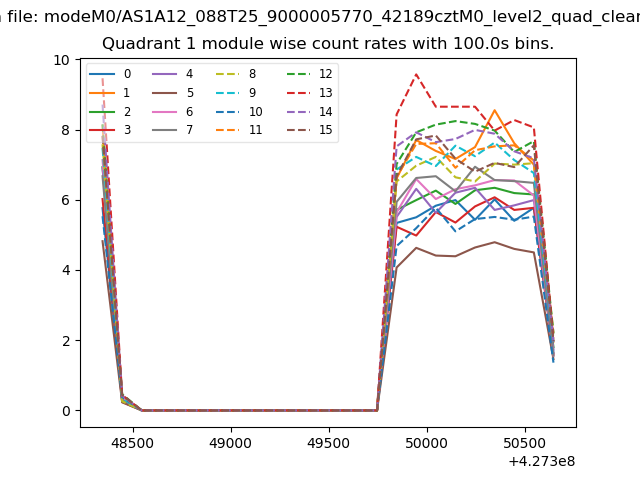
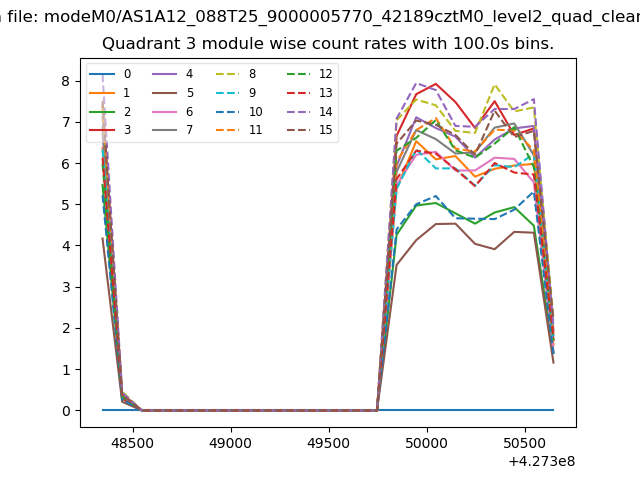
| Module-wise count rates for Quadrant A Data is divided into 100 sec bins |
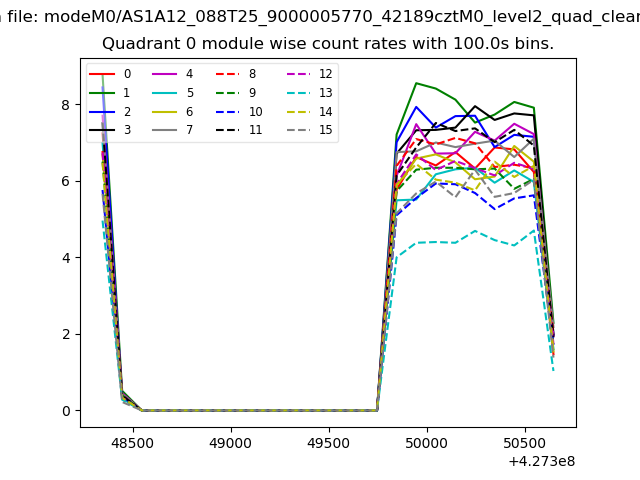 |
 |
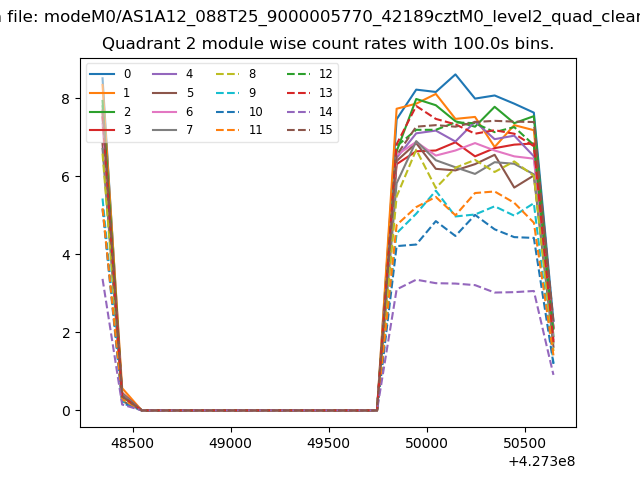
| Module-wise count rates for Quadrant B Data is divided into 100 sec bins |
 |
 |
| Module-wise count rates for Quadrant C Data is divided into 100 sec bins |
 |
 |
| Module-wise count rates for Quadrant D Data is divided into 100 sec bins |
 |
 |
| Parameter | Plot |
|---|---|
| CZT HV Monitor | 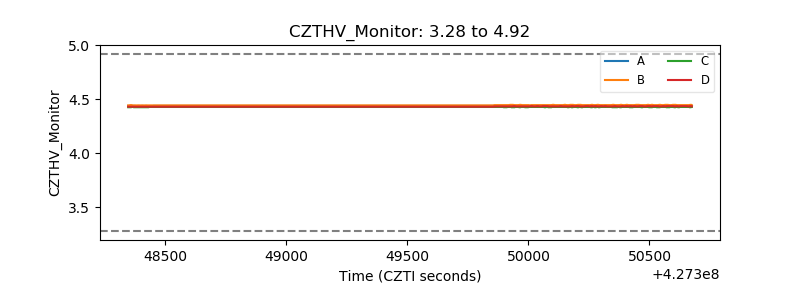 |
| D_VDD | 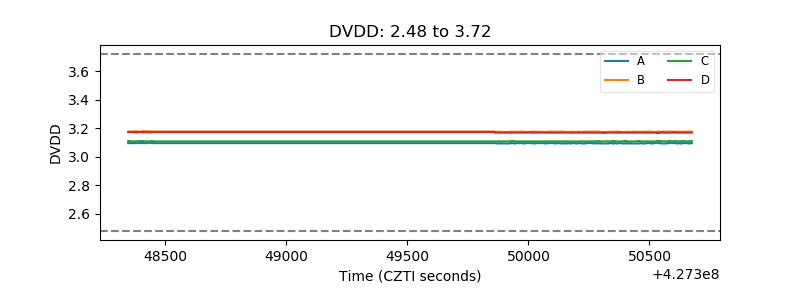 |
| Temperature 1 | 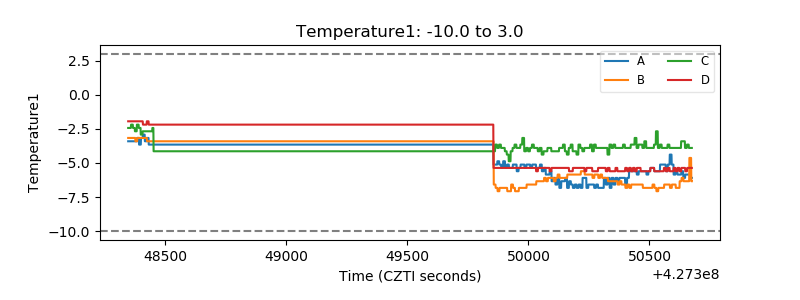 |
| Veto HV Monitor | 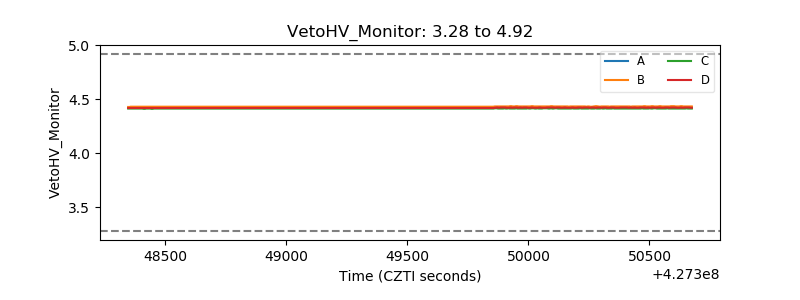 |
| Veto LLD | 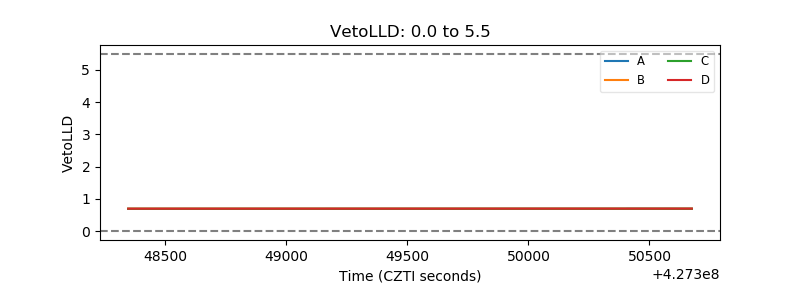 |
| Alpha Counter | 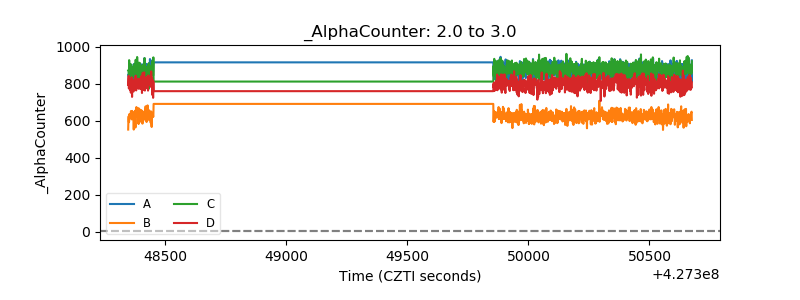 |
| _CPM_Rate | 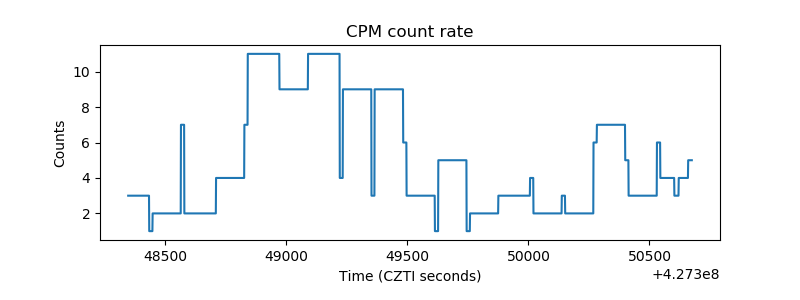 |
| CZT Counter | 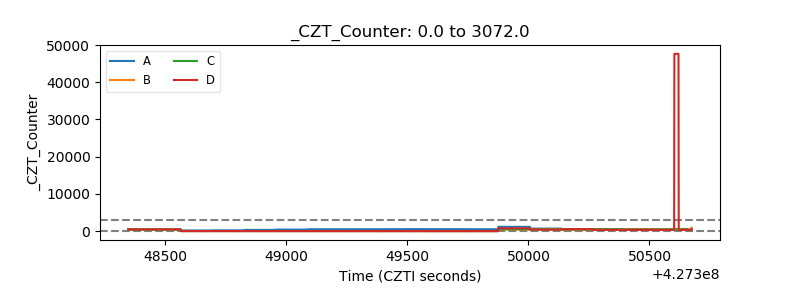 |
| +2.5 Volts monitor | 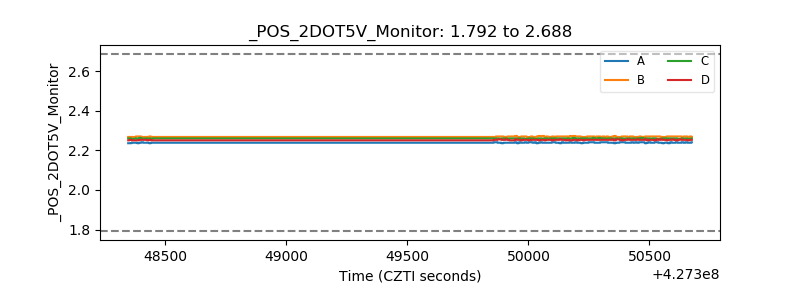 |
| +5 Volts monitor | 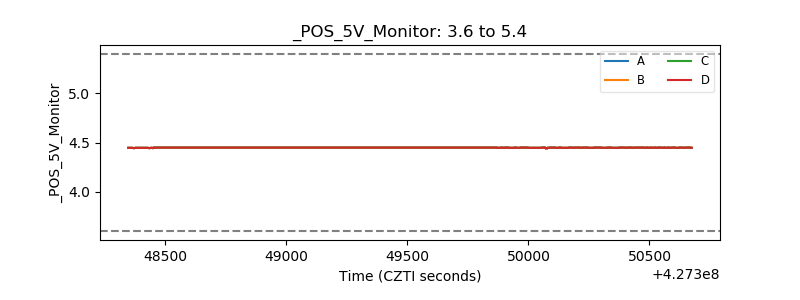 |
| _ROLL_ROT | 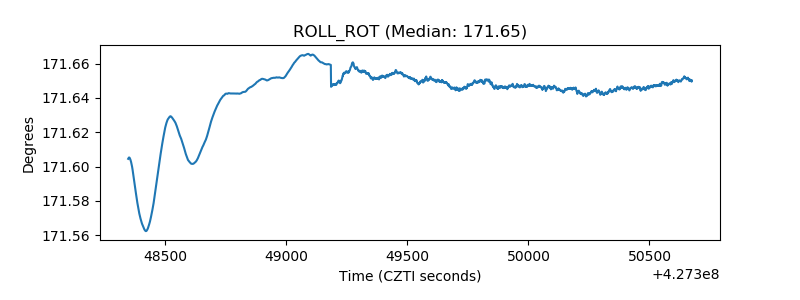 |
| _Roll_DEC | 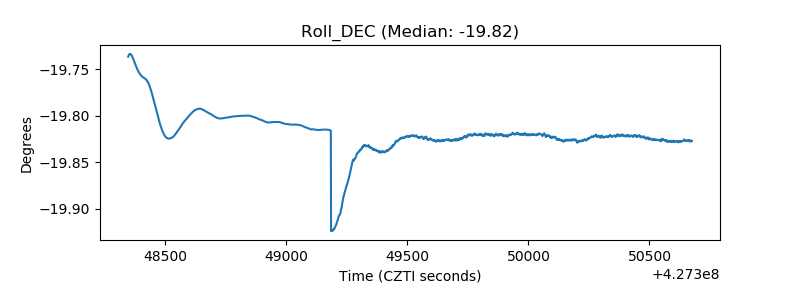 |
| _Roll_RA |  |
| Veto Counter | 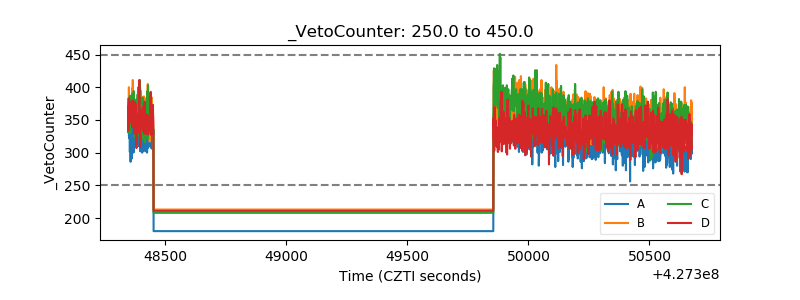 |