| Param | Original file | Final file |
|---|---|---|
| Filename | modeM0/AS1A12_088T25_9000005770_42190cztM0_level2.fits | modeM0/AS1A12_088T25_9000005770_42190cztM0_level2_quad_clean.evt |
| Size (bytes) | 355,795,200 | 95,927,040 |
| Size | 339.3 MB | 91.5 MB |
| Events in quadrant A | 3,334,293 | 639,379 |
| Events in quadrant B | 3,380,115 | 653,785 |
| Events in quadrant C | 2,755,935 | 625,720 |
| Events in quadrant D | 3,233,687 | 566,553 |
| Mode M0 | |||
|---|---|---|---|
| Quadrant | BADHDUFLAG | Total packets | Discarded packets |
| A | 0 | 13528 | 2 |
| B | 0 | 14116 | 2 |
| C | 0 | 12046 | 2 |
| D | 0 | 14068 | 2 |
| Mode M9 | |||
|---|---|---|---|
| Quadrant | BADHDUFLAG | Total packets | Discarded packets |
| A | 0 | 26 | 0 |
| B | 0 | 26 | 0 |
| C | 0 | 26 | 0 |
| D | 0 | 26 | 0 |
| Mode SS | |||
|---|---|---|---|
| Quadrant | BADHDUFLAG | Total packets | Discarded packets |
| A | 0 | 126 | 0 |
| B | 0 | 126 | 0 |
| C | 0 | 126 | 0 |
| D | 0 | 126 | 0 |
| Quadrant | Total seconds | Saturated seconds | Saturation percentage |
|---|---|---|---|
| A | 5992 | 32 | 0.534045% |
| B | 5992 | 114 | 1.902537% |
| C | 5992 | 5 | 0.083445% |
| D | 5991 | 110 | 1.836087% |
Noise dominated data is calculated using 1-second bins in cleaned event files. If a bin has >2000 counts, and if more than 50% of those come from <1% of pixels, then it is considered to be noise-dominated and hence unusable.
| Quadrant | # 1 sec bins | Bins with >0 counts | Bins with >2000 counts | High rate bins dominated by noise | Noise dominated (total time) | Noise dominated (detector-on time) | Marked lightcurve |
|---|---|---|---|---|---|---|---|
| A | 8679 | 5994 | 18 | 18 | 0.21% | 0.30% | 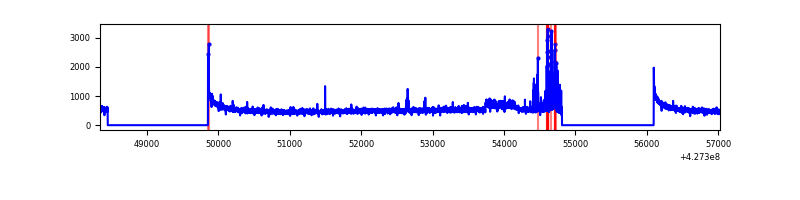 |
| B | 8679 | 5994 | 80 | 80 | 0.92% | 1.33% | 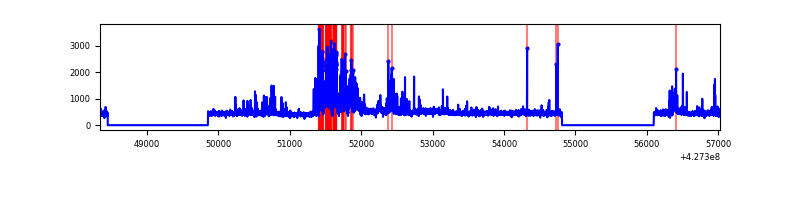 |
| C | 8679 | 5994 | 0 | 0 | 0.00% | 0.00% | 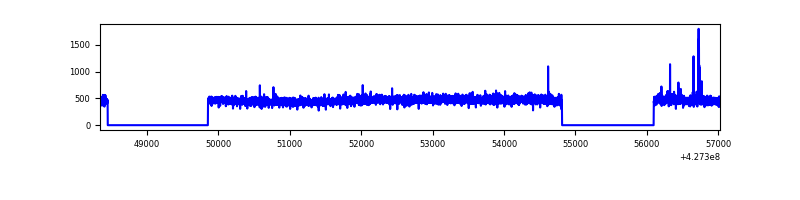 |
| D | 8678 | 5993 | 107 | 107 | 1.23% | 1.79% | 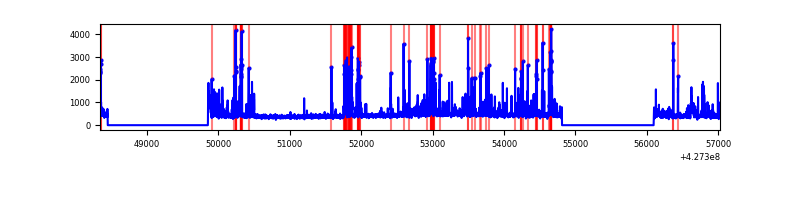 |
Top three noisy pixels from each quadrant. If the there are fewer than three noisy pixels in the level2.evt file, extra rows are filled as -1
| Pixel properties | Quadrant properties | ||||||
|---|---|---|---|---|---|---|---|
| Quadrant | DetID | PixID | Counts | Sigma | Mean | Median | Sigma |
| A | 10 | 83 | 587898 | 4372.87 | 651 | 636 | 134.3 |
| A | 13 | 248 | 127736 | 946.41 | 651 | 636 | 134.3 |
| A | 15 | 223 | 83464 | 616.75 | 651 | 636 | 134.3 |
| B | 5 | 255 | 733022 | 5781.45 | 645 | 628 | 126.7 |
| B | 0 | 156 | 50412 | 392.99 | 645 | 628 | 126.7 |
| B | 0 | 229 | 41523 | 322.82 | 645 | 628 | 126.7 |
| C | 15 | 214 | 253287 | 1699.33 | 634 | 637 | 148.7 |
| C | 15 | 159 | 17034 | 110.28 | 634 | 637 | 148.7 |
| C | 0 | 207 | 6735 | 41.01 | 634 | 637 | 148.7 |
| D | 1 | 52 | 278039 | 1809.12 | 625 | 606 | 153.4 |
| D | 12 | 6 | 234097 | 1522.58 | 625 | 606 | 153.4 |
| D | 7 | 55 | 77483 | 501.31 | 625 | 606 | 153.4 |
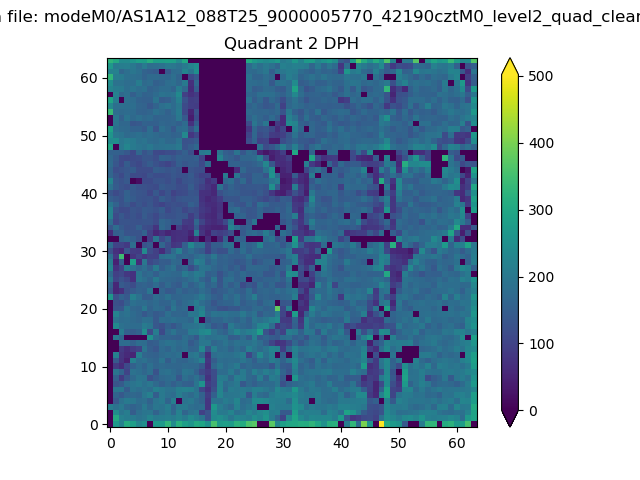
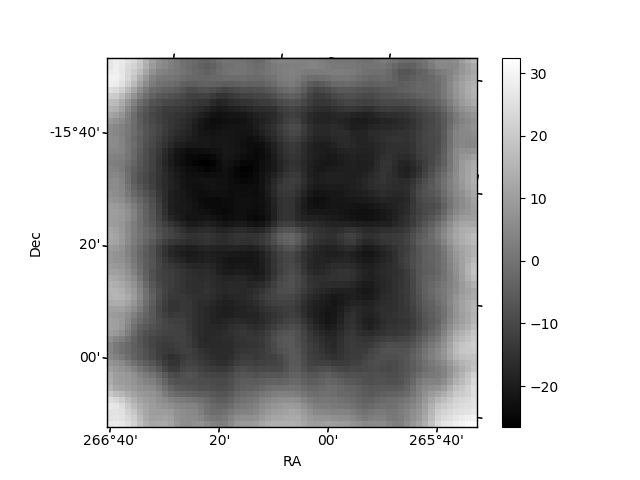
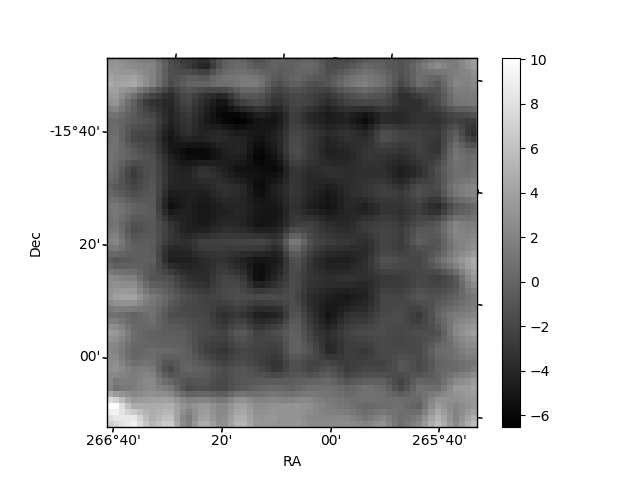
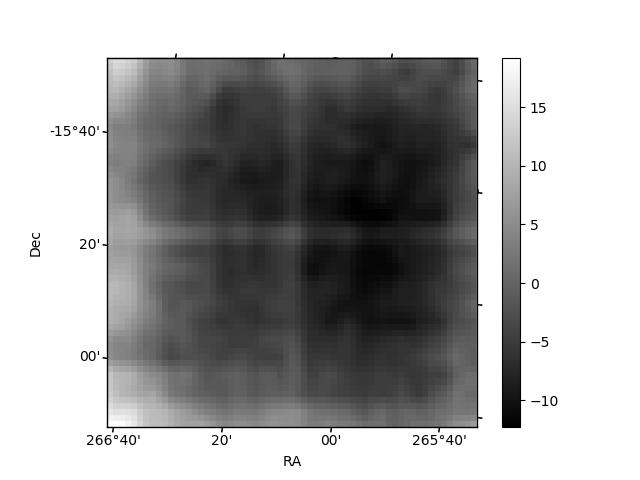
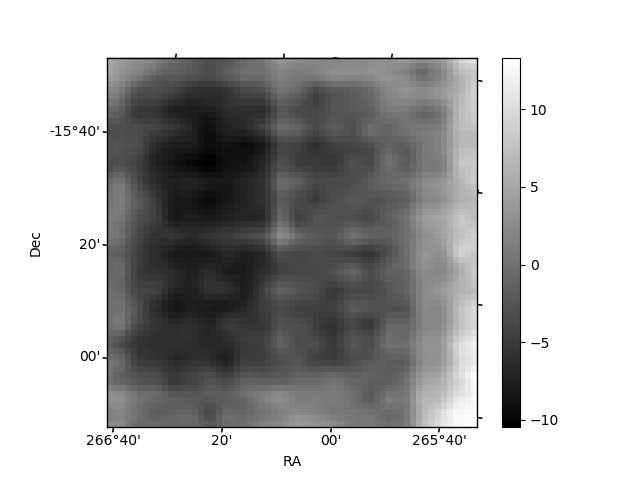
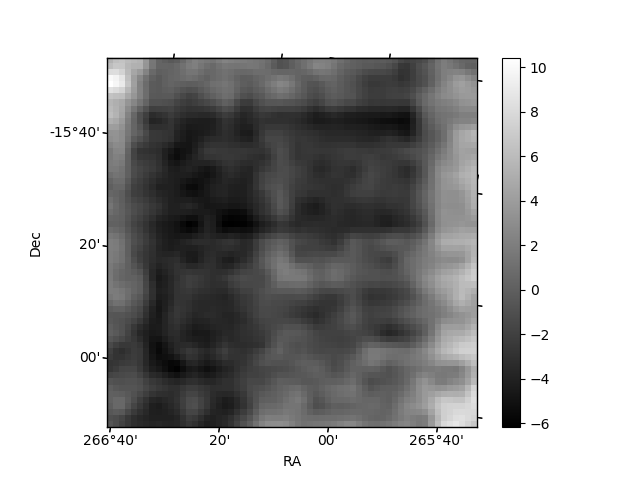
Histogram calculated using DETX and DETY for each event in the final _common_clean file
| Quadrant A | 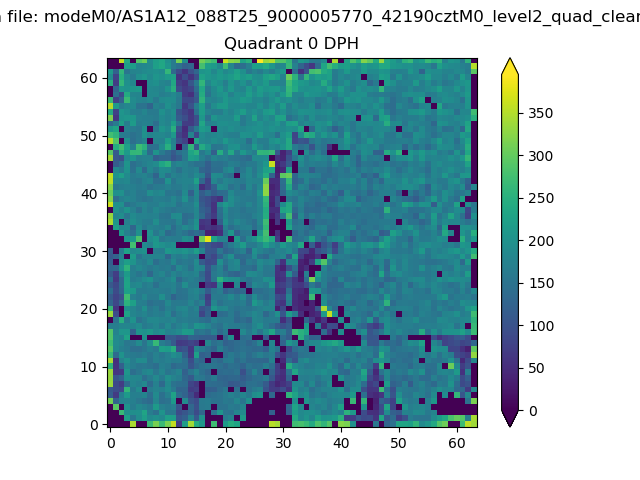 |
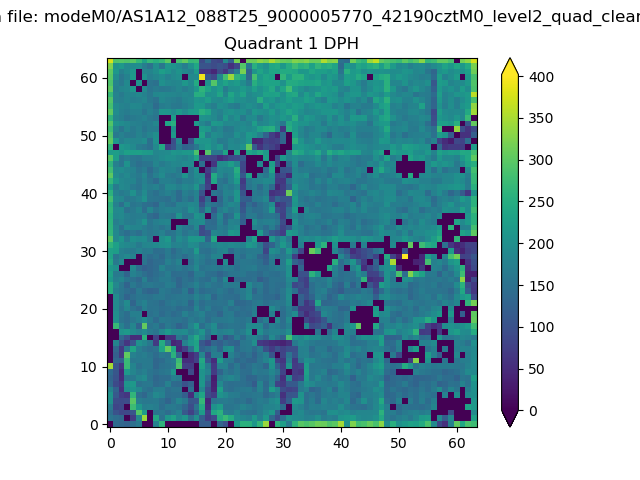 |
Quadrant B |
|---|---|---|---|
| Quadrant D | 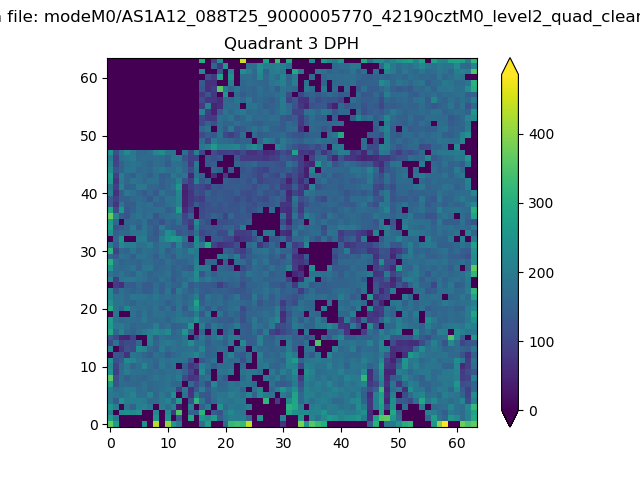 |
 |
Quadrant C |
| Plot type | Count rate plots | Images |
|---|---|---|
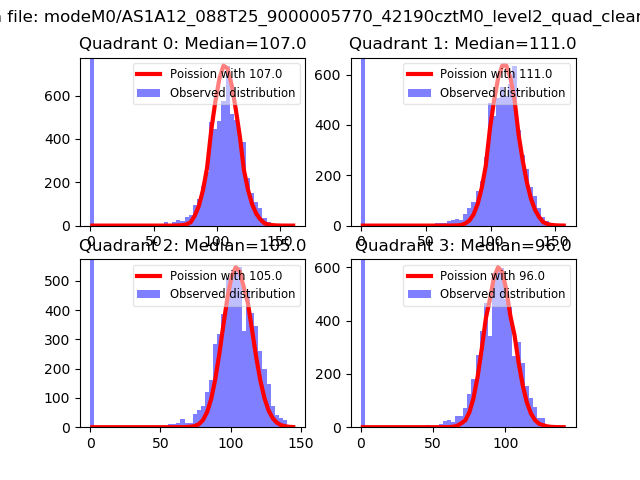
| Comparison with Poisson distribution Blue bars denote a histogram of data divided into 1 sec bins. Red curve is a Poisson curve with rate = median count rate of data. |
 |
 |
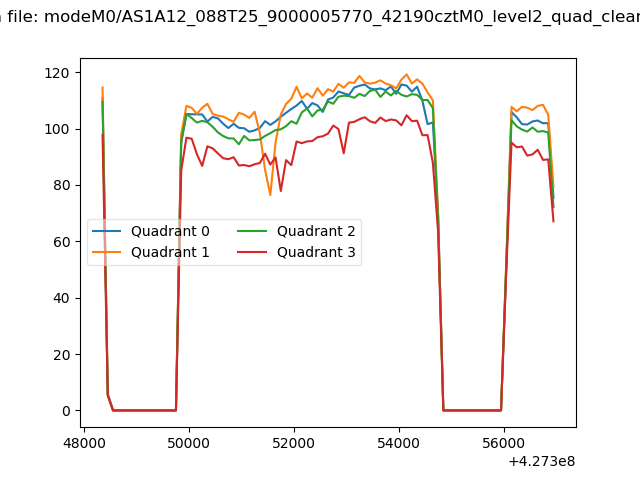
| Quadrant-wise count rates Data is divided into 100 sec bins |
 |
|
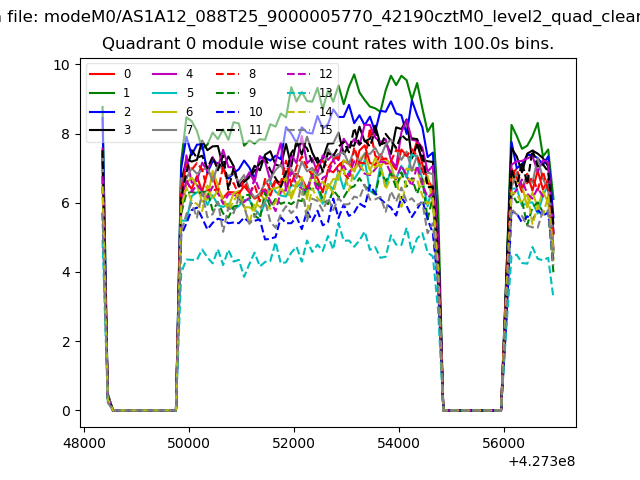
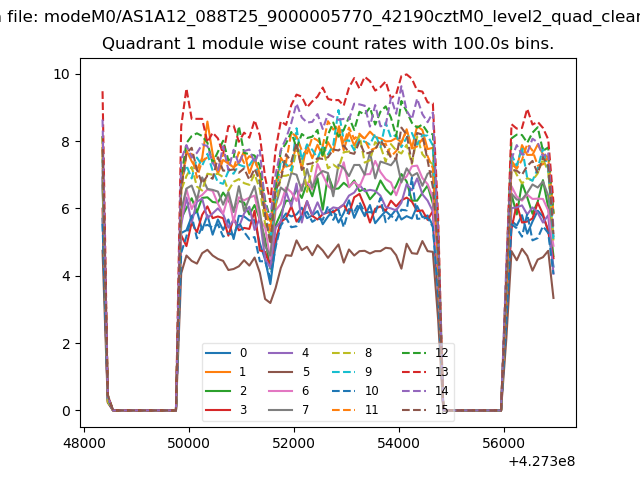
| Module-wise count rates for Quadrant A Data is divided into 100 sec bins |
 |
 |
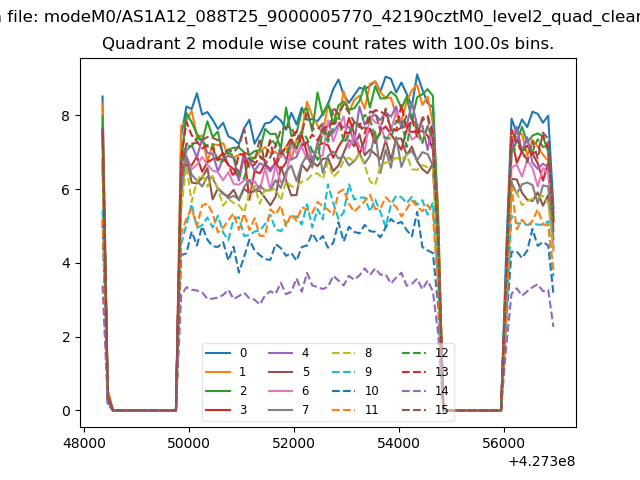
| Module-wise count rates for Quadrant B Data is divided into 100 sec bins |
 |
 |
| Module-wise count rates for Quadrant C Data is divided into 100 sec bins |
 |
 |
| Module-wise count rates for Quadrant D Data is divided into 100 sec bins |
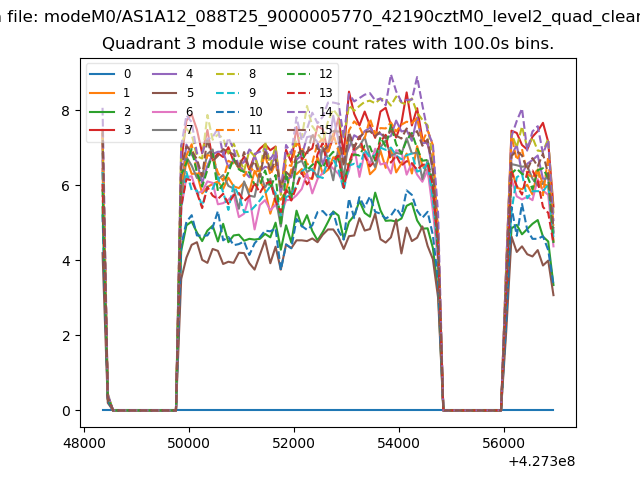 |
 |
| Parameter | Plot |
|---|---|
| CZT HV Monitor | 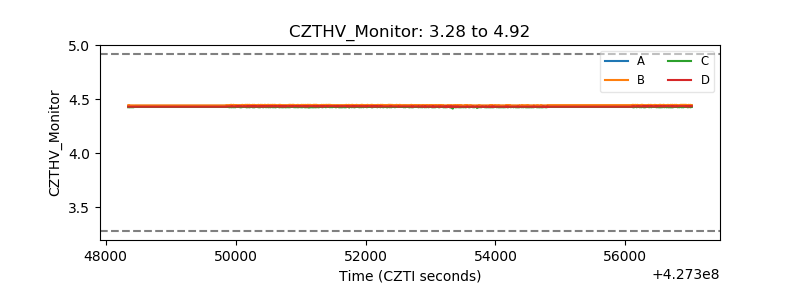 |
| D_VDD | 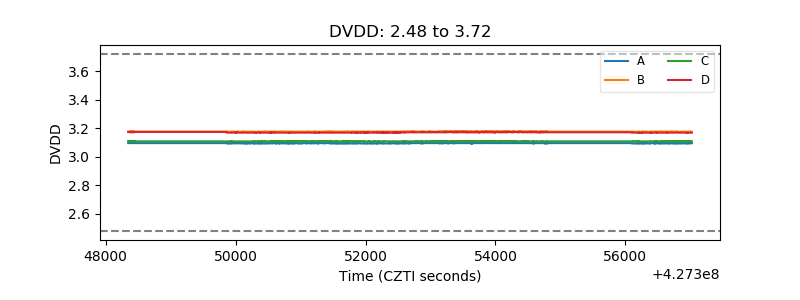 |
| Temperature 1 | 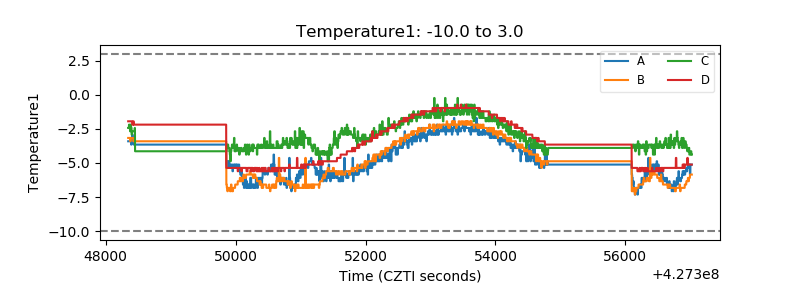 |
| Veto HV Monitor | 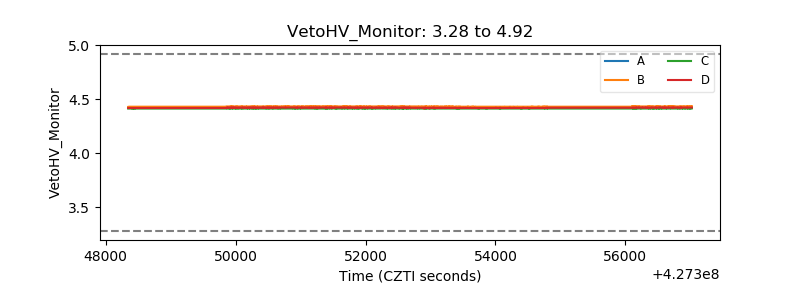 |
| Veto LLD | 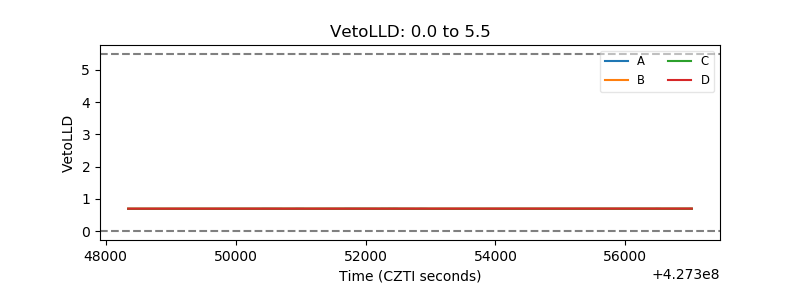 |
| Alpha Counter | 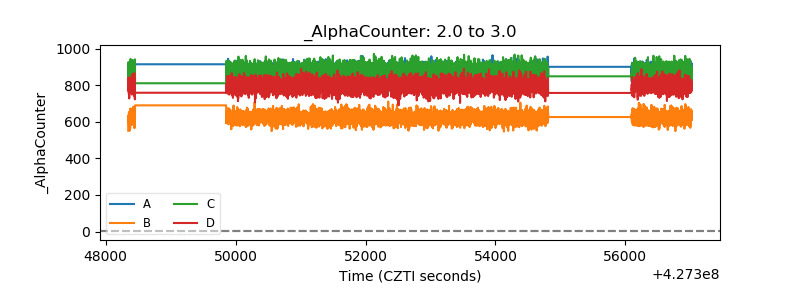 |
| _CPM_Rate | 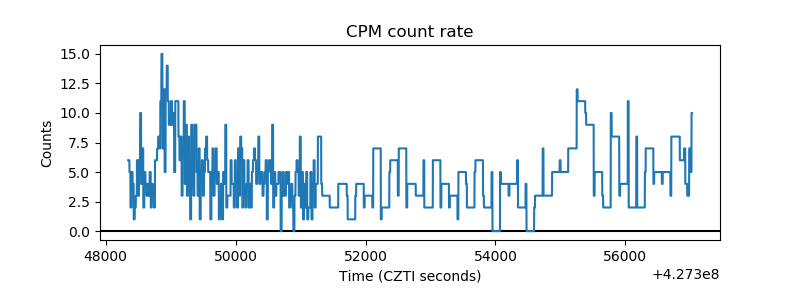 |
| CZT Counter | 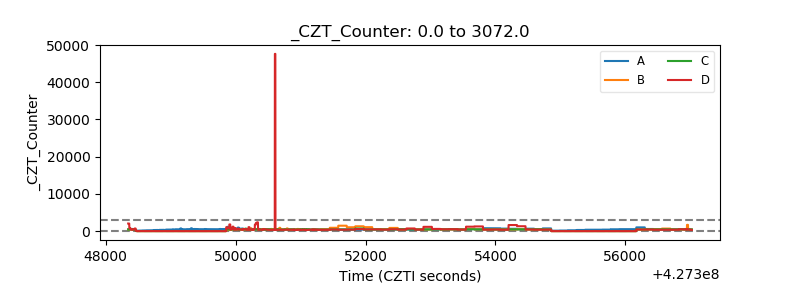 |
| +2.5 Volts monitor | 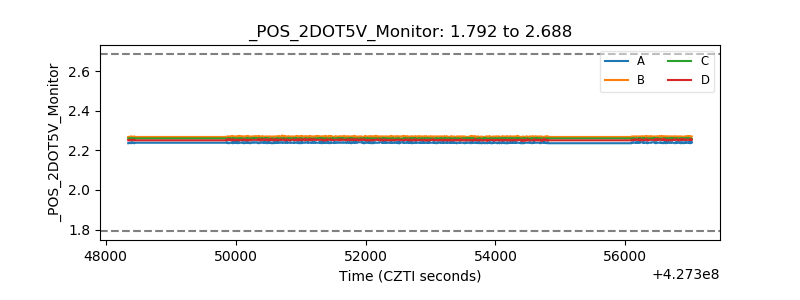 |
| +5 Volts monitor | 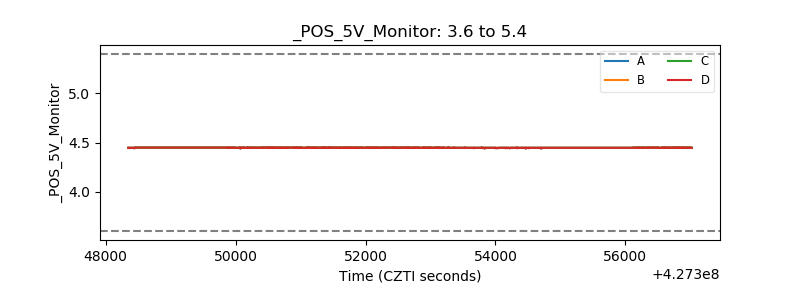 |
| _ROLL_ROT | 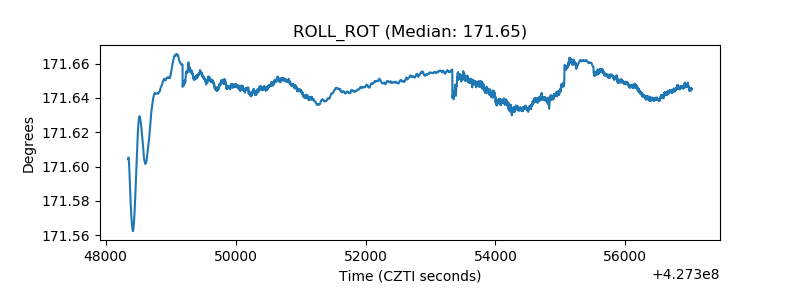 |
| _Roll_DEC | 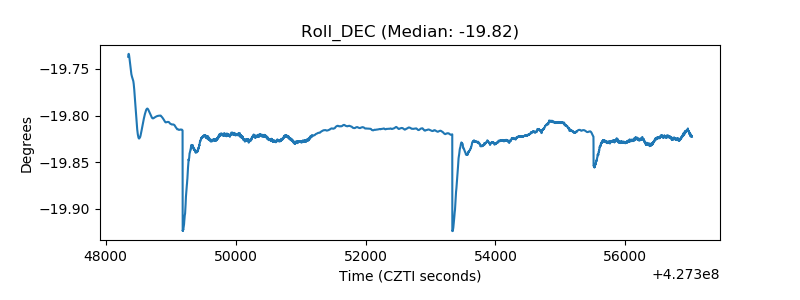 |
| _Roll_RA | 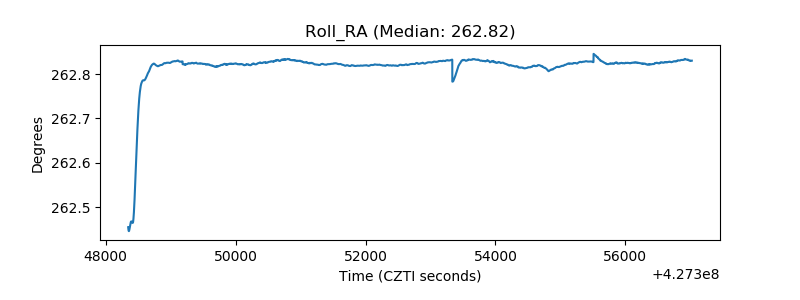 |
| Veto Counter | 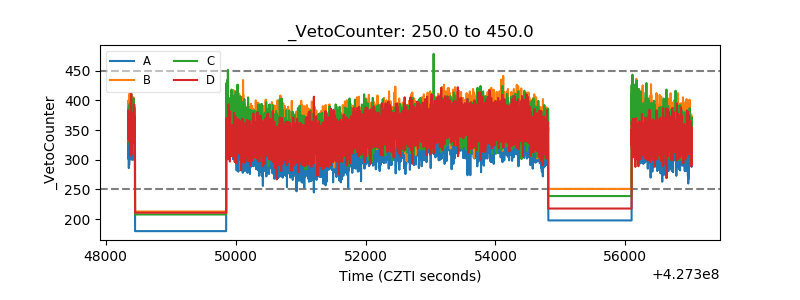 |