| Param | Original file | Final file |
|---|---|---|
| Filename | modeM0/AS1A12_088T58_9000005772_42193cztM0_level2.fits | modeM0/AS1A12_088T58_9000005772_42193cztM0_level2_quad_clean.evt |
| Size (bytes) | 129,769,920 | 38,208,960 |
| Size | 123.8 MB | 36.4 MB |
| Events in quadrant A | 1,256,508 | 253,800 |
| Events in quadrant B | 1,074,752 | 261,445 |
| Events in quadrant C | 1,091,454 | 249,239 |
| Events in quadrant D | 1,200,677 | 227,725 |
| Mode M0 | |||
|---|---|---|---|
| Quadrant | BADHDUFLAG | Total packets | Discarded packets |
| A | 0 | 5059 | 1 |
| B | 0 | 4715 | 1 |
| C | 0 | 4602 | 1 |
| D | 0 | 5143 | 1 |
| Mode M9 | |||
|---|---|---|---|
| Quadrant | BADHDUFLAG | Total packets | Discarded packets |
| A | 0 | 15 | 0 |
| B | 0 | 15 | 0 |
| C | 0 | 15 | 0 |
| D | 0 | 15 | 0 |
| Mode SS | |||
|---|---|---|---|
| Quadrant | BADHDUFLAG | Total packets | Discarded packets |
| A | 0 | 48 | 0 |
| B | 0 | 48 | 0 |
| C | 0 | 48 | 0 |
| D | 0 | 48 | 0 |
| Quadrant | Total seconds | Saturated seconds | Saturation percentage |
|---|---|---|---|
| A | 2283 | 7 | 0.306614% |
| B | 2283 | 16 | 0.700832% |
| C | 2283 | 1 | 0.043802% |
| D | 2283 | 22 | 0.963644% |
Noise dominated data is calculated using 1-second bins in cleaned event files. If a bin has >2000 counts, and if more than 50% of those come from <1% of pixels, then it is considered to be noise-dominated and hence unusable.
| Quadrant | # 1 sec bins | Bins with >0 counts | Bins with >2000 counts | High rate bins dominated by noise | Noise dominated (total time) | Noise dominated (detector-on time) | Marked lightcurve |
|---|---|---|---|---|---|---|---|
| A | 3806 | 2284 | 2 | 2 | 0.05% | 0.09% | 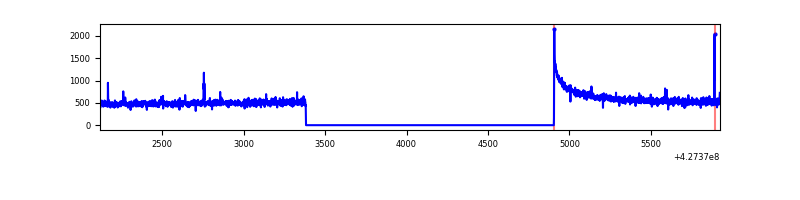 |
| B | 3806 | 2284 | 9 | 9 | 0.24% | 0.39% | 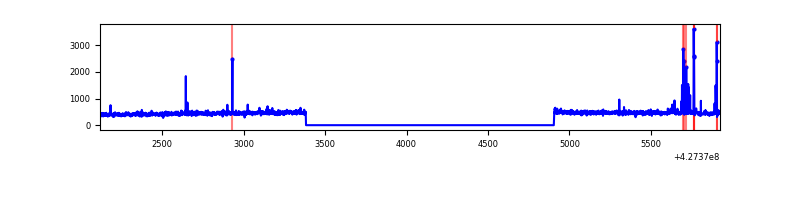 |
| C | 3806 | 2284 | 0 | 0 | 0.00% | 0.00% | 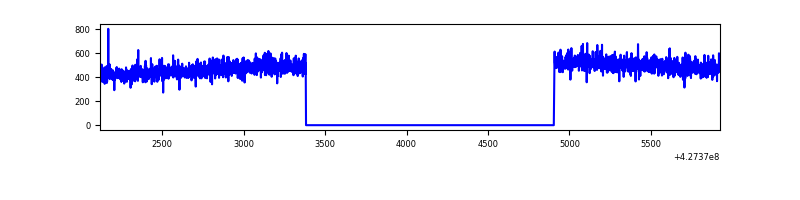 |
| D | 3806 | 2284 | 21 | 21 | 0.55% | 0.92% | 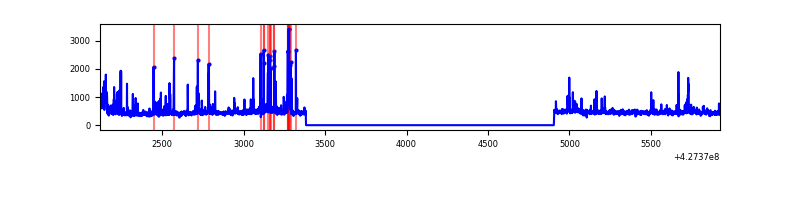 |
Top three noisy pixels from each quadrant. If the there are fewer than three noisy pixels in the level2.evt file, extra rows are filled as -1
| Pixel properties | Quadrant properties | ||||||
|---|---|---|---|---|---|---|---|
| Quadrant | DetID | PixID | Counts | Sigma | Mean | Median | Sigma |
| A | 10 | 83 | 241571 | 4399.52 | 259 | 254 | 54.9 |
| A | 13 | 248 | 11231 | 200.12 | 259 | 254 | 54.9 |
| A | 3 | 137 | 2960 | 49.33 | 259 | 254 | 54.9 |
| B | 3 | 112 | 42187 | 794.48 | 258 | 250 | 52.8 |
| B | 0 | 229 | 12664 | 235.18 | 258 | 250 | 52.8 |
| B | 12 | 111 | 6620 | 120.68 | 258 | 250 | 52.8 |
| C | 15 | 214 | 99608 | 1628.94 | 254 | 255 | 61.0 |
| C | 13 | 61 | 1583 | 21.77 | 254 | 255 | 61.0 |
| C | 7 | 247 | 1462 | 19.79 | 254 | 255 | 61.0 |
| D | 12 | 6 | 87954 | 1398.55 | 250 | 242 | 62.7 |
| D | 2 | 249 | 42799 | 678.56 | 250 | 242 | 62.7 |
| D | 12 | 33 | 23207 | 366.17 | 250 | 242 | 62.7 |
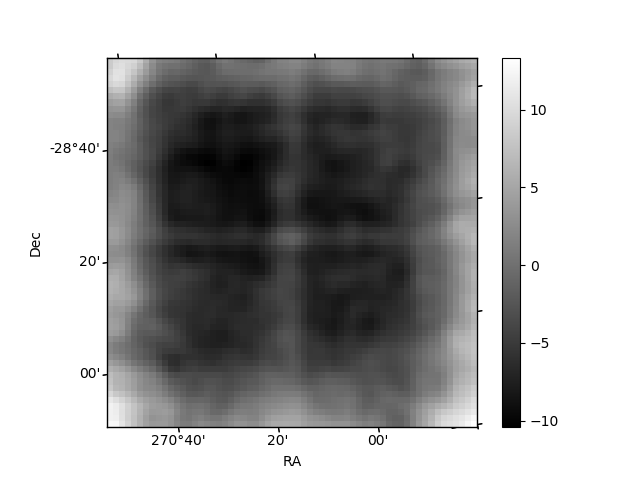
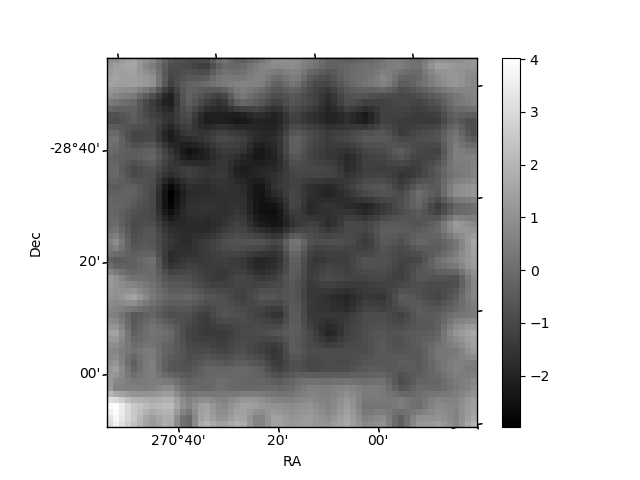
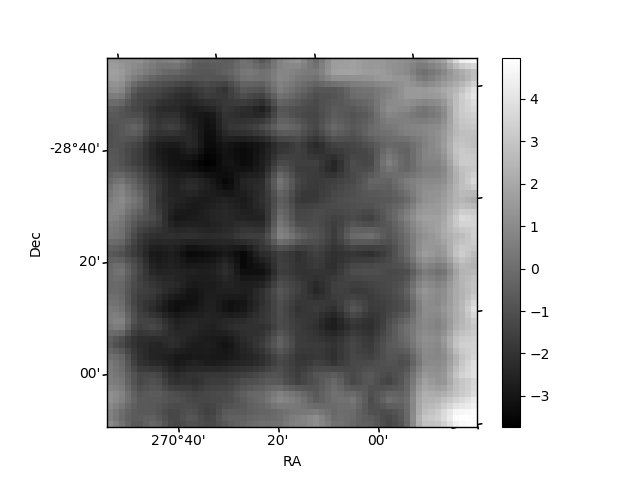
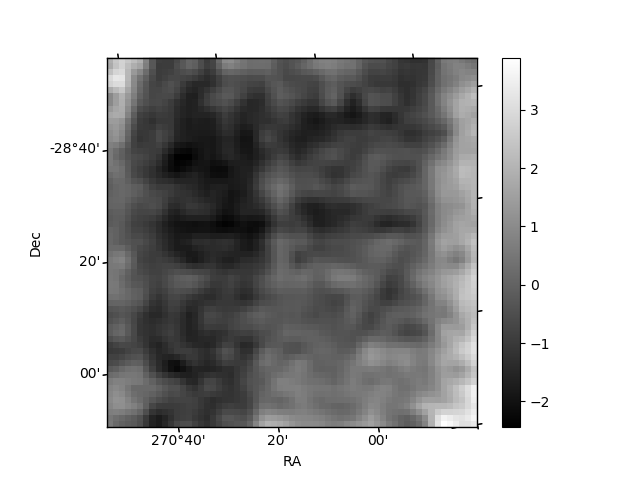
Histogram calculated using DETX and DETY for each event in the final _common_clean file
| Quadrant A | 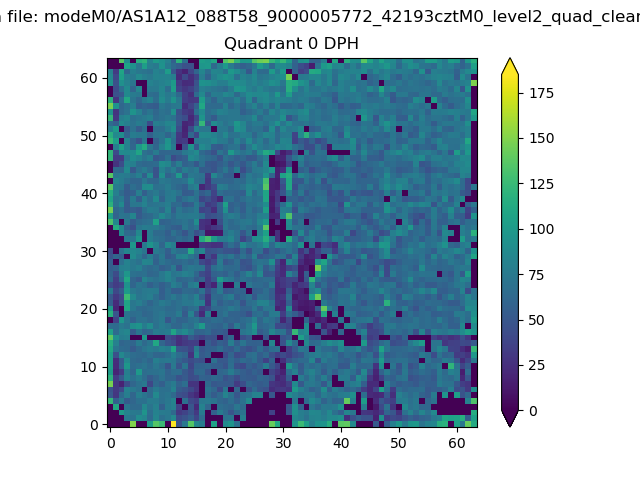 |
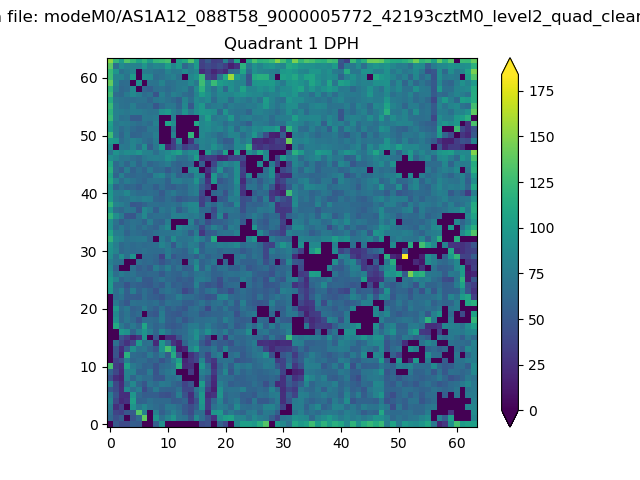 |
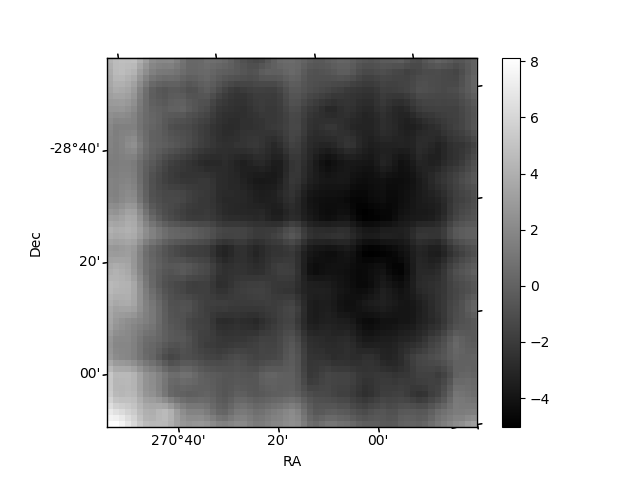
Quadrant B |
|---|---|---|---|
| Quadrant D | 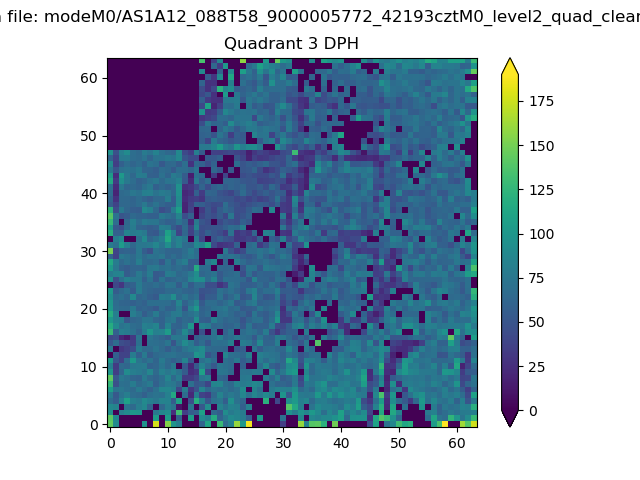 |
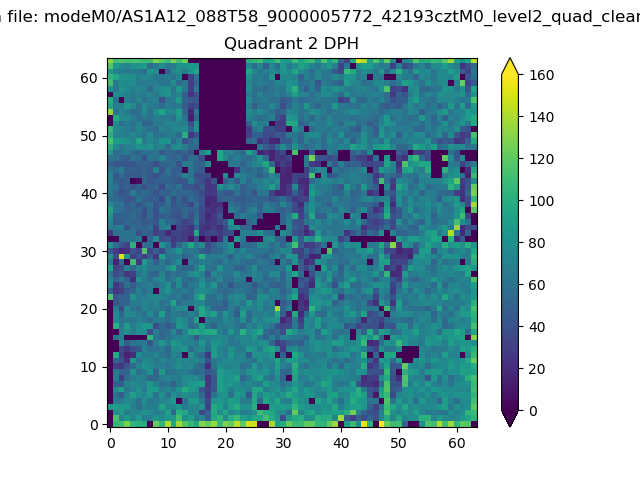 |
Quadrant C |
| Plot type | Count rate plots | Images |
|---|---|---|
| Comparison with Poisson distribution Blue bars denote a histogram of data divided into 1 sec bins. Red curve is a Poisson curve with rate = median count rate of data. |
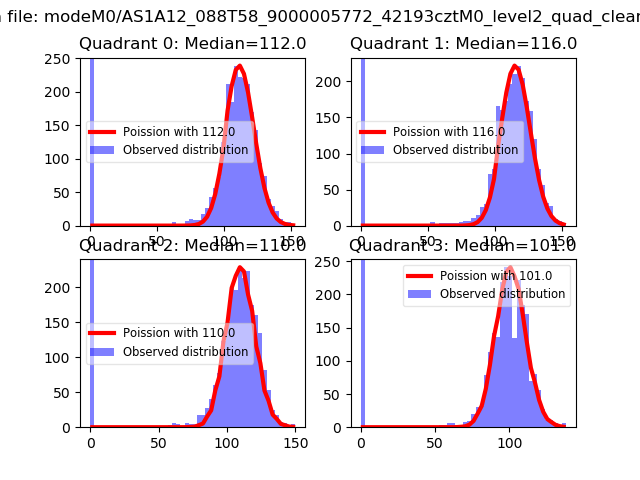 |
 |
| Quadrant-wise count rates Data is divided into 100 sec bins |
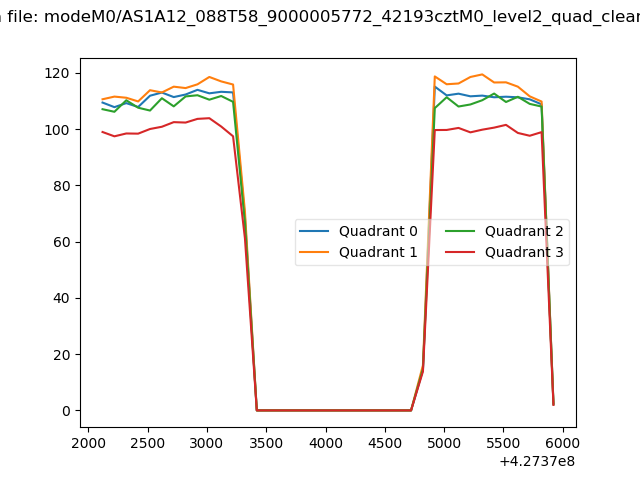 |
|
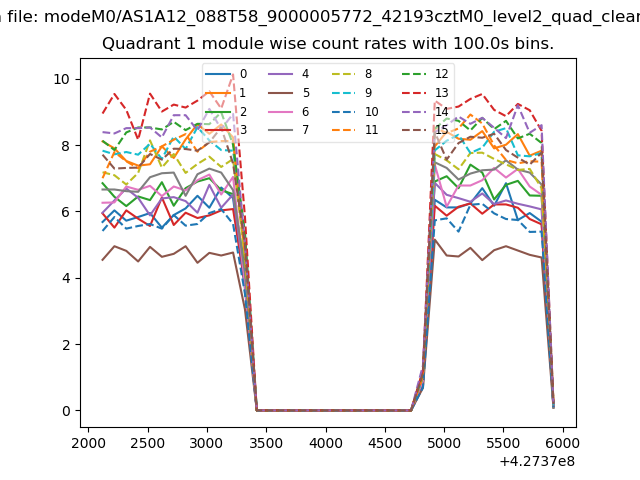
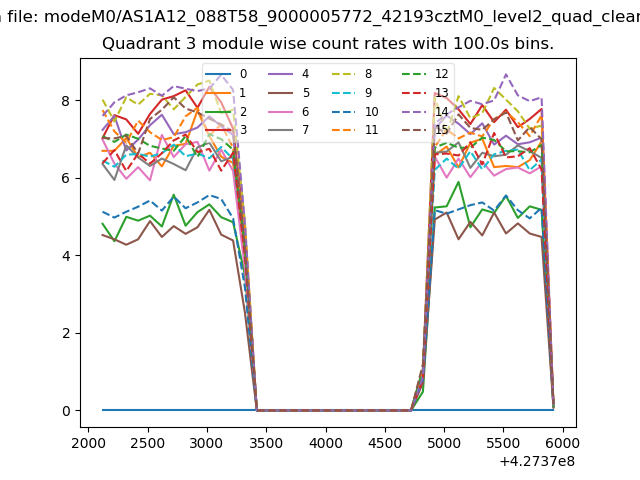
| Module-wise count rates for Quadrant A Data is divided into 100 sec bins |
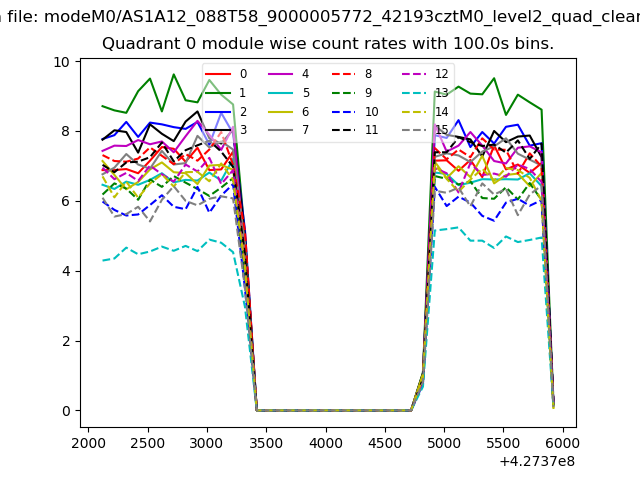 |
 |
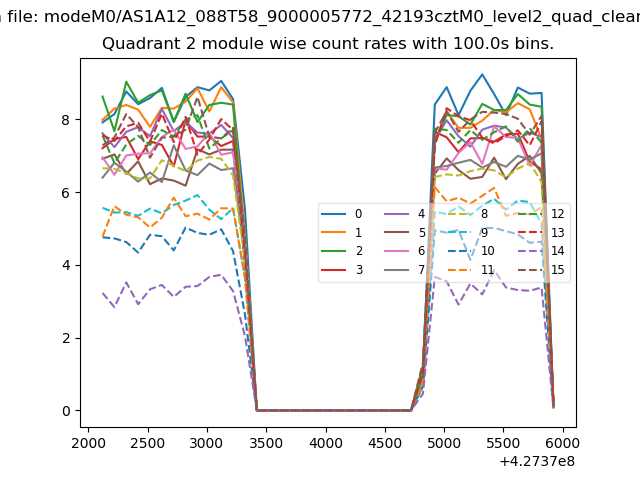
| Module-wise count rates for Quadrant B Data is divided into 100 sec bins |
 |
 |
| Module-wise count rates for Quadrant C Data is divided into 100 sec bins |
 |
 |
| Module-wise count rates for Quadrant D Data is divided into 100 sec bins |
 |
 |
| Parameter | Plot |
|---|---|
| CZT HV Monitor | 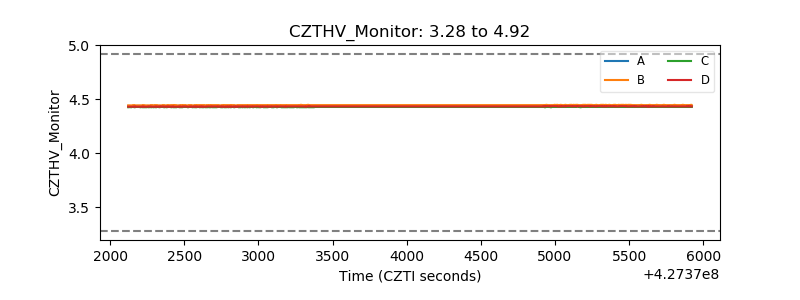 |
| D_VDD | 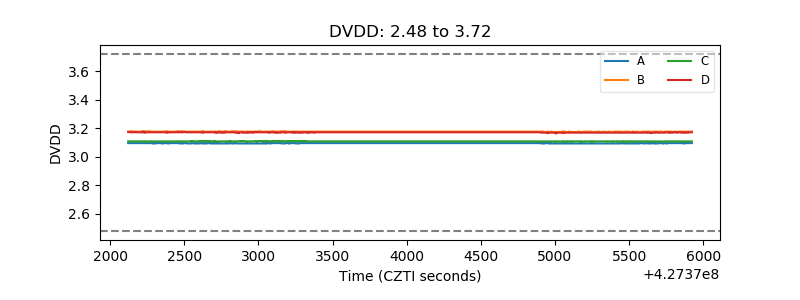 |
| Temperature 1 |  |
| Veto HV Monitor | 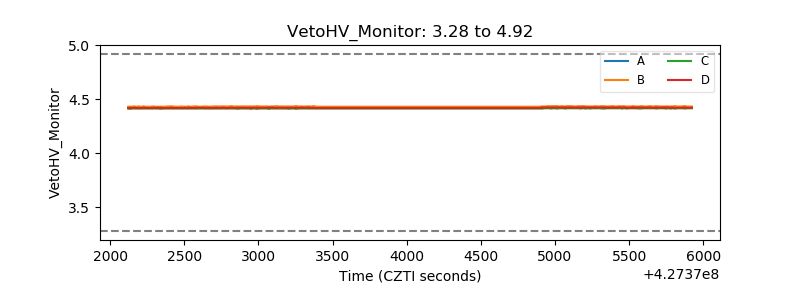 |
| Veto LLD | 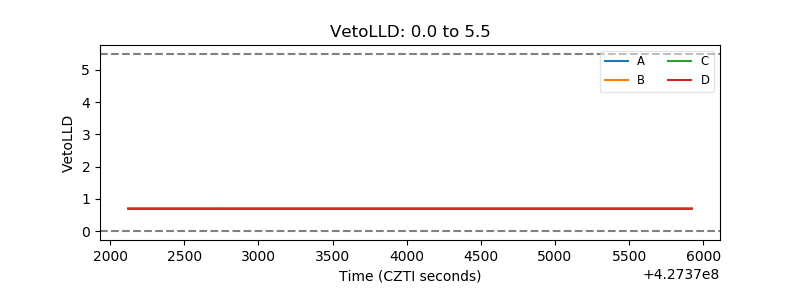 |
| Alpha Counter |  |
| _CPM_Rate |  |
| CZT Counter | 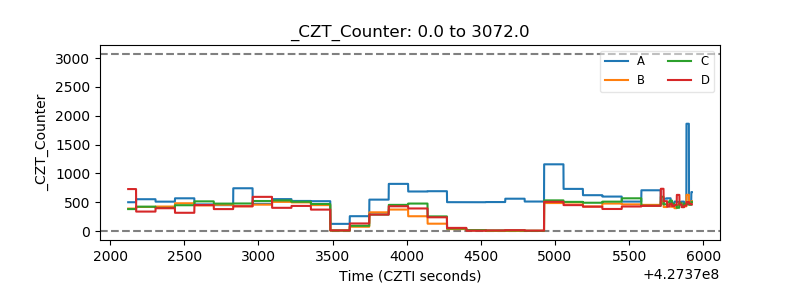 |
| +2.5 Volts monitor | 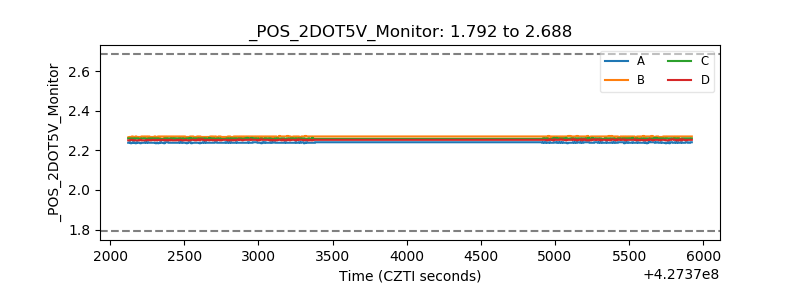 |
| +5 Volts monitor |  |
| _ROLL_ROT | 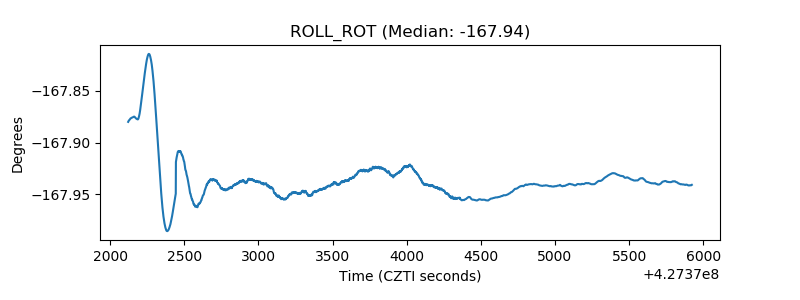 |
| _Roll_DEC | 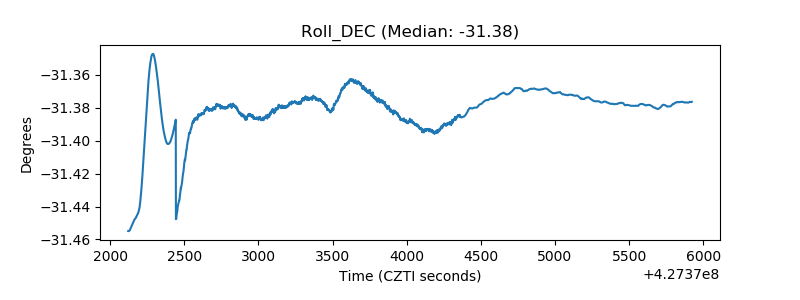 |
| _Roll_RA | 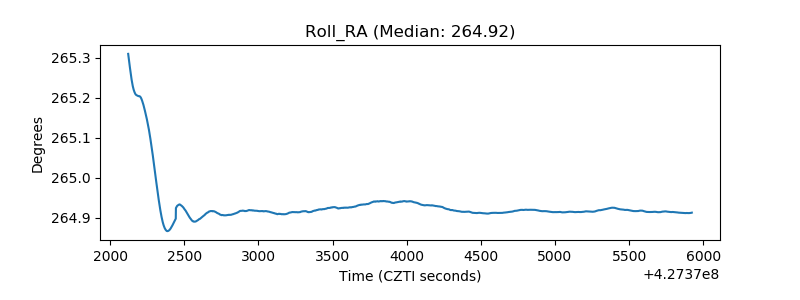 |
| Veto Counter | 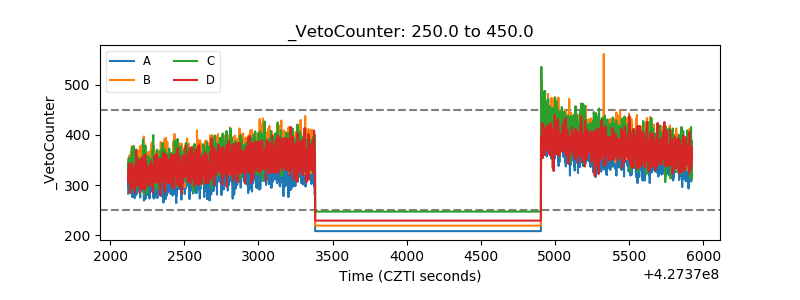 |