| Param | Original file | Final file |
|---|---|---|
| Filename | modeM0/AS1A12_088T58_9000005772_42194cztM0_level2.fits | modeM0/AS1A12_088T58_9000005772_42194cztM0_level2_quad_clean.evt |
| Size (bytes) | 318,130,560 | 91,103,040 |
| Size | 303.4 MB | 86.9 MB |
| Events in quadrant A | 2,979,107 | 606,579 |
| Events in quadrant B | 2,643,721 | 626,073 |
| Events in quadrant C | 2,637,886 | 600,734 |
| Events in quadrant D | 3,085,052 | 538,522 |
| Mode M0 | |||
|---|---|---|---|
| Quadrant | BADHDUFLAG | Total packets | Discarded packets |
| A | 0 | 12171 | 4 |
| B | 0 | 11577 | 5 |
| C | 0 | 11331 | 2 |
| D | 0 | 13093 | 2 |
| Mode M9 | |||
|---|---|---|---|
| Quadrant | BADHDUFLAG | Total packets | Discarded packets |
| A | 0 | 29 | 0 |
| B | 0 | 30 | 0 |
| C | 0 | 30 | 0 |
| D | 0 | 30 | 0 |
| Mode SS | |||
|---|---|---|---|
| Quadrant | BADHDUFLAG | Total packets | Discarded packets |
| A | 0 | 114 | 0 |
| B | 0 | 114 | 0 |
| C | 0 | 114 | 0 |
| D | 0 | 114 | 0 |
| Quadrant | Total seconds | Saturated seconds | Saturation percentage |
|---|---|---|---|
| A | 5520 | 19 | 0.344203% |
| B | 5519 | 18 | 0.326146% |
| C | 5521 | 3 | 0.054338% |
| D | 5521 | 135 | 2.445209% |
Noise dominated data is calculated using 1-second bins in cleaned event files. If a bin has >2000 counts, and if more than 50% of those come from <1% of pixels, then it is considered to be noise-dominated and hence unusable.
| Quadrant | # 1 sec bins | Bins with >0 counts | Bins with >2000 counts | High rate bins dominated by noise | Noise dominated (total time) | Noise dominated (detector-on time) | Marked lightcurve |
|---|---|---|---|---|---|---|---|
| A | 7164 | 5522 | 5 | 5 | 0.07% | 0.09% | 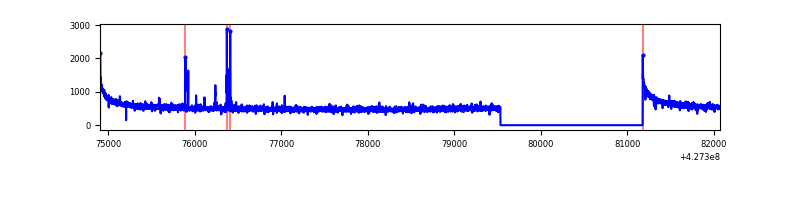 |
| B | 7164 | 5521 | 12 | 12 | 0.17% | 0.22% | 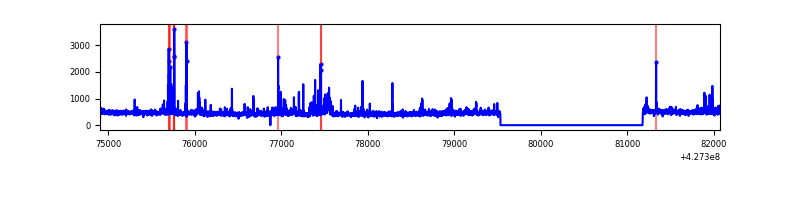 |
| C | 7164 | 5522 | 1 | 1 | 0.01% | 0.02% | 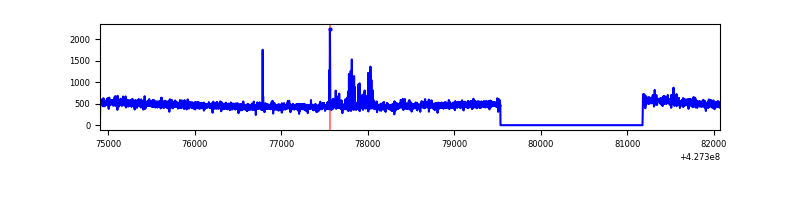 |
| D | 7164 | 5522 | 122 | 122 | 1.70% | 2.21% | 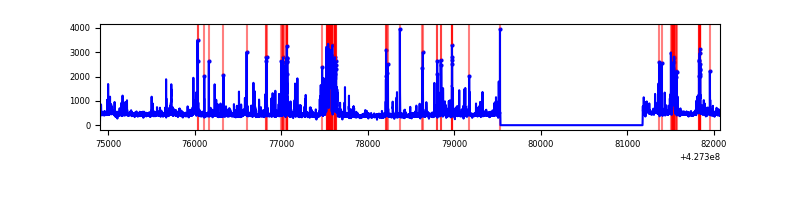 |
Top three noisy pixels from each quadrant. If the there are fewer than three noisy pixels in the level2.evt file, extra rows are filled as -1
| Pixel properties | Quadrant properties | ||||||
|---|---|---|---|---|---|---|---|
| Quadrant | DetID | PixID | Counts | Sigma | Mean | Median | Sigma |
| A | 10 | 83 | 565445 | 4428.35 | 615 | 604 | 127.6 |
| A | 13 | 248 | 32376 | 249.09 | 615 | 604 | 127.6 |
| A | 3 | 137 | 6882 | 49.22 | 615 | 604 | 127.6 |
| B | 0 | 229 | 101584 | 850.02 | 607 | 591 | 118.8 |
| B | 3 | 112 | 74897 | 625.41 | 607 | 591 | 118.8 |
| B | 15 | 54 | 26011 | 213.95 | 607 | 591 | 118.8 |
| C | 15 | 214 | 233669 | 1671.2 | 595 | 599 | 139.5 |
| C | 7 | 220 | 51005 | 361.43 | 595 | 599 | 139.5 |
| C | 0 | 207 | 26355 | 184.68 | 595 | 599 | 139.5 |
| D | 2 | 249 | 251382 | 1755.38 | 591 | 575 | 142.9 |
| D | 1 | 47 | 114282 | 795.83 | 591 | 575 | 142.9 |
| D | 12 | 6 | 95965 | 667.63 | 591 | 575 | 142.9 |
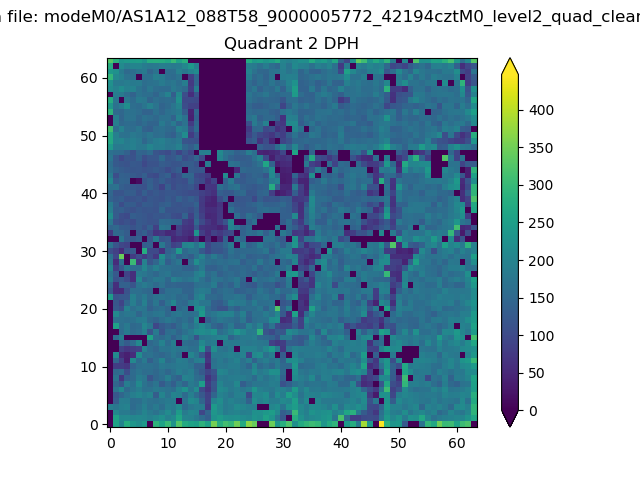
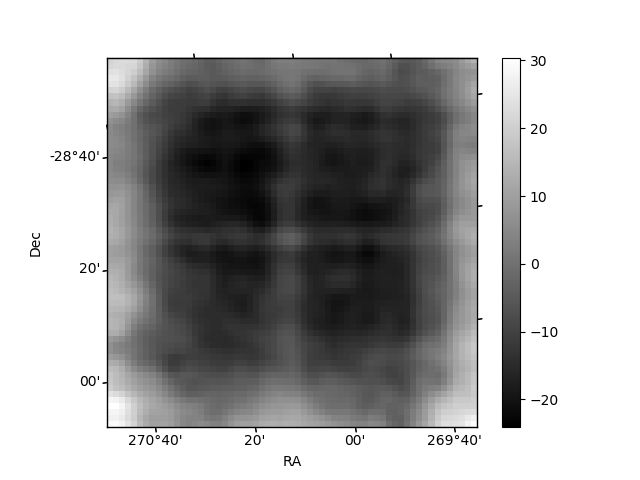
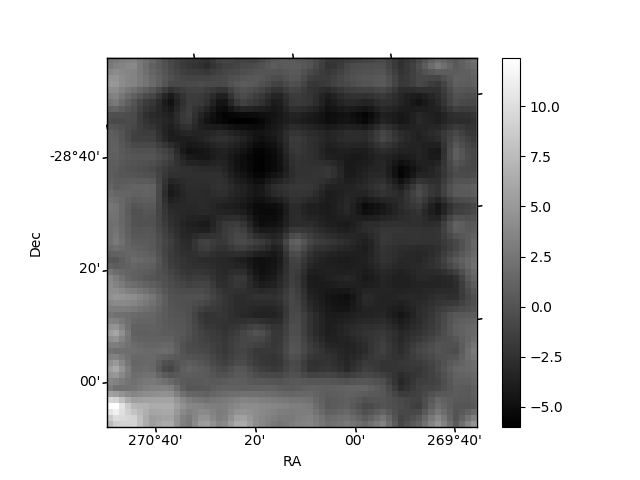
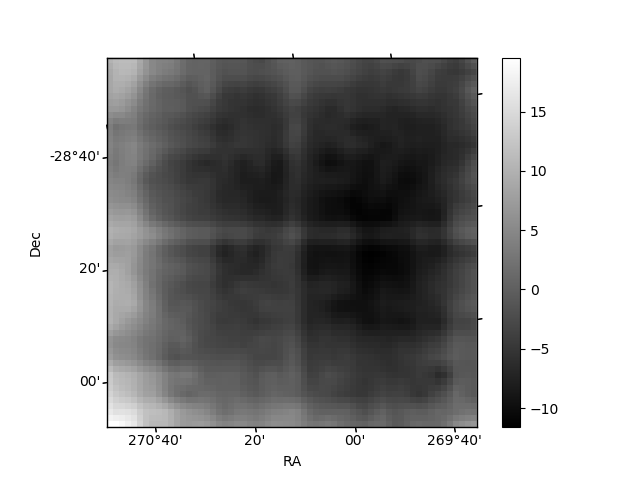
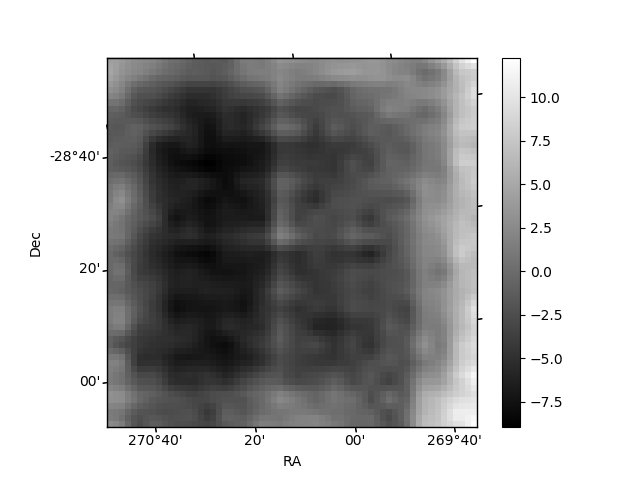
Histogram calculated using DETX and DETY for each event in the final _common_clean file
| Quadrant A | 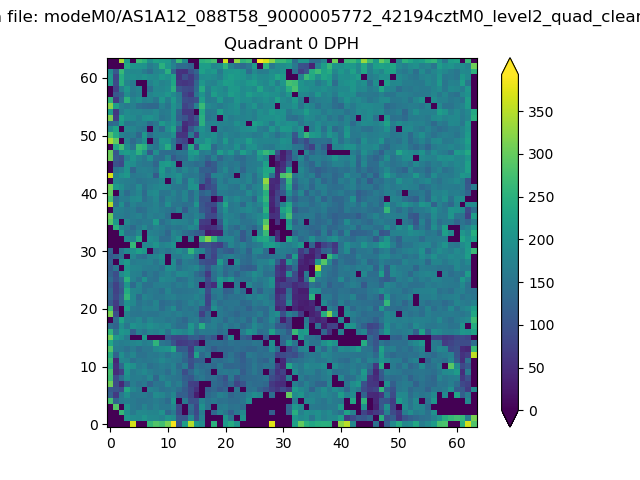 |
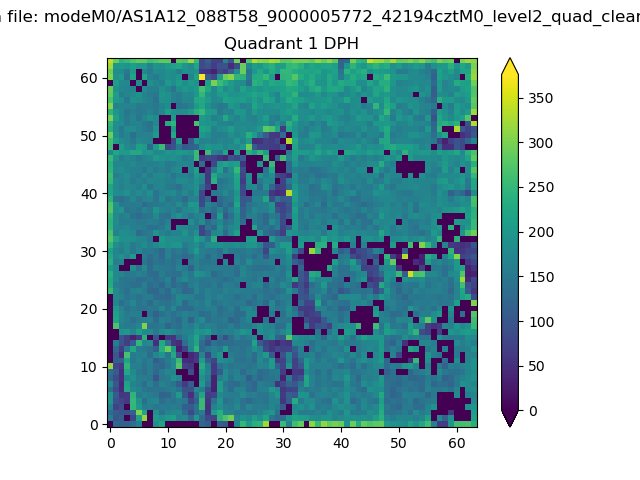 |
Quadrant B |
|---|---|---|---|
| Quadrant D | 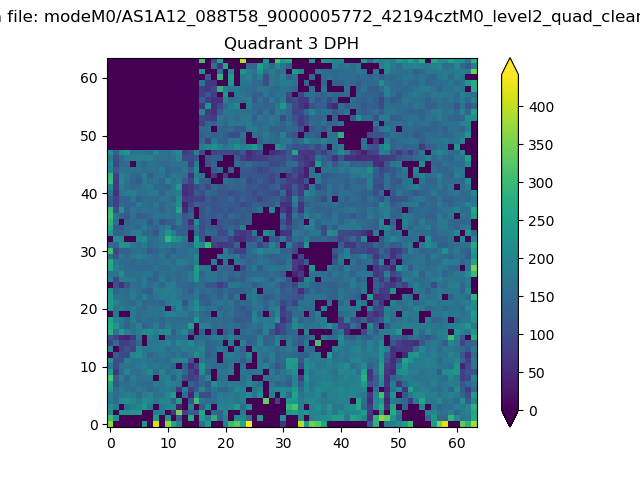 |
 |
Quadrant C |
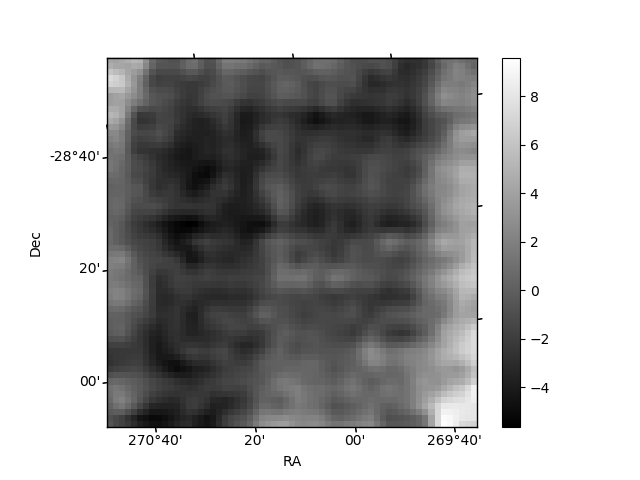
| Plot type | Count rate plots | Images |
|---|---|---|
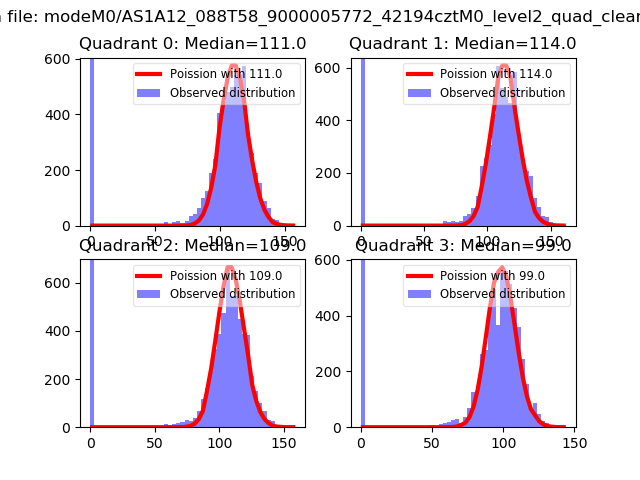
| Comparison with Poisson distribution Blue bars denote a histogram of data divided into 1 sec bins. Red curve is a Poisson curve with rate = median count rate of data. |
 |
 |
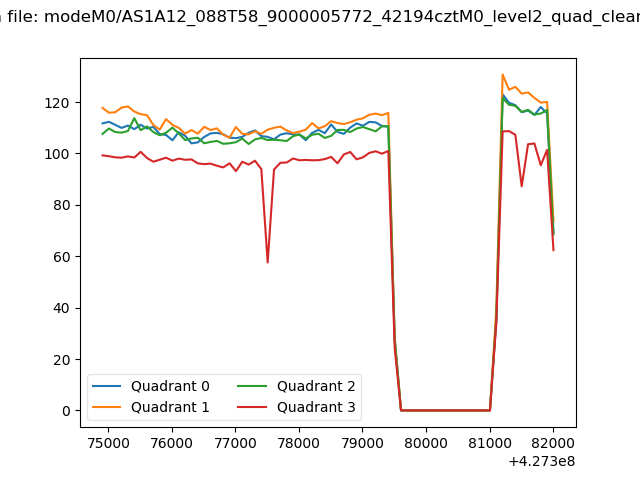
| Quadrant-wise count rates Data is divided into 100 sec bins |
 |
|
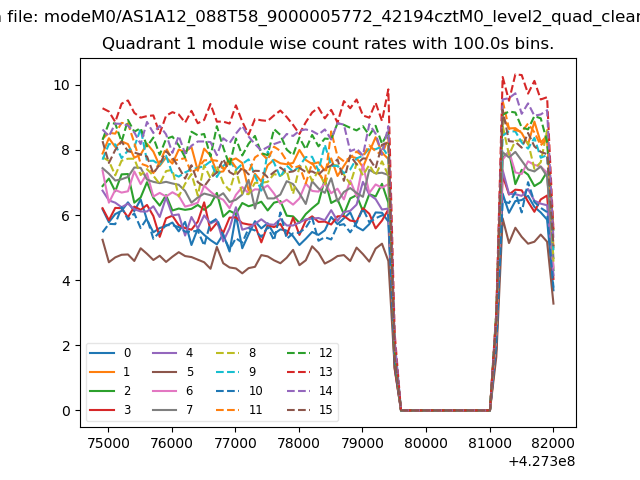
| Module-wise count rates for Quadrant A Data is divided into 100 sec bins |
 |
 |
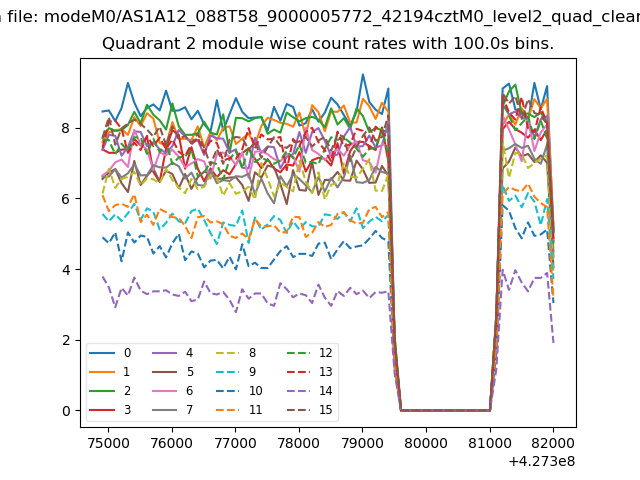
| Module-wise count rates for Quadrant B Data is divided into 100 sec bins |
 |
 |
| Module-wise count rates for Quadrant C Data is divided into 100 sec bins |
 |
 |
| Module-wise count rates for Quadrant D Data is divided into 100 sec bins |
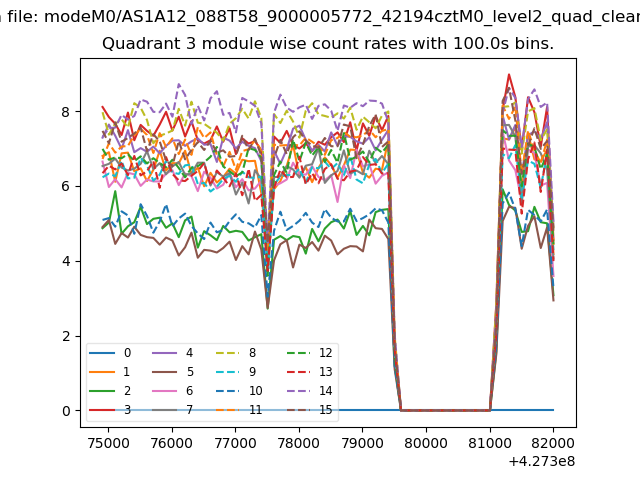 |
 |
| Parameter | Plot |
|---|---|
| CZT HV Monitor | 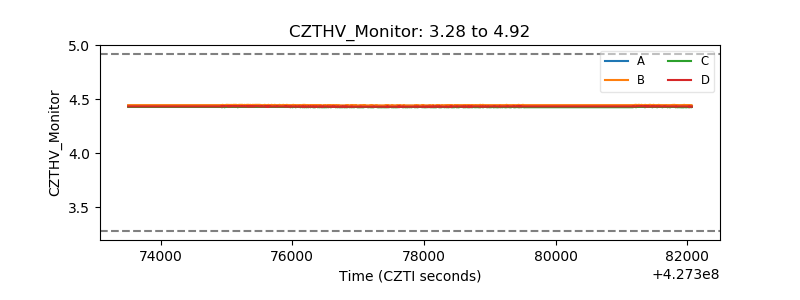 |
| D_VDD | 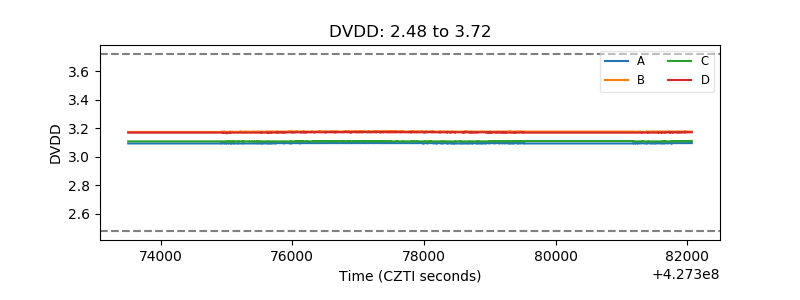 |
| Temperature 1 | 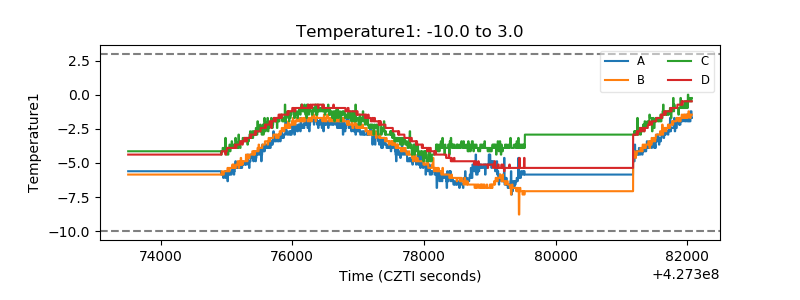 |
| Veto HV Monitor | 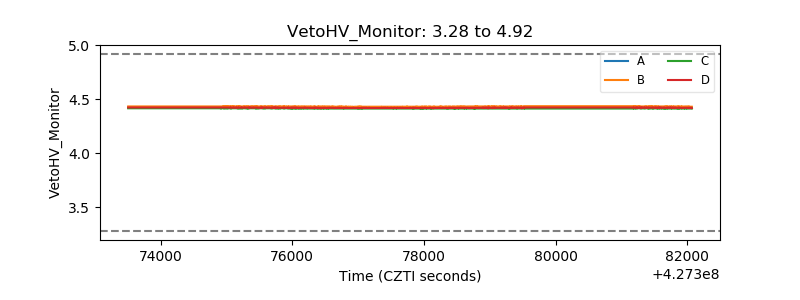 |
| Veto LLD | 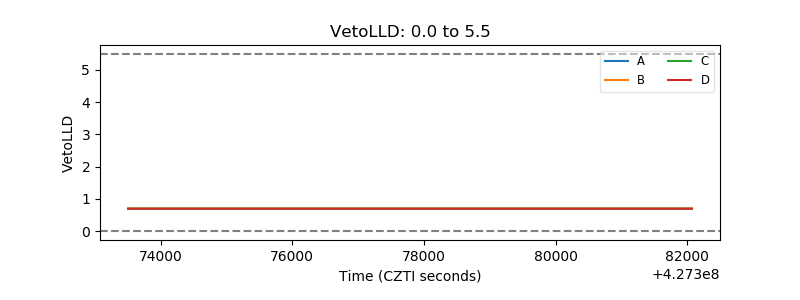 |
| Alpha Counter |  |
| _CPM_Rate |  |
| CZT Counter | 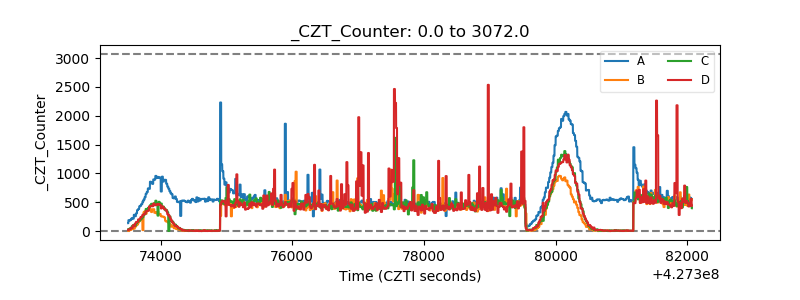 |
| +2.5 Volts monitor | 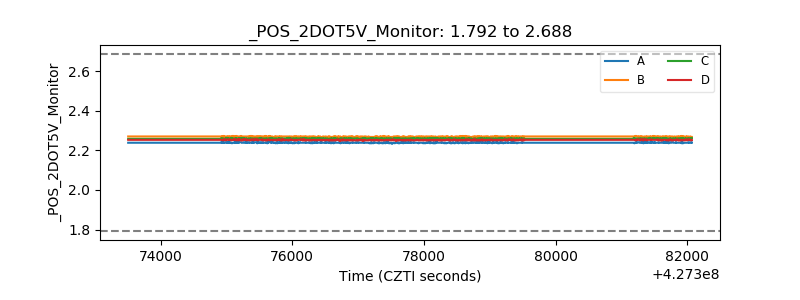 |
| +5 Volts monitor |  |
| _ROLL_ROT | 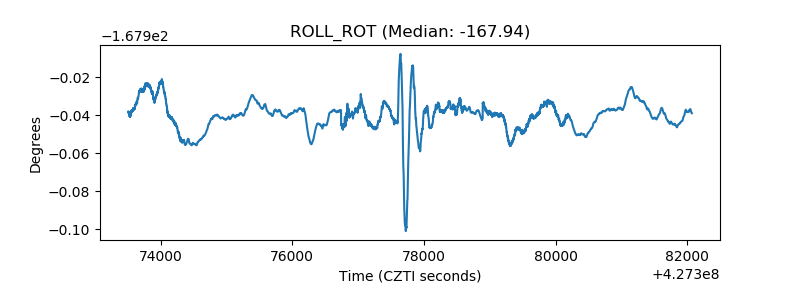 |
| _Roll_DEC | 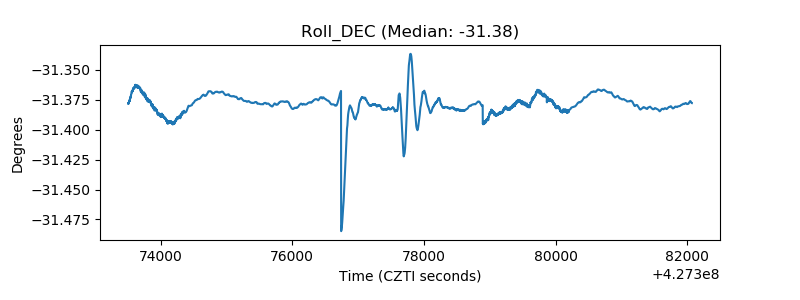 |
| _Roll_RA | 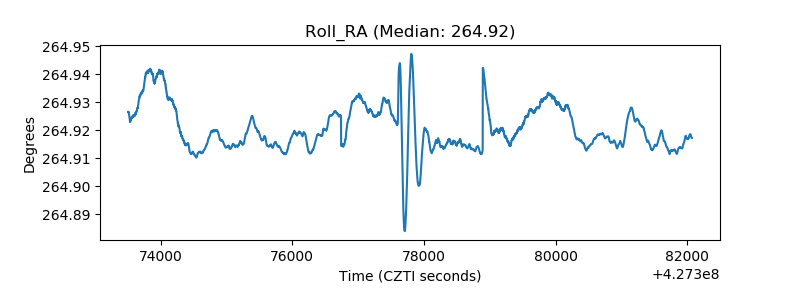 |
| Veto Counter | 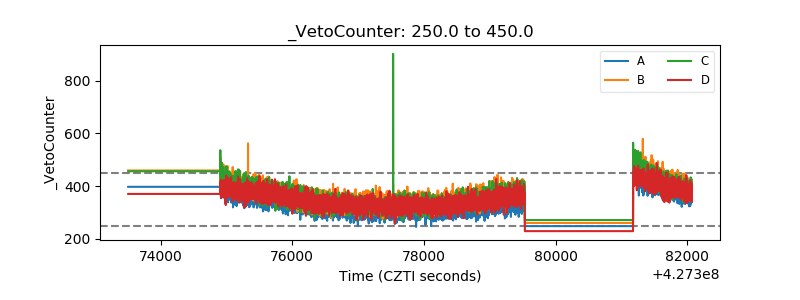 |