| Param | Original file | Final file |
|---|---|---|
| Filename | modeM0/AS1A12_088T58_9000005772_42197cztM0_level2.fits | modeM0/AS1A12_088T58_9000005772_42197cztM0_level2_quad_clean.evt |
| Size (bytes) | 134,458,560 | 32,423,040 |
| Size | 128.2 MB | 30.9 MB |
| Events in quadrant A | 1,119,560 | 221,835 |
| Events in quadrant B | 993,187 | 224,526 |
| Events in quadrant C | 868,156 | 215,002 |
| Events in quadrant D | 1,853,444 | 188,626 |
| Mode M0 | |||
|---|---|---|---|
| Quadrant | BADHDUFLAG | Total packets | Discarded packets |
| A | 0 | 4492 | 1 |
| B | 0 | 4126 | 1 |
| C | 0 | 3684 | 1 |
| D | 0 | 6783 | 1 |
| Mode M9 | |||
|---|---|---|---|
| Quadrant | BADHDUFLAG | Total packets | Discarded packets |
| A | 0 | 7 | 0 |
| B | 0 | 8 | 0 |
| C | 0 | 8 | 0 |
| D | 0 | 8 | 0 |
| Mode SS | |||
|---|---|---|---|
| Quadrant | BADHDUFLAG | Total packets | Discarded packets |
| A | 0 | 36 | 0 |
| B | 0 | 36 | 0 |
| C | 0 | 36 | 0 |
| D | 0 | 36 | 0 |
| Quadrant | Total seconds | Saturated seconds | Saturation percentage |
|---|---|---|---|
| A | 1805 | 16 | 0.886427% |
| B | 1805 | 16 | 0.886427% |
| C | 1805 | 1 | 0.055402% |
| D | 1805 | 140 | 7.756233% |
Noise dominated data is calculated using 1-second bins in cleaned event files. If a bin has >2000 counts, and if more than 50% of those come from <1% of pixels, then it is considered to be noise-dominated and hence unusable.
| Quadrant | # 1 sec bins | Bins with >0 counts | Bins with >2000 counts | High rate bins dominated by noise | Noise dominated (total time) | Noise dominated (detector-on time) | Marked lightcurve |
|---|---|---|---|---|---|---|---|
| A | 1805 | 1805 | 2 | 2 | 0.11% | 0.11% |  |
| B | 1805 | 1805 | 9 | 9 | 0.50% | 0.50% |  |
| C | 1805 | 1805 | 0 | 0 | 0.00% | 0.00% |  |
| D | 1805 | 1805 | 140 | 140 | 7.76% | 7.76% | 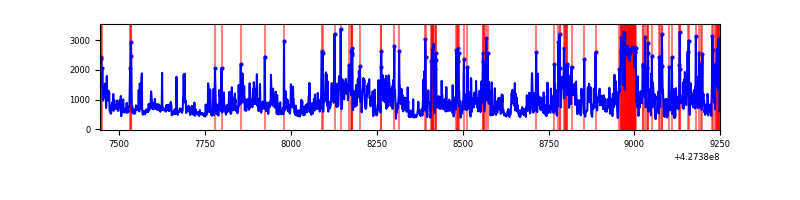 |
Top three noisy pixels from each quadrant. If the there are fewer than three noisy pixels in the level2.evt file, extra rows are filled as -1
| Pixel properties | Quadrant properties | ||||||
|---|---|---|---|---|---|---|---|
| Quadrant | DetID | PixID | Counts | Sigma | Mean | Median | Sigma |
| A | 10 | 83 | 238620 | 5208.75 | 213 | 209 | 45.8 |
| A | 15 | 223 | 53922 | 1173.51 | 213 | 209 | 45.8 |
| A | 3 | 137 | 2232 | 44.2 | 213 | 209 | 45.8 |
| B | 0 | 229 | 84782 | 2001.25 | 208 | 202 | 42.3 |
| B | 15 | 35 | 37424 | 880.71 | 208 | 202 | 42.3 |
| B | 0 | 156 | 24610 | 577.52 | 208 | 202 | 42.3 |
| C | 15 | 214 | 78642 | 1618.22 | 201 | 203 | 48.5 |
| C | 7 | 220 | 2271 | 42.66 | 201 | 203 | 48.5 |
| C | 13 | 61 | 1390 | 24.49 | 201 | 203 | 48.5 |
| D | 1 | 52 | 703250 | 14029.81 | 199 | 194 | 50.1 |
| D | 12 | 233 | 134086 | 2671.88 | 199 | 194 | 50.1 |
| D | 5 | 70 | 100824 | 2008.12 | 199 | 194 | 50.1 |
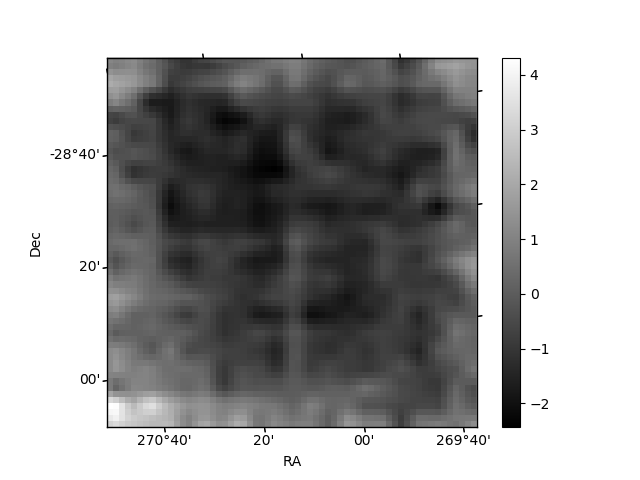
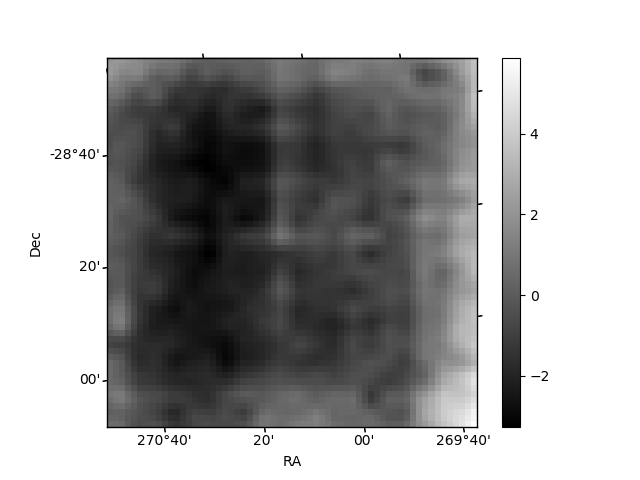
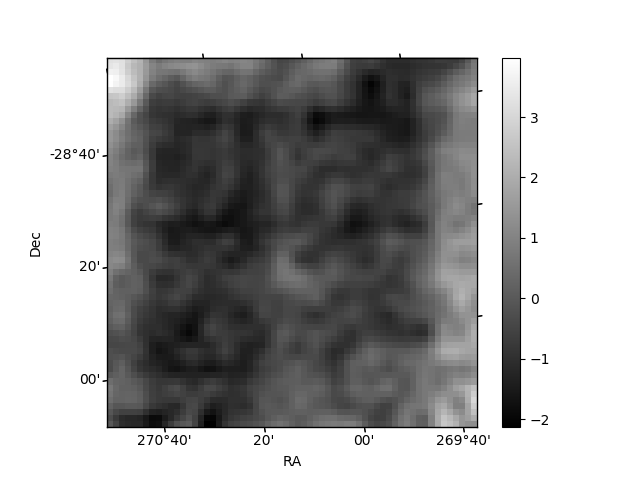
Histogram calculated using DETX and DETY for each event in the final _common_clean file
| Quadrant A |  |
 |
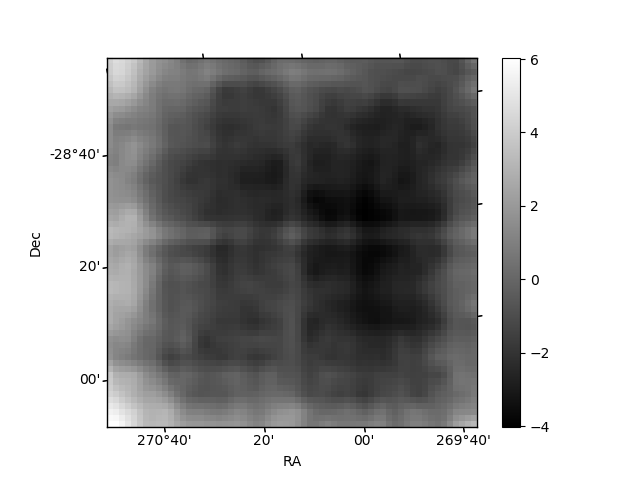
Quadrant B |
|---|---|---|---|
| Quadrant D |  |
 |
Quadrant C |
| Plot type | Count rate plots | Images |
|---|---|---|
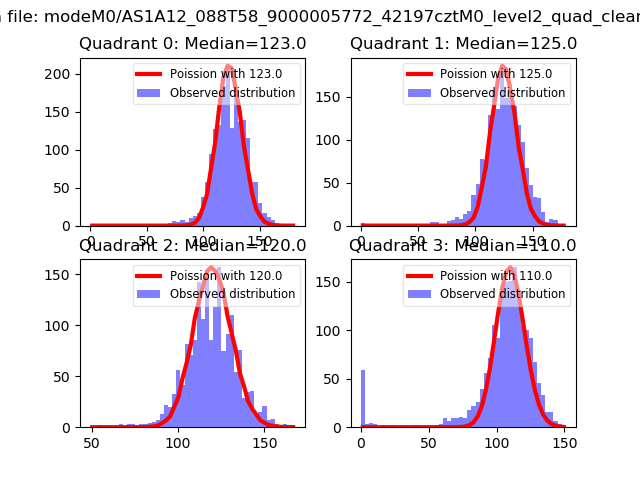
| Comparison with Poisson distribution Blue bars denote a histogram of data divided into 1 sec bins. Red curve is a Poisson curve with rate = median count rate of data. |
 |
 |
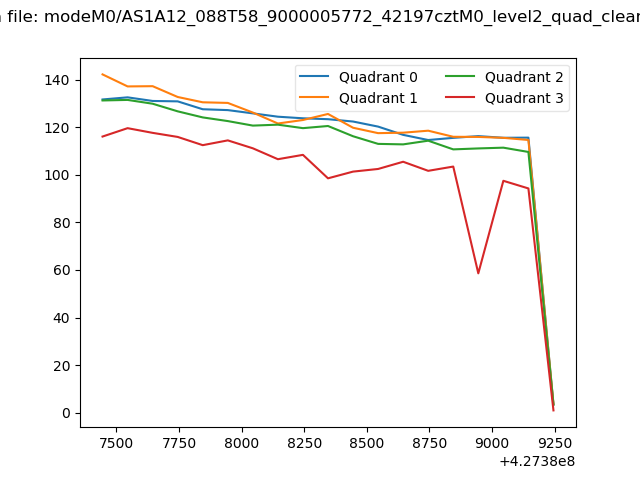
| Quadrant-wise count rates Data is divided into 100 sec bins |
 |
|
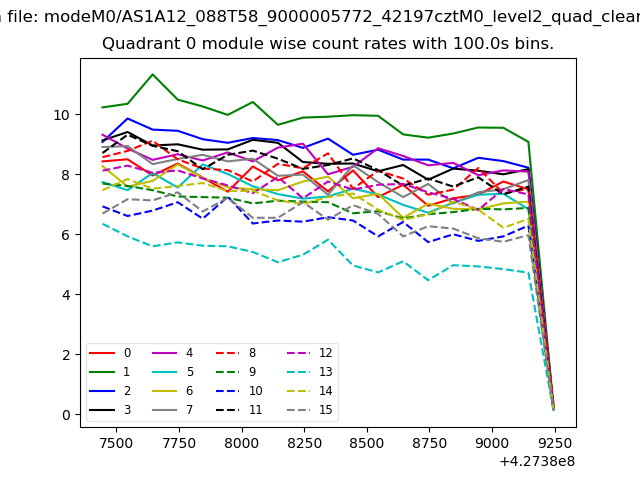
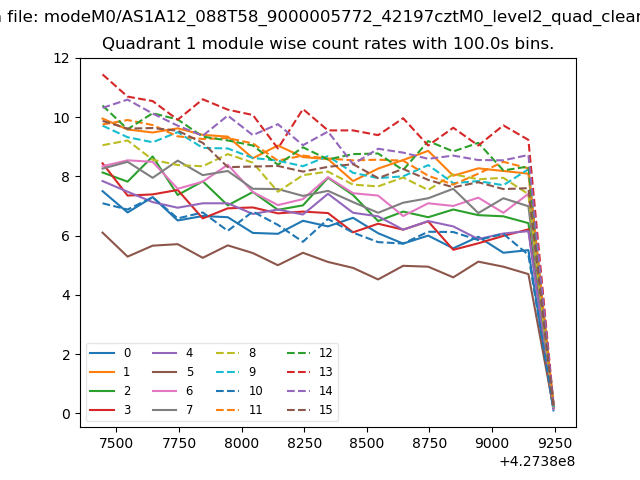
| Module-wise count rates for Quadrant A Data is divided into 100 sec bins |
 |
 |
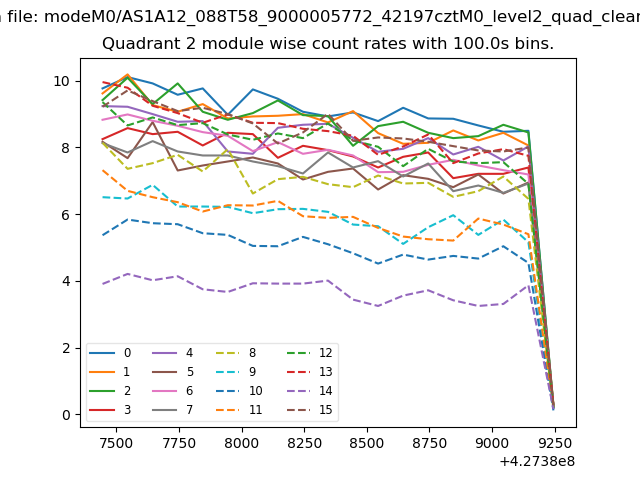
| Module-wise count rates for Quadrant B Data is divided into 100 sec bins |
 |
 |
| Module-wise count rates for Quadrant C Data is divided into 100 sec bins |
 |
 |
| Module-wise count rates for Quadrant D Data is divided into 100 sec bins |
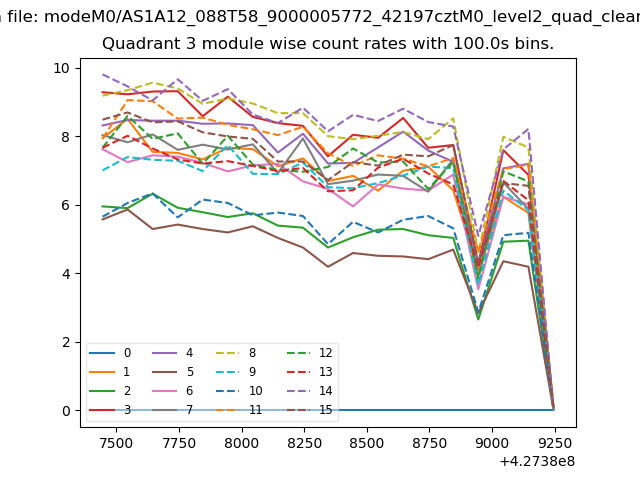 |
 |
| Parameter | Plot |
|---|---|
| CZT HV Monitor | 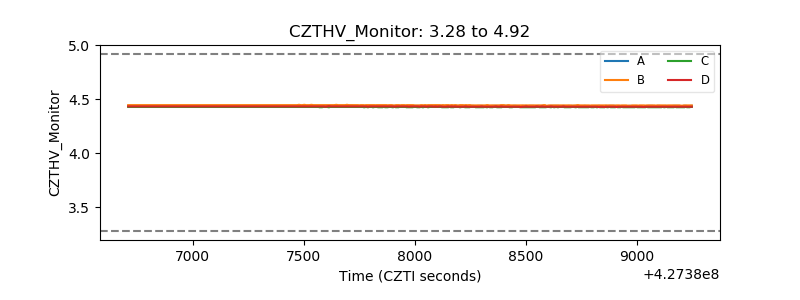 |
| D_VDD | 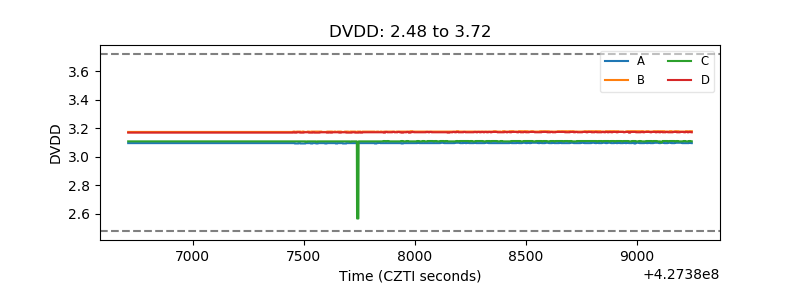 |
| Temperature 1 | 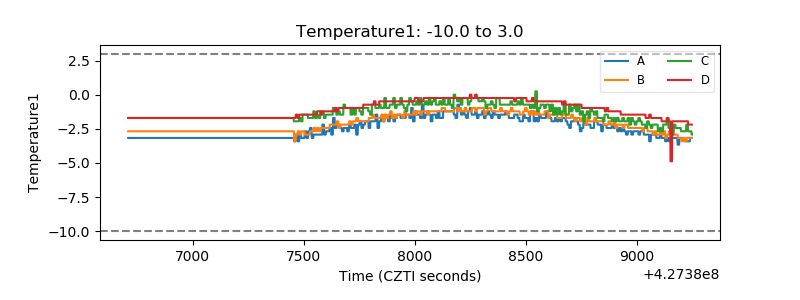 |
| Veto HV Monitor | 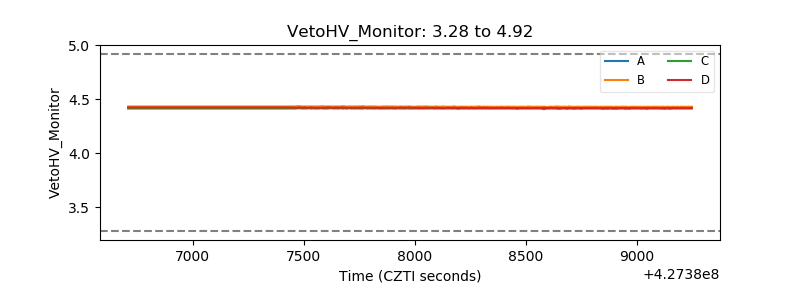 |
| Veto LLD | 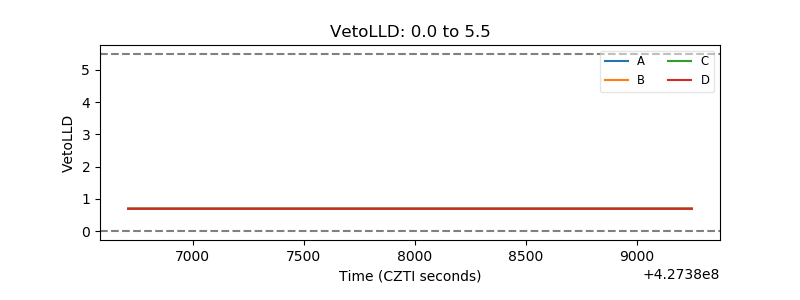 |
| Alpha Counter | 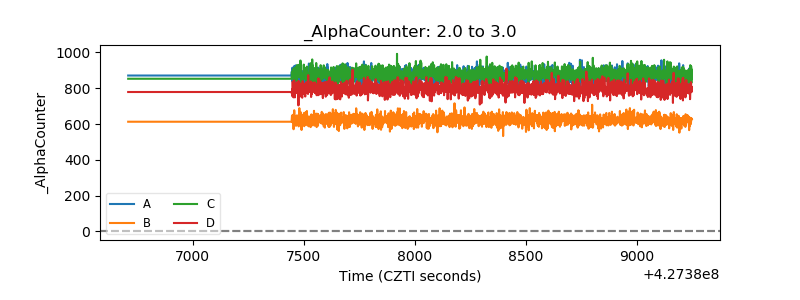 |
| _CPM_Rate | 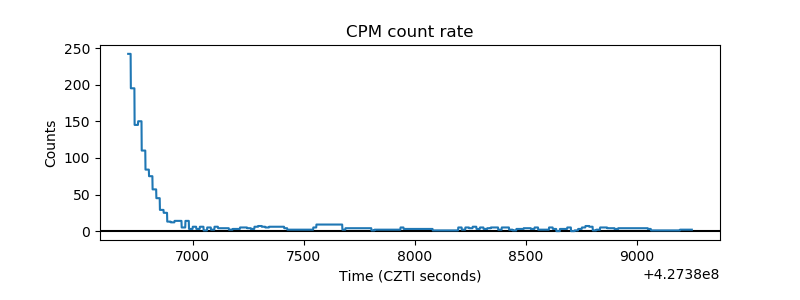 |
| CZT Counter | 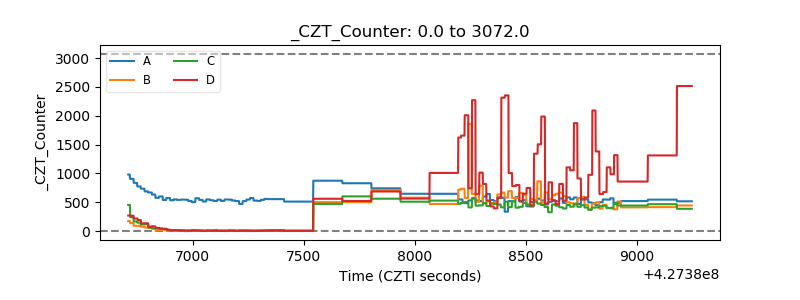 |
| +2.5 Volts monitor | 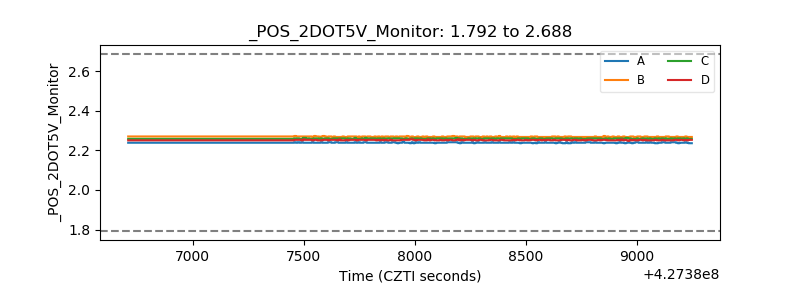 |
| +5 Volts monitor | 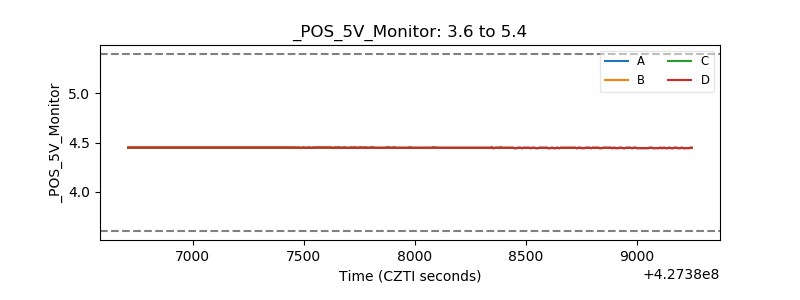 |
| _ROLL_ROT | 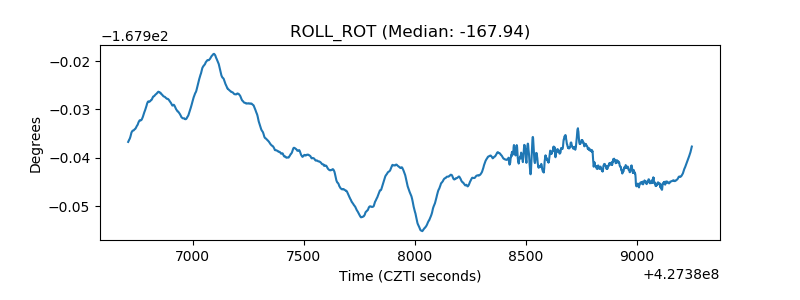 |
| _Roll_DEC | 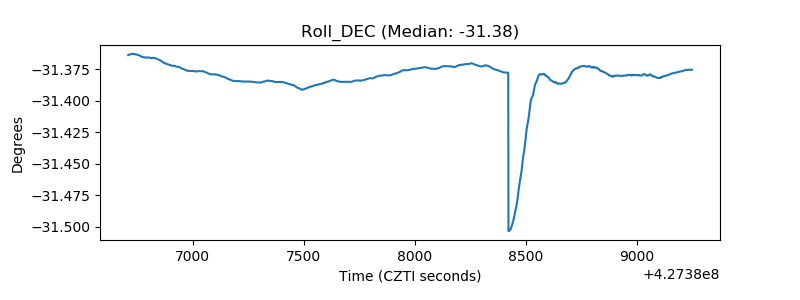 |
| _Roll_RA | 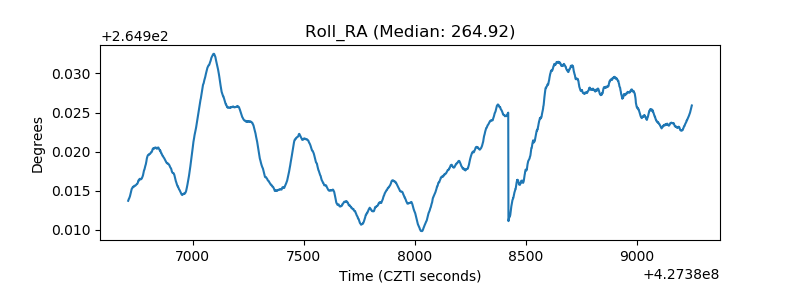 |
| Veto Counter | 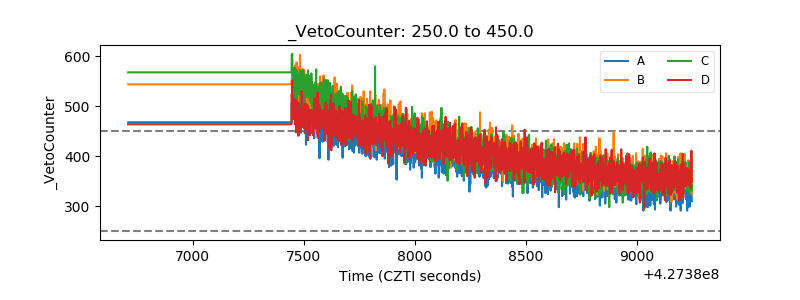 |