| Param | Original file | Final file |
|---|---|---|
| Filename | modeM0/AS1A12_088T59_9000005774_42197cztM0_level2.fits | modeM0/AS1A12_088T59_9000005774_42197cztM0_level2_quad_clean.evt |
| Size (bytes) | 229,011,840 | 57,683,520 |
| Size | 218.4 MB | 55.0 MB |
| Events in quadrant A | 1,954,974 | 396,101 |
| Events in quadrant B | 1,684,352 | 404,566 |
| Events in quadrant C | 1,579,540 | 381,158 |
| Events in quadrant D | 3,000,345 | 330,912 |
| Mode SS | |||
|---|---|---|---|
| Quadrant | BADHDUFLAG | Total packets | Discarded packets |
| A | 0 | 68 | 0 |
| B | 0 | 68 | 0 |
| C | 0 | 68 | 0 |
| D | 0 | 68 | 0 |
| Mode M9 | |||
|---|---|---|---|
| Quadrant | BADHDUFLAG | Total packets | Discarded packets |
| A | 0 | 19 | 0 |
| B | 0 | 19 | 0 |
| C | 0 | 19 | 0 |
| D | 0 | 19 | 0 |
| Mode M0 | |||
|---|---|---|---|
| Quadrant | BADHDUFLAG | Total packets | Discarded packets |
| A | 0 | 7844 | 1 |
| B | 0 | 7260 | 1 |
| C | 0 | 6741 | 1 |
| D | 0 | 11190 | 1 |
| Quadrant | Total seconds | Saturated seconds | Saturation percentage |
|---|---|---|---|
| A | 3297 | 50 | 1.516530% |
| B | 3297 | 17 | 0.515620% |
| C | 3297 | 2 | 0.060661% |
| D | 3296 | 297 | 9.010922% |
Noise dominated data is calculated using 1-second bins in cleaned event files. If a bin has >2000 counts, and if more than 50% of those come from <1% of pixels, then it is considered to be noise-dominated and hence unusable.
| Quadrant | # 1 sec bins | Bins with >0 counts | Bins with >2000 counts | High rate bins dominated by noise | Noise dominated (total time) | Noise dominated (detector-on time) | Marked lightcurve |
|---|---|---|---|---|---|---|---|
| A | 5180 | 3298 | 28 | 28 | 0.54% | 0.85% |  |
| B | 5180 | 3298 | 10 | 10 | 0.19% | 0.30% |  |
| C | 5180 | 3298 | 1 | 1 | 0.02% | 0.03% |  |
| D | 5179 | 3297 | 289 | 289 | 5.58% | 8.77% |  |
Top three noisy pixels from each quadrant. If the there are fewer than three noisy pixels in the level2.evt file, extra rows are filled as -1
| Pixel properties | Quadrant properties | ||||||
|---|---|---|---|---|---|---|---|
| Quadrant | DetID | PixID | Counts | Sigma | Mean | Median | Sigma |
| A | 10 | 83 | 330526 | 4202.82 | 377 | 369 | 78.6 |
| A | 15 | 223 | 139429 | 1770.2 | 377 | 369 | 78.6 |
| A | 13 | 248 | 21194 | 265.1 | 377 | 369 | 78.6 |
| B | 0 | 229 | 127557 | 1719.96 | 376 | 365 | 74.0 |
| B | 3 | 112 | 30315 | 405.0 | 376 | 365 | 74.0 |
| B | 0 | 156 | 18309 | 242.65 | 376 | 365 | 74.0 |
| C | 15 | 214 | 136580 | 1577.34 | 364 | 367 | 86.4 |
| C | 15 | 111 | 10268 | 114.65 | 364 | 367 | 86.4 |
| C | 0 | 207 | 3963 | 41.64 | 364 | 367 | 86.4 |
| D | 1 | 52 | 1204420 | 13524.87 | 353 | 343 | 89.0 |
| D | 12 | 233 | 179147 | 2008.43 | 353 | 343 | 89.0 |
| D | 1 | 47 | 95398 | 1067.71 | 353 | 343 | 89.0 |
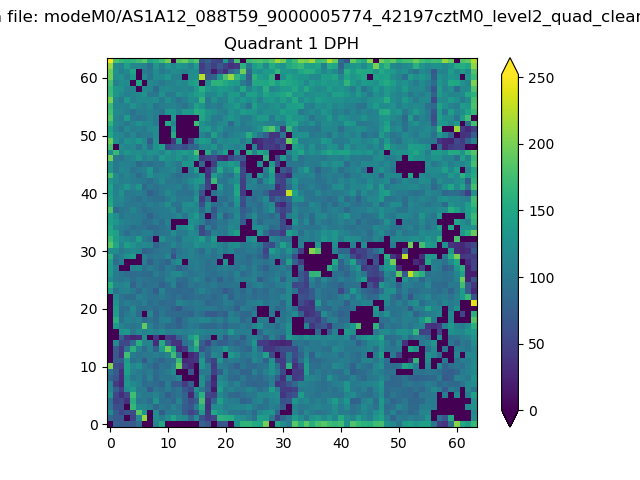
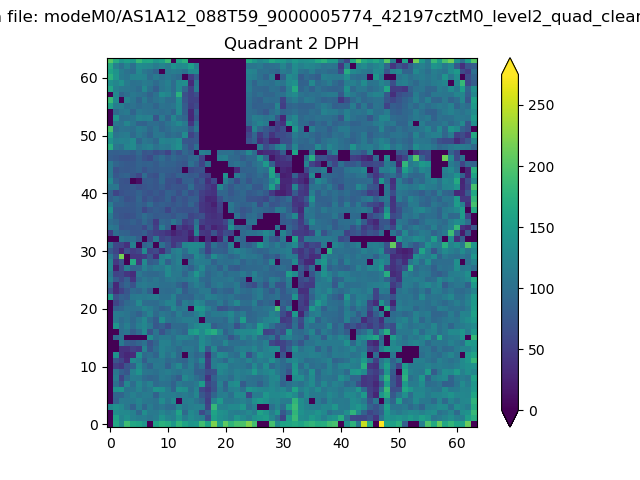
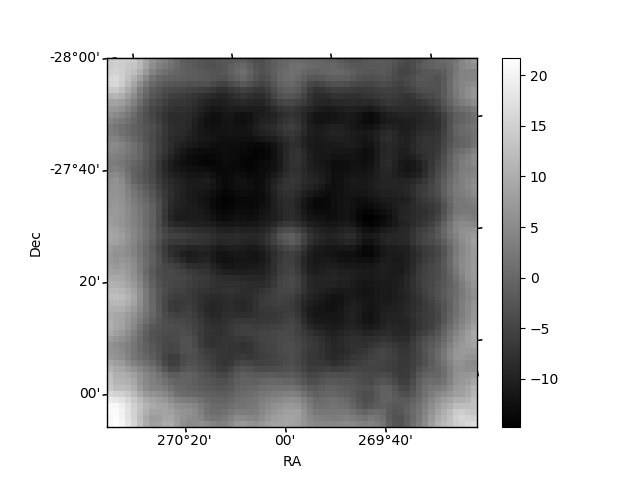
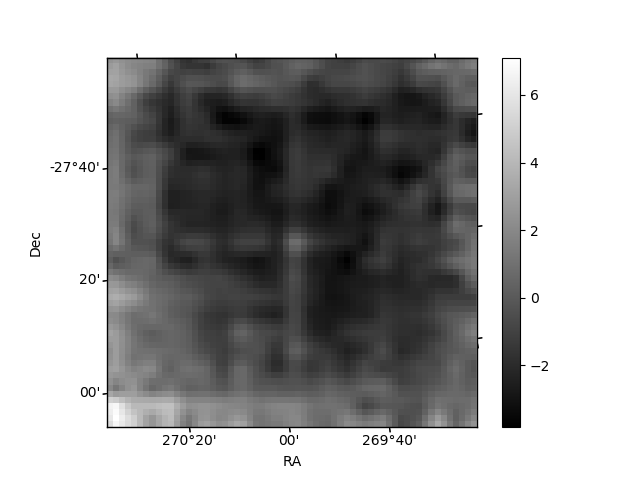
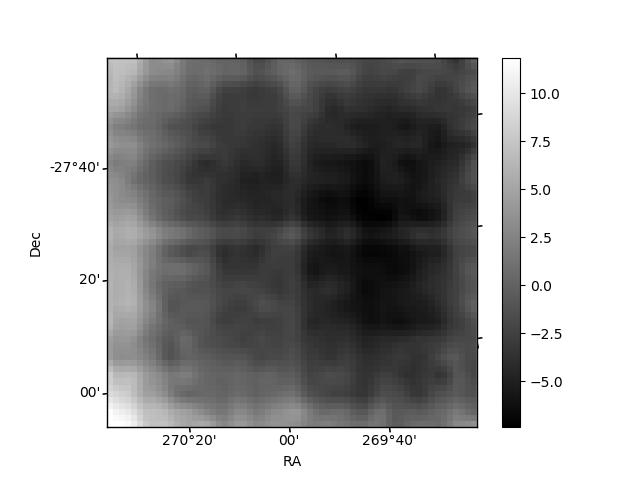
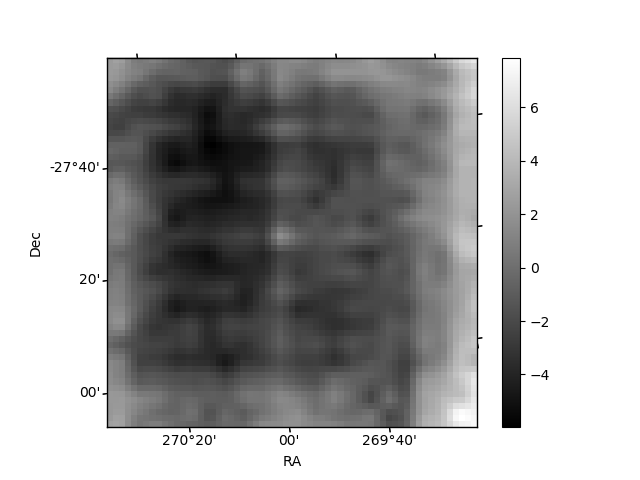
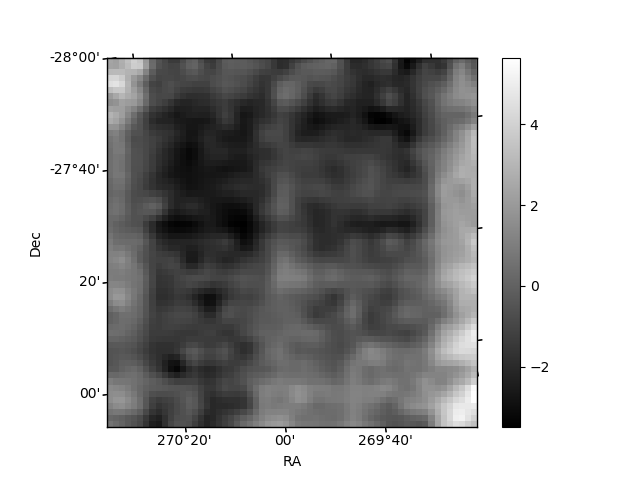
Histogram calculated using DETX and DETY for each event in the final _common_clean file
| Quadrant A |  |
 |
Quadrant B |
|---|---|---|---|
| Quadrant D | 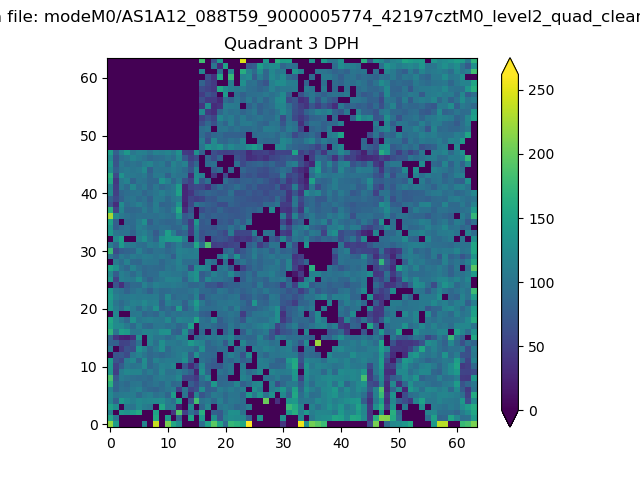 |
 |
Quadrant C |
| Plot type | Count rate plots | Images |
|---|---|---|
| Comparison with Poisson distribution Blue bars denote a histogram of data divided into 1 sec bins. Red curve is a Poisson curve with rate = median count rate of data. |
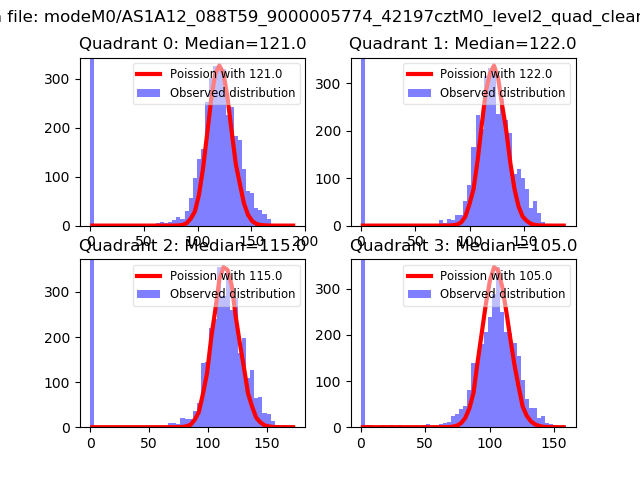 |
 |
| Quadrant-wise count rates Data is divided into 100 sec bins |
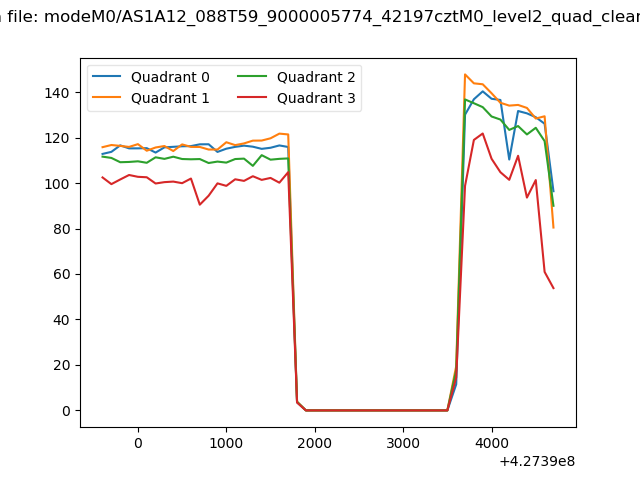 |
|
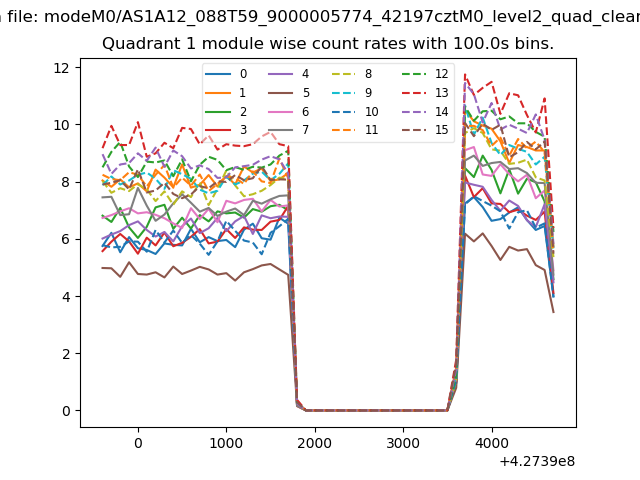
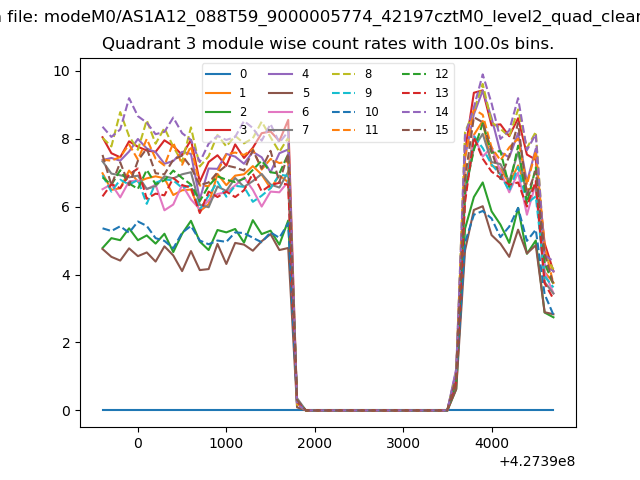
| Module-wise count rates for Quadrant A Data is divided into 100 sec bins |
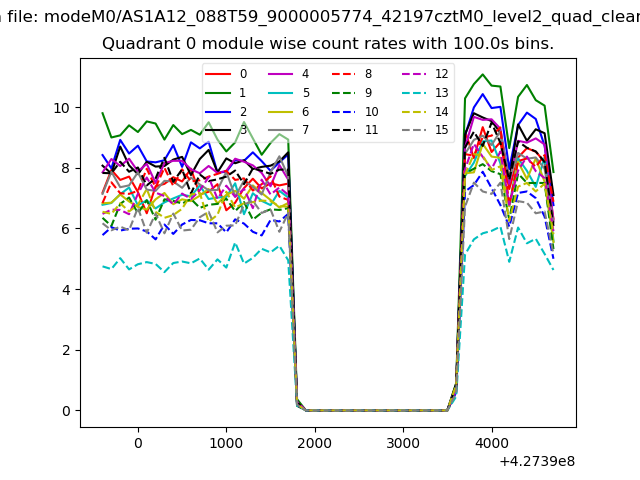 |
 |
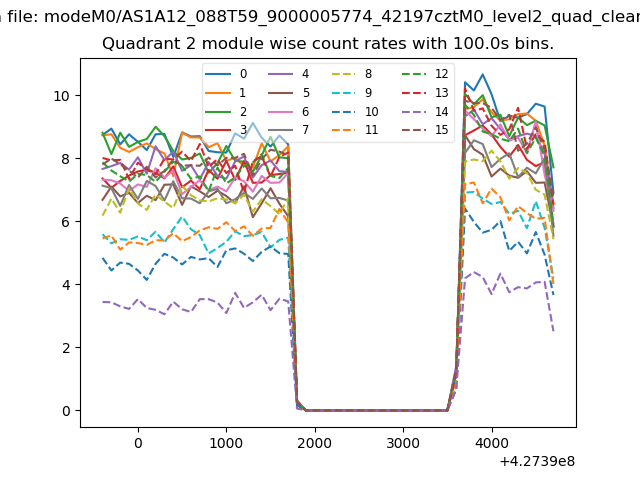
| Module-wise count rates for Quadrant B Data is divided into 100 sec bins |
 |
 |
| Module-wise count rates for Quadrant C Data is divided into 100 sec bins |
 |
 |
| Module-wise count rates for Quadrant D Data is divided into 100 sec bins |
 |
 |
| Parameter | Plot |
|---|---|
| CZT HV Monitor |  |
| D_VDD | 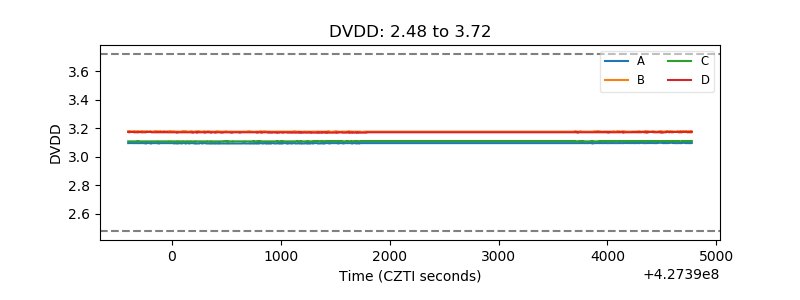 |
| Temperature 1 | 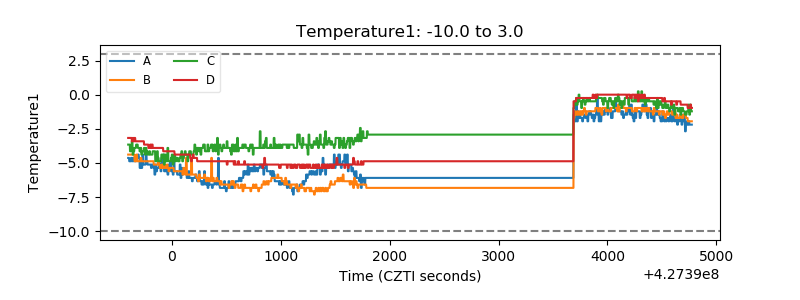 |
| Veto HV Monitor | 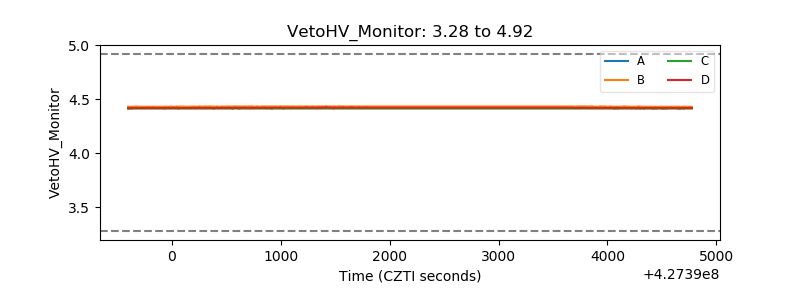 |
| Veto LLD | 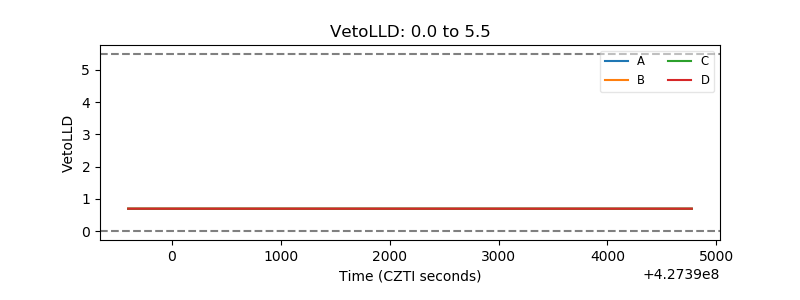 |
| Alpha Counter | 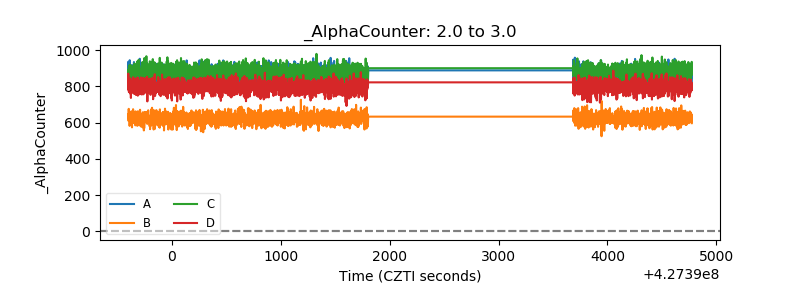 |
| _CPM_Rate | 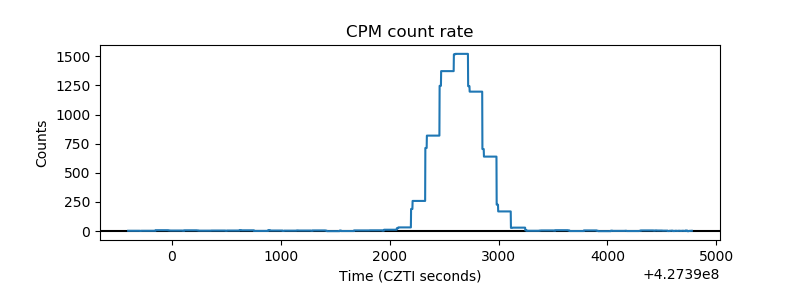 |
| CZT Counter | 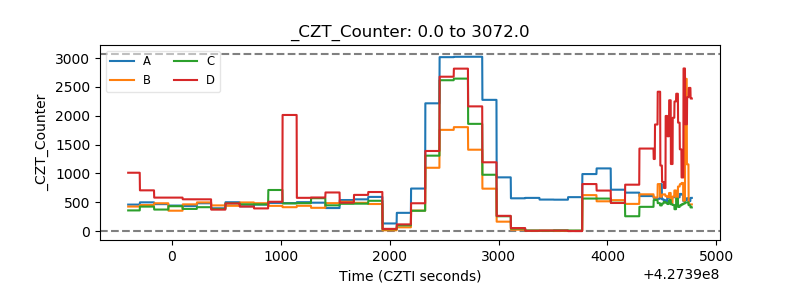 |
| +2.5 Volts monitor | 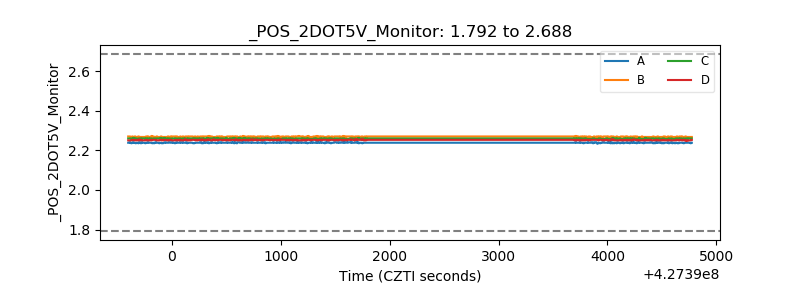 |
| +5 Volts monitor | 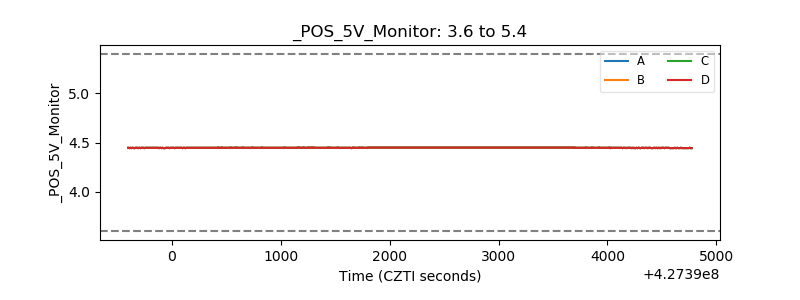 |
| _ROLL_ROT | 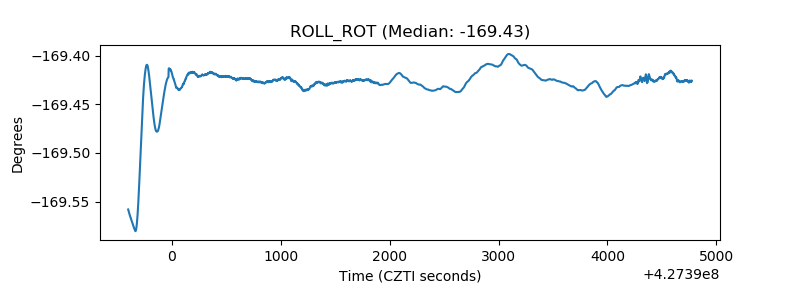 |
| _Roll_DEC |  |
| _Roll_RA | 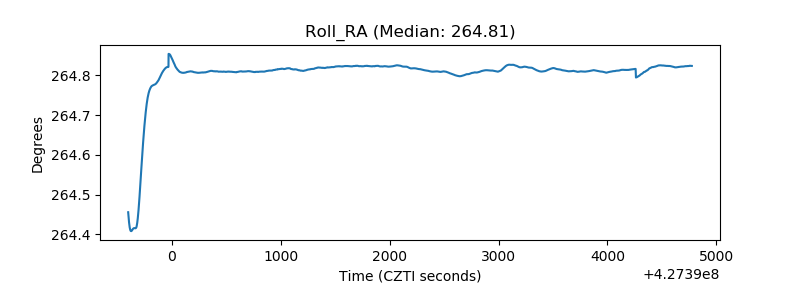 |
| Veto Counter | 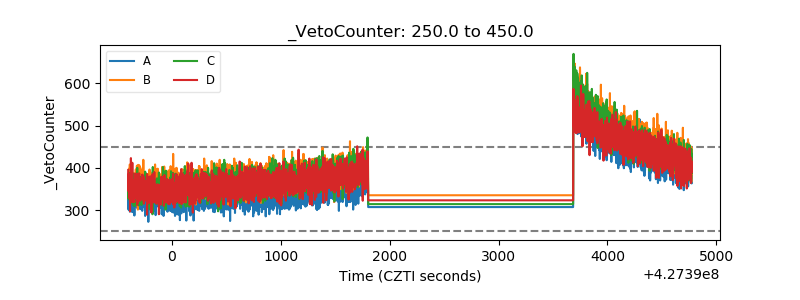 |