| Param | Original file | Final file |
|---|---|---|
| Filename | modeM0/AS1A12_088T59_9000005774_42198cztM0_level2.fits | modeM0/AS1A12_088T59_9000005774_42198cztM0_level2_quad_clean.evt |
| Size (bytes) | 395,179,200 | 92,606,400 |
| Size | 376.9 MB | 88.3 MB |
| Events in quadrant A | 3,144,136 | 648,896 |
| Events in quadrant B | 2,823,483 | 660,653 |
| Events in quadrant C | 2,521,706 | 619,269 |
| Events in quadrant D | 5,731,718 | 508,271 |
| Mode SS | |||
|---|---|---|---|
| Quadrant | BADHDUFLAG | Total packets | Discarded packets |
| A | 0 | 108 | 0 |
| B | 0 | 108 | 0 |
| C | 0 | 108 | 0 |
| D | 0 | 108 | 0 |
| Mode M9 | |||
|---|---|---|---|
| Quadrant | BADHDUFLAG | Total packets | Discarded packets |
| A | 0 | 21 | 0 |
| B | 0 | 22 | 0 |
| C | 0 | 22 | 0 |
| D | 0 | 22 | 0 |
| Mode M0 | |||
|---|---|---|---|
| Quadrant | BADHDUFLAG | Total packets | Discarded packets |
| A | 0 | 12501 | 2 |
| B | 0 | 11898 | 2 |
| C | 0 | 10689 | 2 |
| D | 0 | 20672 | 2 |
| Quadrant | Total seconds | Saturated seconds | Saturation percentage |
|---|---|---|---|
| A | 5237 | 65 | 1.241169% |
| B | 5237 | 33 | 0.630132% |
| C | 5237 | 6 | 0.114569% |
| D | 5237 | 768 | 14.664884% |
Noise dominated data is calculated using 1-second bins in cleaned event files. If a bin has >2000 counts, and if more than 50% of those come from <1% of pixels, then it is considered to be noise-dominated and hence unusable.
| Quadrant | # 1 sec bins | Bins with >0 counts | Bins with >2000 counts | High rate bins dominated by noise | Noise dominated (total time) | Noise dominated (detector-on time) | Marked lightcurve |
|---|---|---|---|---|---|---|---|
| A | 7240 | 5238 | 35 | 35 | 0.48% | 0.67% |  |
| B | 7240 | 5238 | 23 | 23 | 0.32% | 0.44% | 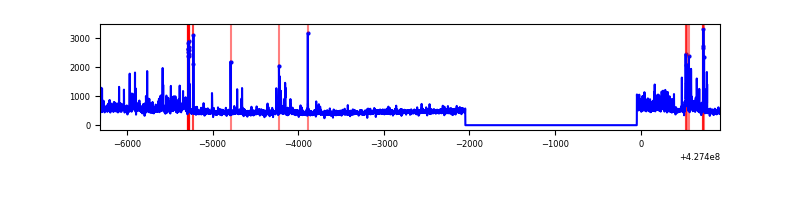 |
| C | 7240 | 5238 | 3 | 3 | 0.04% | 0.06% | 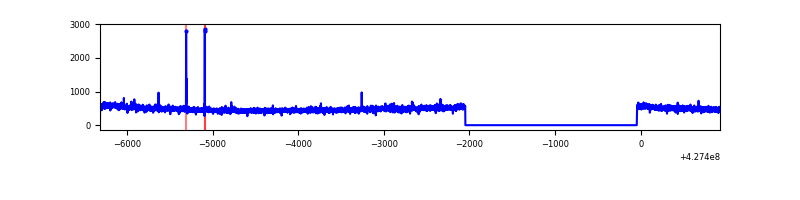 |
| D | 7240 | 5238 | 787 | 787 | 10.87% | 15.02% | 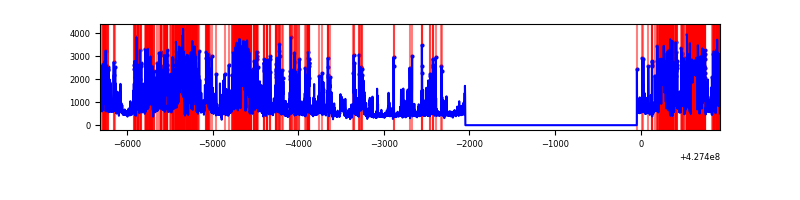 |
Top three noisy pixels from each quadrant. If the there are fewer than three noisy pixels in the level2.evt file, extra rows are filled as -1
| Pixel properties | Quadrant properties | ||||||
|---|---|---|---|---|---|---|---|
| Quadrant | DetID | PixID | Counts | Sigma | Mean | Median | Sigma |
| A | 10 | 83 | 593119 | 4767.69 | 608 | 597 | 124.3 |
| A | 15 | 223 | 145332 | 1164.6 | 608 | 597 | 124.3 |
| A | 7 | 3 | 30252 | 238.62 | 608 | 597 | 124.3 |
| B | 0 | 229 | 278932 | 2385.25 | 603 | 588 | 116.7 |
| B | 3 | 112 | 78015 | 663.5 | 603 | 588 | 116.7 |
| B | 0 | 156 | 35276 | 297.25 | 603 | 588 | 116.7 |
| C | 15 | 214 | 221035 | 1633.2 | 580 | 585 | 135.0 |
| C | 0 | 207 | 12281 | 86.65 | 580 | 585 | 135.0 |
| C | 15 | 111 | 10558 | 73.88 | 580 | 585 | 135.0 |
| D | 1 | 52 | 2096632 | 15675.08 | 547 | 533 | 133.7 |
| D | 12 | 233 | 834782 | 6238.69 | 547 | 533 | 133.7 |
| D | 1 | 47 | 329787 | 2462.23 | 547 | 533 | 133.7 |
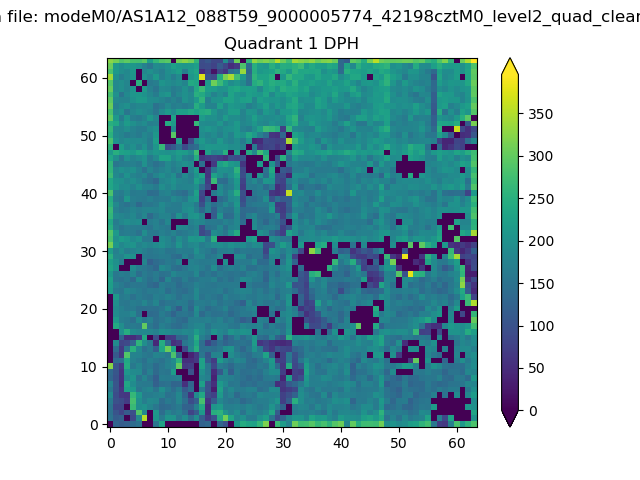
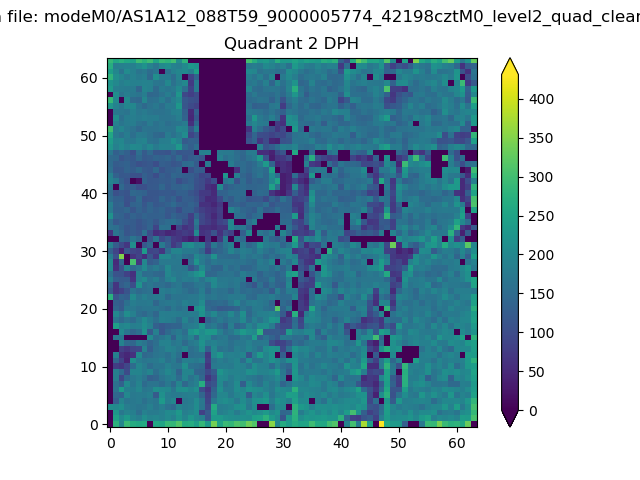
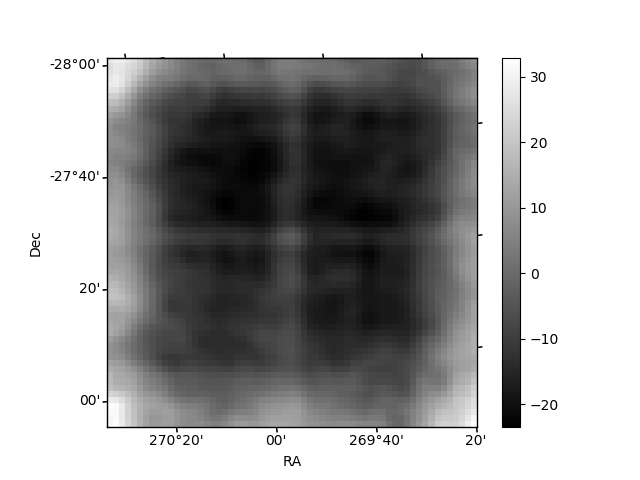
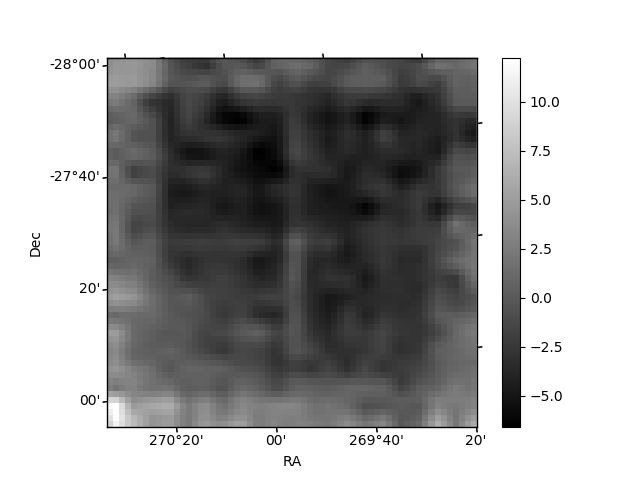
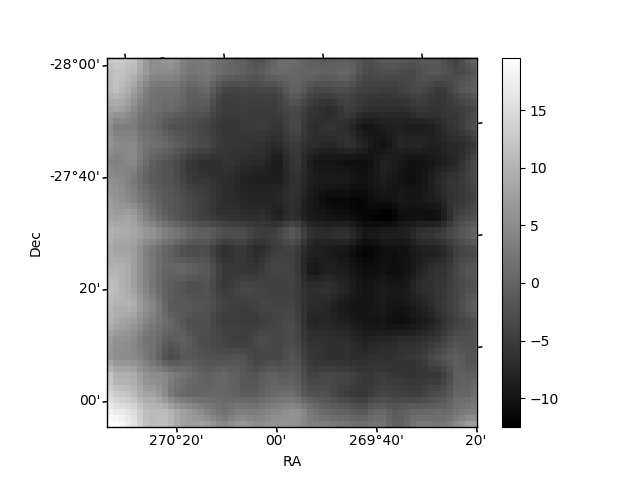
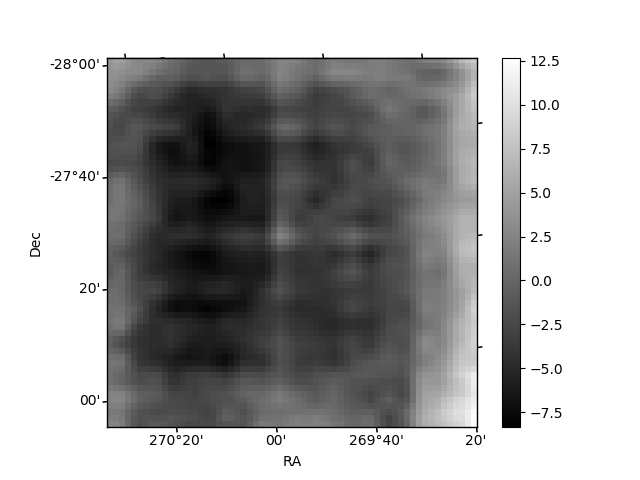
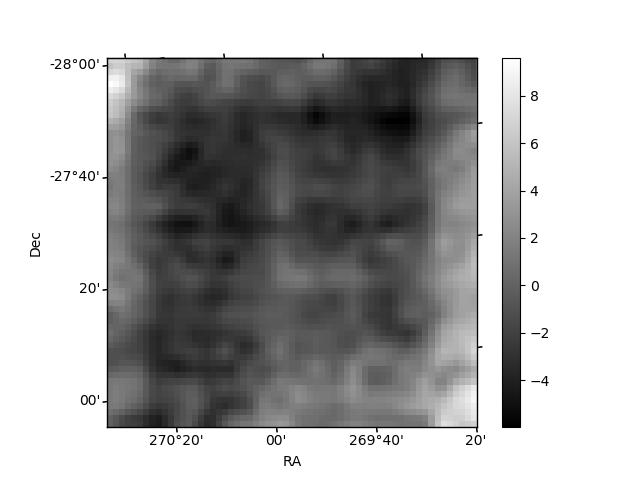
Histogram calculated using DETX and DETY for each event in the final _common_clean file
| Quadrant A | 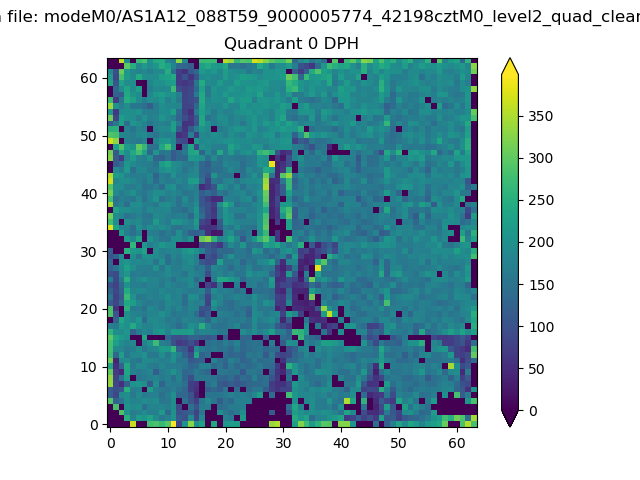 |
 |
Quadrant B |
|---|---|---|---|
| Quadrant D | 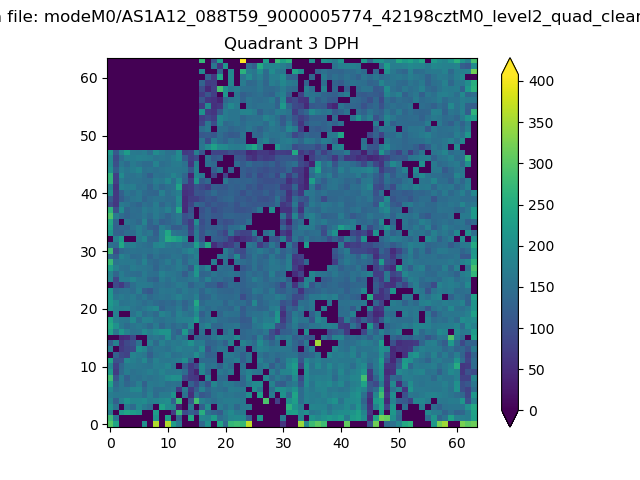 |
 |
Quadrant C |
| Plot type | Count rate plots | Images |
|---|---|---|
| Comparison with Poisson distribution Blue bars denote a histogram of data divided into 1 sec bins. Red curve is a Poisson curve with rate = median count rate of data. |
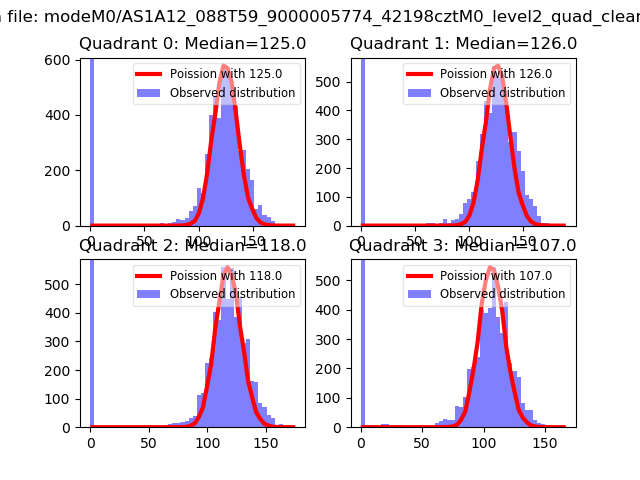 |
 |
| Quadrant-wise count rates Data is divided into 100 sec bins |
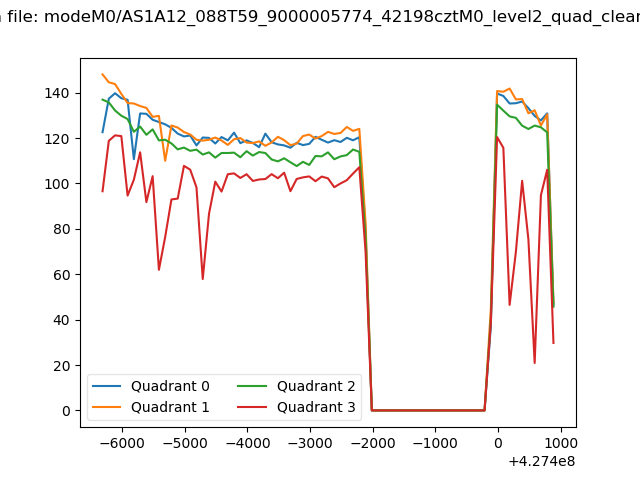 |
|
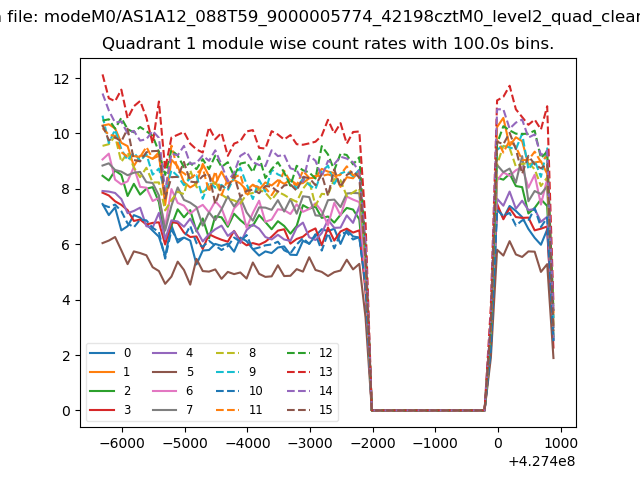
| Module-wise count rates for Quadrant A Data is divided into 100 sec bins |
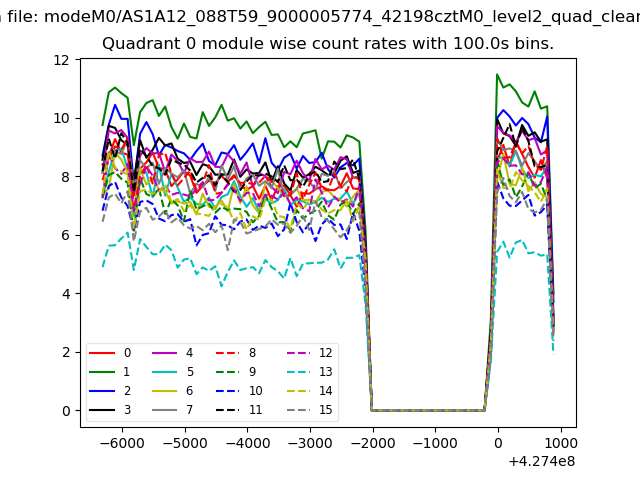 |
 |
| Module-wise count rates for Quadrant B Data is divided into 100 sec bins |
 |
 |
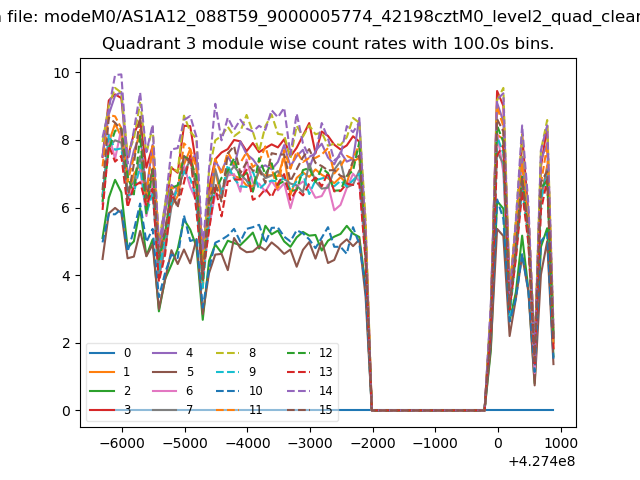
| Module-wise count rates for Quadrant C Data is divided into 100 sec bins |
 |
 |
| Module-wise count rates for Quadrant D Data is divided into 100 sec bins |
 |
 |
| Parameter | Plot |
|---|---|
| CZT HV Monitor | 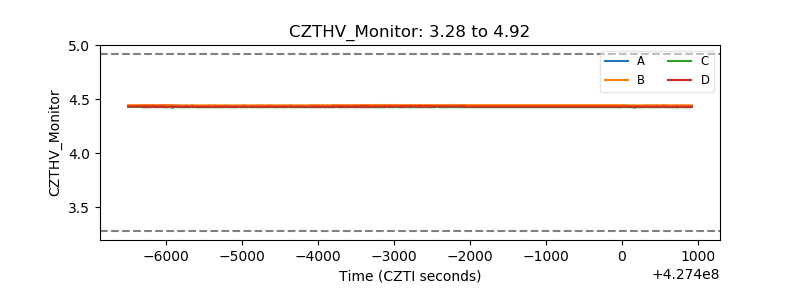 |
| D_VDD | 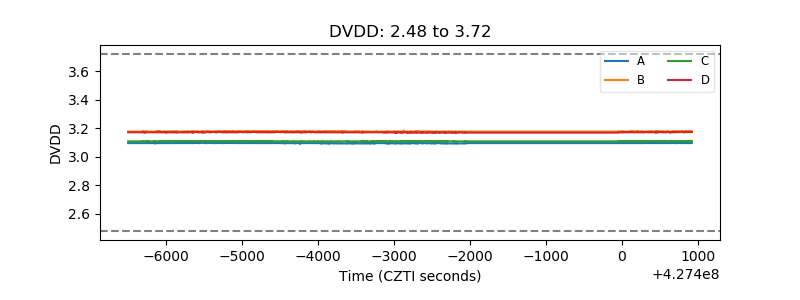 |
| Temperature 1 | 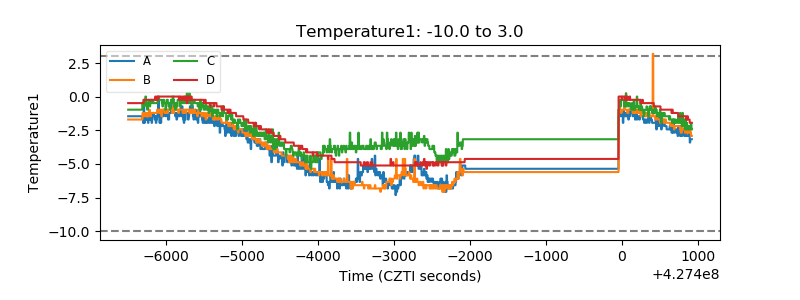 |
| Veto HV Monitor | 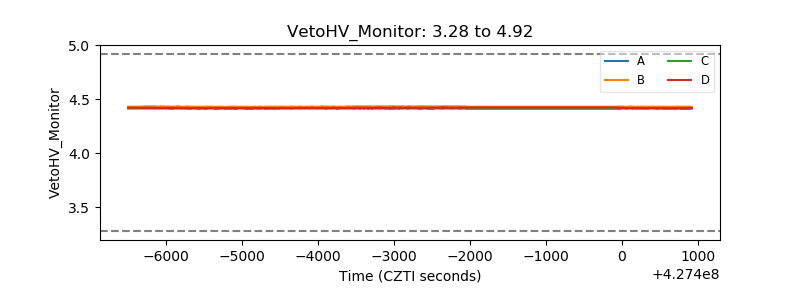 |
| Veto LLD | 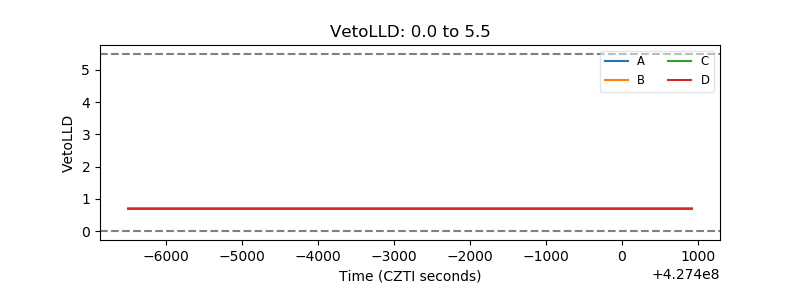 |
| Alpha Counter |  |
| _CPM_Rate |  |
| CZT Counter | 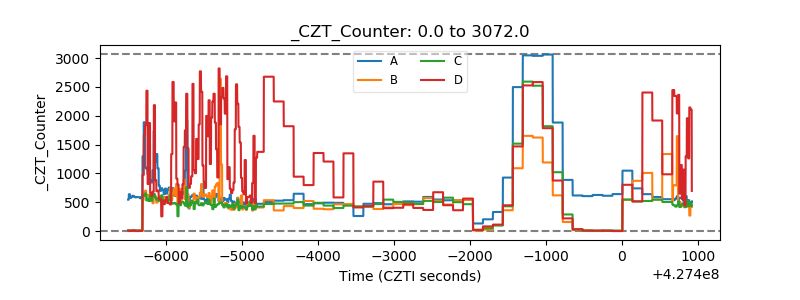 |
| +2.5 Volts monitor |  |
| +5 Volts monitor | 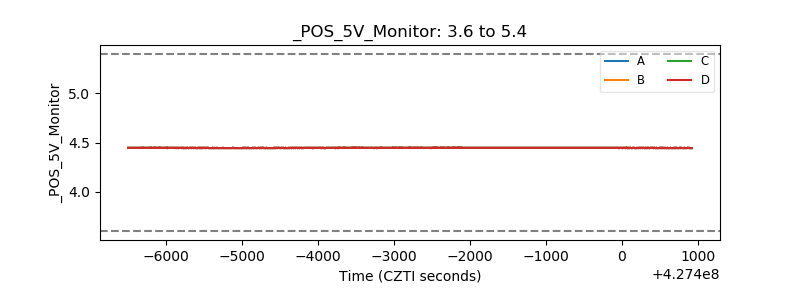 |
| _ROLL_ROT | 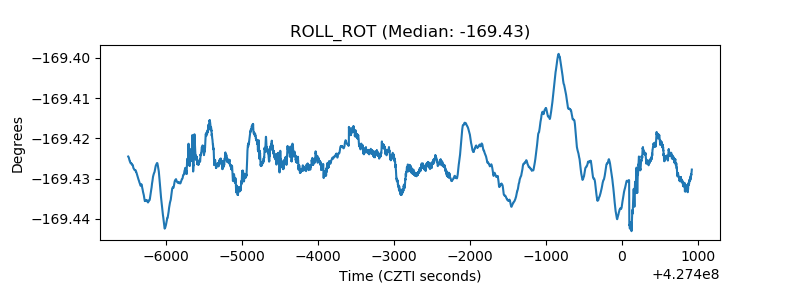 |
| _Roll_DEC | 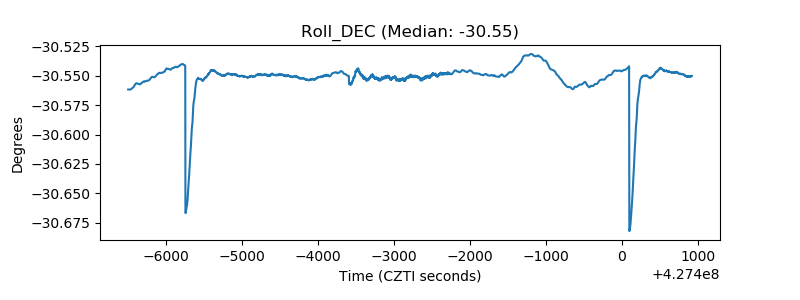 |
| _Roll_RA | 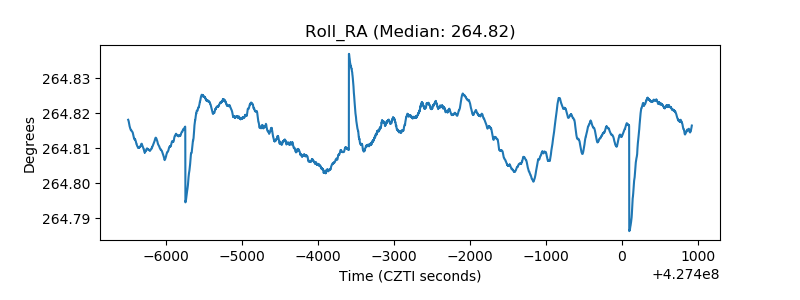 |
| Veto Counter | 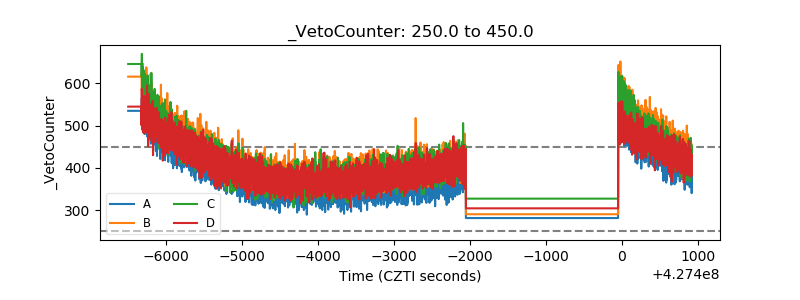 |