| Param | Original file | Final file |
|---|---|---|
| Filename | modeM0/AS1A12_088T59_9000005774_42199cztM0_level2.fits | modeM0/AS1A12_088T59_9000005774_42199cztM0_level2_quad_clean.evt |
| Size (bytes) | 330,333,120 | 83,603,520 |
| Size | 315.0 MB | 79.7 MB |
| Events in quadrant A | 2,774,569 | 581,213 |
| Events in quadrant B | 2,434,398 | 594,943 |
| Events in quadrant C | 2,244,894 | 556,401 |
| Events in quadrant D | 4,404,388 | 466,222 |
| Mode SS | |||
|---|---|---|---|
| Quadrant | BADHDUFLAG | Total packets | Discarded packets |
| A | 0 | 96 | 0 |
| B | 0 | 96 | 0 |
| C | 0 | 96 | 0 |
| D | 0 | 96 | 0 |
| Mode M9 | |||
|---|---|---|---|
| Quadrant | BADHDUFLAG | Total packets | Discarded packets |
| A | 0 | 31 | 0 |
| B | 0 | 31 | 0 |
| C | 0 | 32 | 0 |
| D | 0 | 32 | 0 |
| Mode M0 | |||
|---|---|---|---|
| Quadrant | BADHDUFLAG | Total packets | Discarded packets |
| A | 0 | 11126 | 2 |
| B | 0 | 10420 | 2 |
| C | 0 | 9591 | 2 |
| D | 0 | 16386 | 2 |
| Quadrant | Total seconds | Saturated seconds | Saturation percentage |
|---|---|---|---|
| A | 4742 | 33 | 0.695909% |
| B | 4742 | 16 | 0.337410% |
| C | 4742 | 4 | 0.084353% |
| D | 4742 | 510 | 10.754956% |
Noise dominated data is calculated using 1-second bins in cleaned event files. If a bin has >2000 counts, and if more than 50% of those come from <1% of pixels, then it is considered to be noise-dominated and hence unusable.
| Quadrant | # 1 sec bins | Bins with >0 counts | Bins with >2000 counts | High rate bins dominated by noise | Noise dominated (total time) | Noise dominated (detector-on time) | Marked lightcurve |
|---|---|---|---|---|---|---|---|
| A | 6834 | 4743 | 13 | 13 | 0.19% | 0.27% | 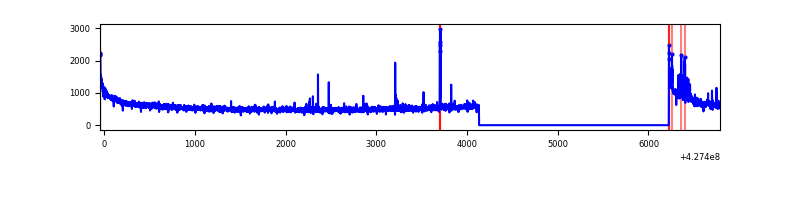 |
| B | 6834 | 4743 | 8 | 8 | 0.12% | 0.17% | 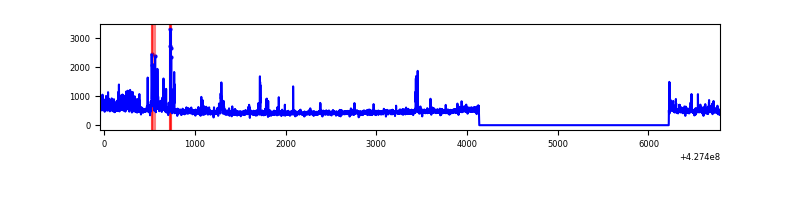 |
| C | 6834 | 4743 | 0 | 0 | 0.00% | 0.00% | 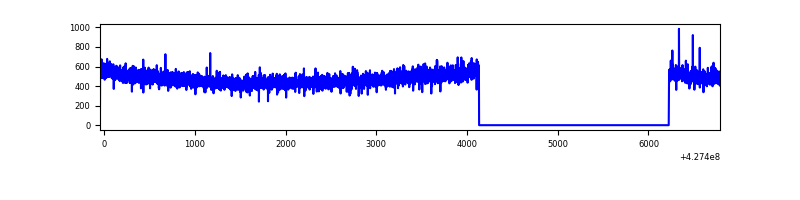 |
| D | 6834 | 4743 | 513 | 513 | 7.51% | 10.82% | 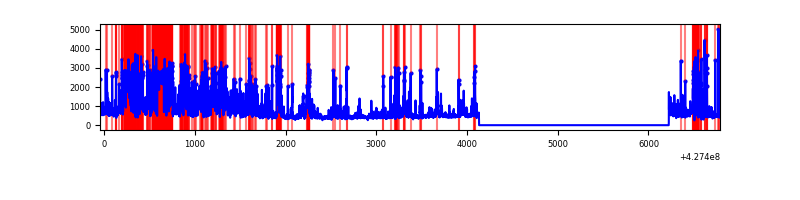 |
Top three noisy pixels from each quadrant. If the there are fewer than three noisy pixels in the level2.evt file, extra rows are filled as -1
| Pixel properties | Quadrant properties | ||||||
|---|---|---|---|---|---|---|---|
| Quadrant | DetID | PixID | Counts | Sigma | Mean | Median | Sigma |
| A | 10 | 83 | 547162 | 4911.91 | 544 | 535 | 111.3 |
| A | 15 | 223 | 66576 | 593.44 | 544 | 535 | 111.3 |
| A | 13 | 248 | 28847 | 254.41 | 544 | 535 | 111.3 |
| B | 0 | 229 | 217440 | 2070.76 | 542 | 529 | 104.7 |
| B | 5 | 255 | 23503 | 219.32 | 542 | 529 | 104.7 |
| B | 7 | 202 | 23339 | 217.76 | 542 | 529 | 104.7 |
| C | 15 | 214 | 199339 | 1636.21 | 521 | 525 | 121.5 |
| C | 0 | 207 | 6186 | 46.59 | 521 | 525 | 121.5 |
| C | 7 | 247 | 4059 | 29.08 | 521 | 525 | 121.5 |
| D | 1 | 52 | 1229715 | 10039.54 | 493 | 477 | 122.4 |
| D | 12 | 233 | 605460 | 4941.07 | 493 | 477 | 122.4 |
| D | 1 | 47 | 381509 | 3112.0 | 493 | 477 | 122.4 |
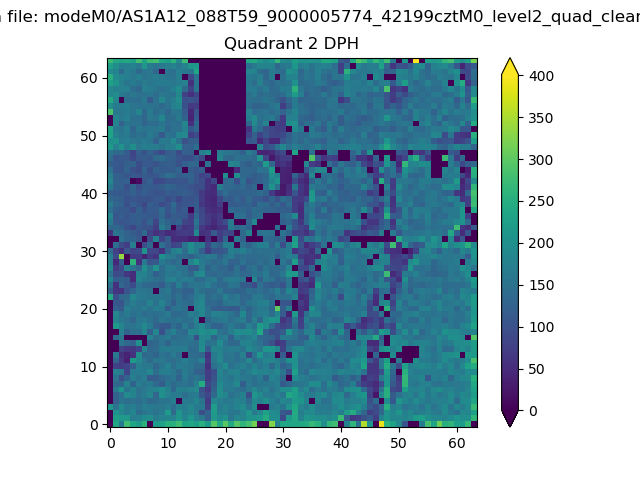
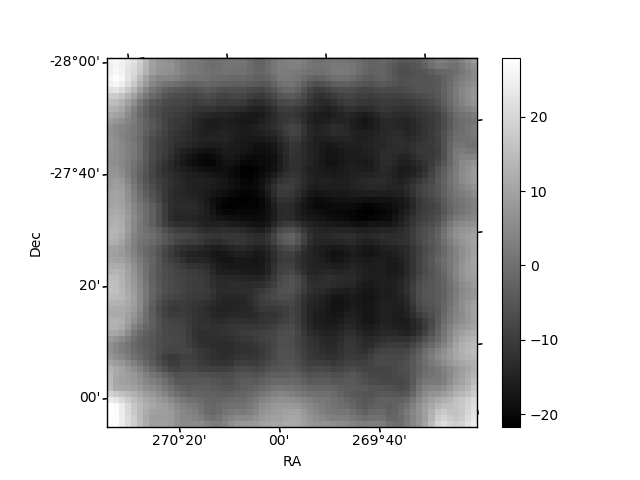
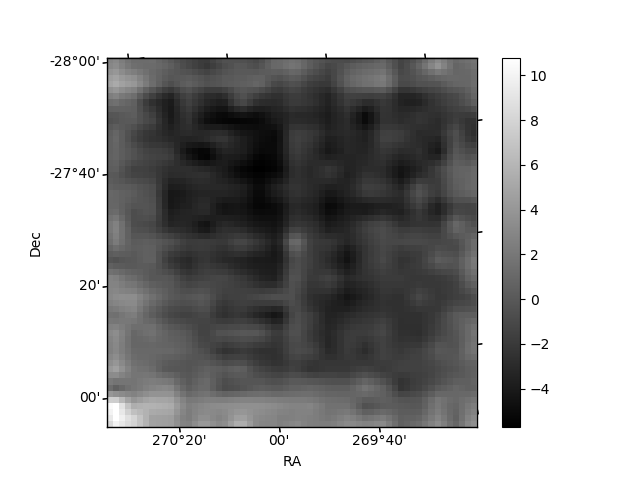
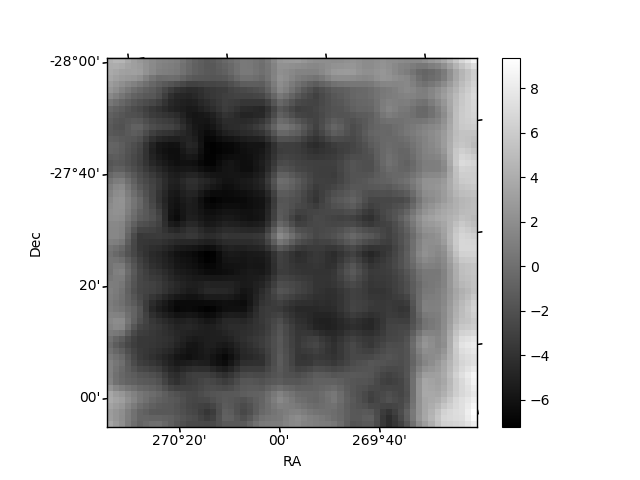
Histogram calculated using DETX and DETY for each event in the final _common_clean file
| Quadrant A | 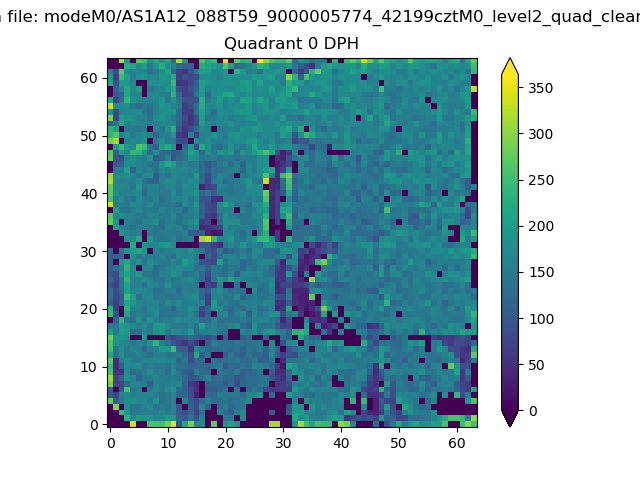 |
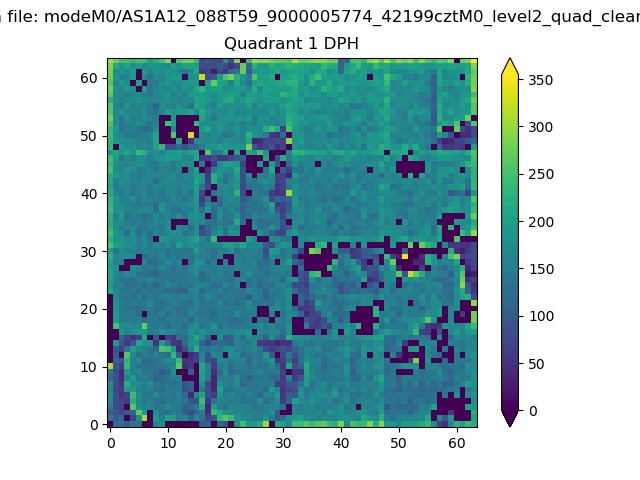 |
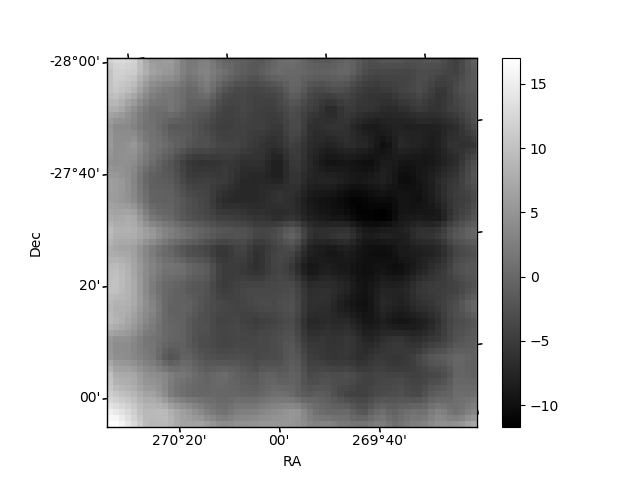
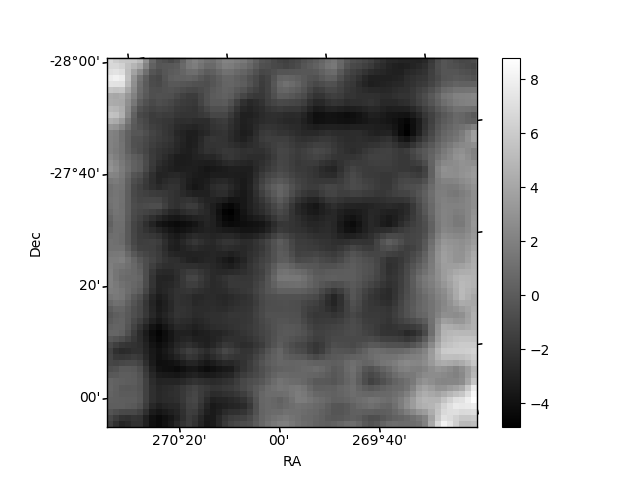
Quadrant B |
|---|---|---|---|
| Quadrant D | 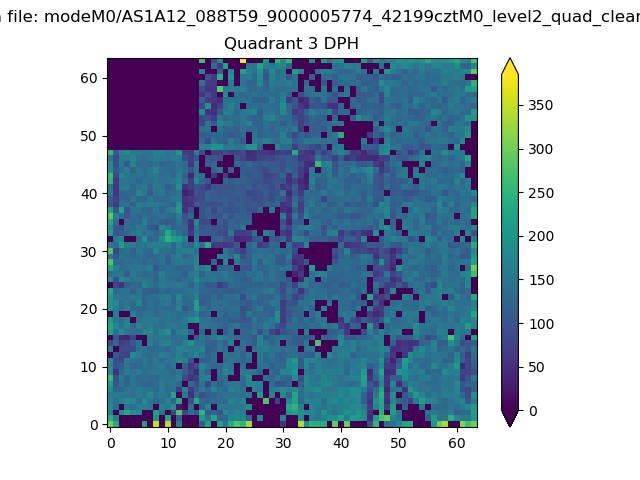 |
 |
Quadrant C |
| Plot type | Count rate plots | Images |
|---|---|---|
| Comparison with Poisson distribution Blue bars denote a histogram of data divided into 1 sec bins. Red curve is a Poisson curve with rate = median count rate of data. |
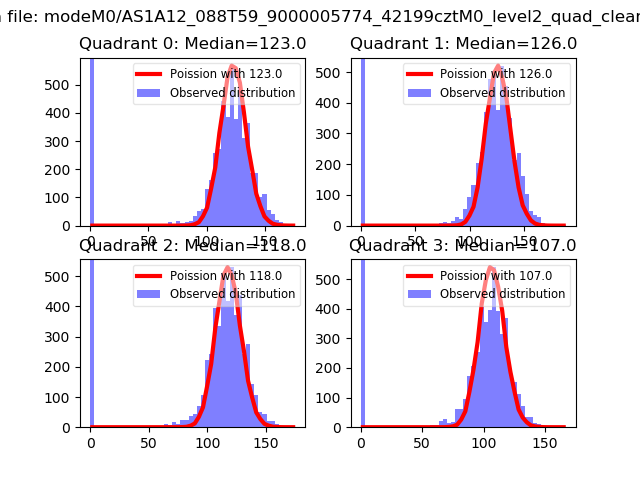 |
 |
| Quadrant-wise count rates Data is divided into 100 sec bins |
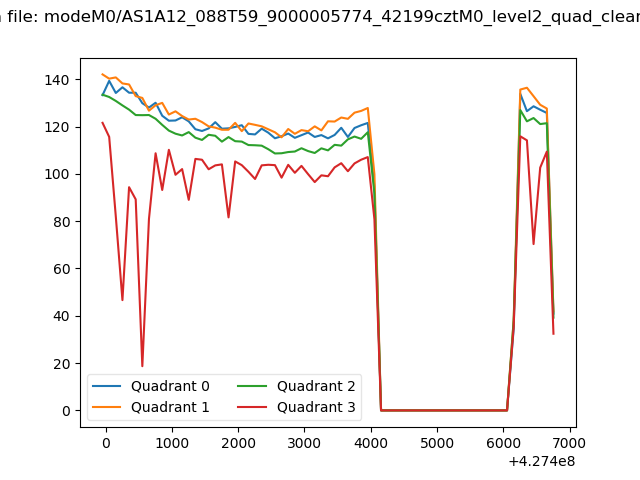 |
|
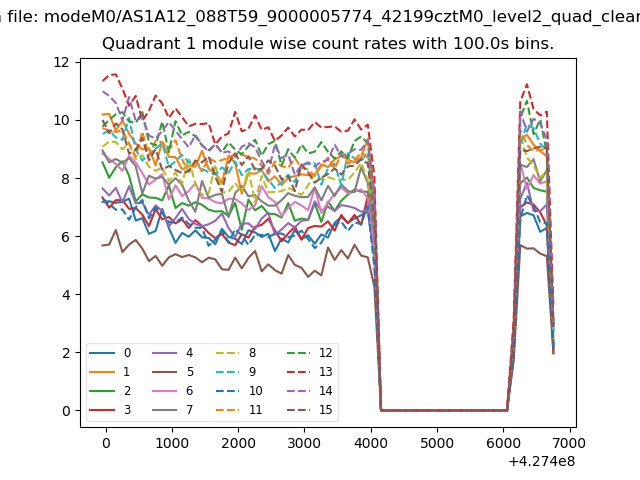
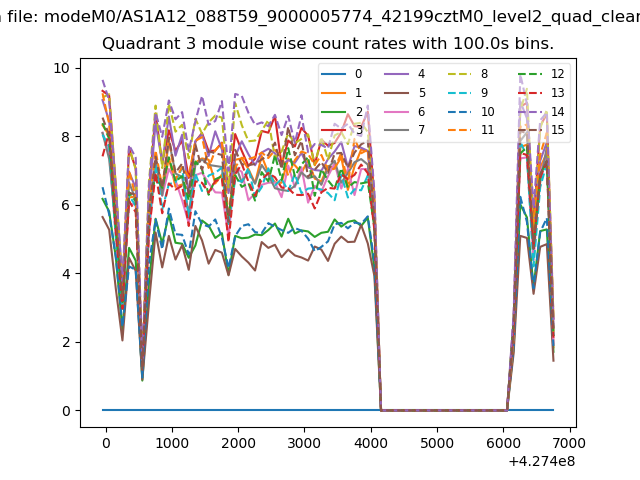
| Module-wise count rates for Quadrant A Data is divided into 100 sec bins |
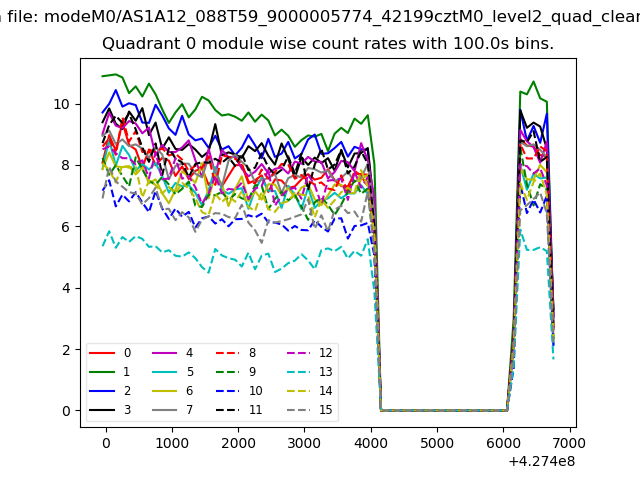 |
 |
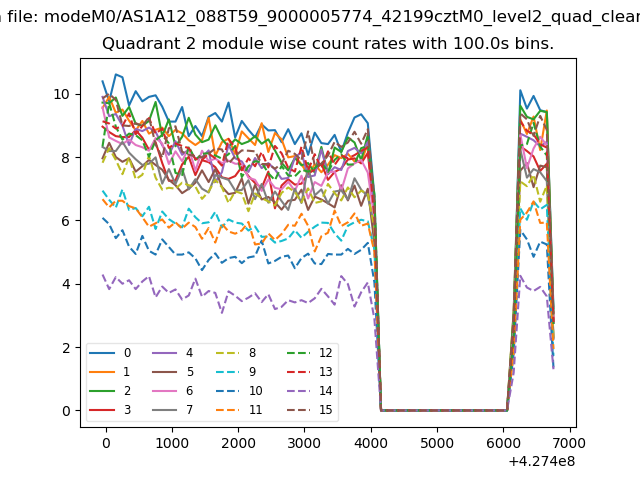
| Module-wise count rates for Quadrant B Data is divided into 100 sec bins |
 |
 |
| Module-wise count rates for Quadrant C Data is divided into 100 sec bins |
 |
 |
| Module-wise count rates for Quadrant D Data is divided into 100 sec bins |
 |
 |
| Parameter | Plot |
|---|---|
| CZT HV Monitor | 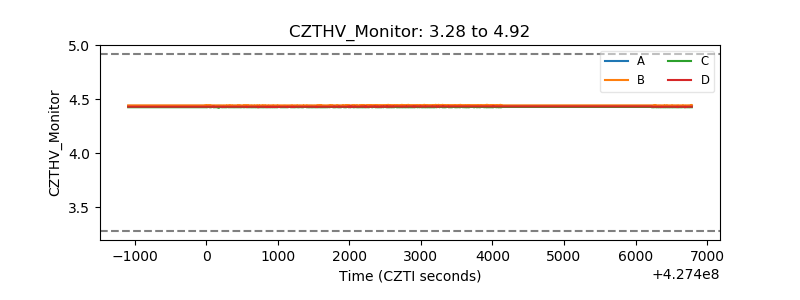 |
| D_VDD | 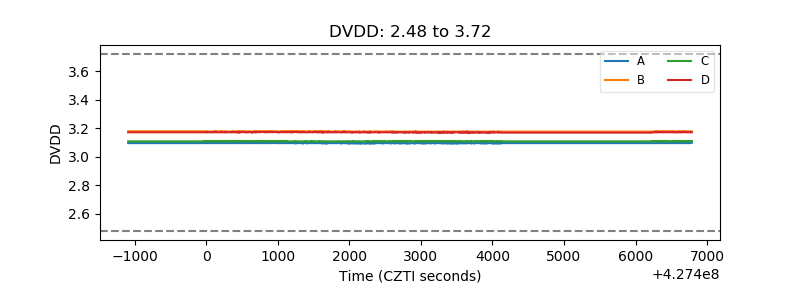 |
| Temperature 1 | 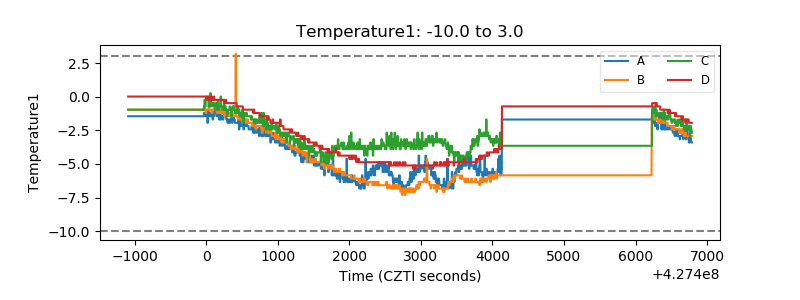 |
| Veto HV Monitor | 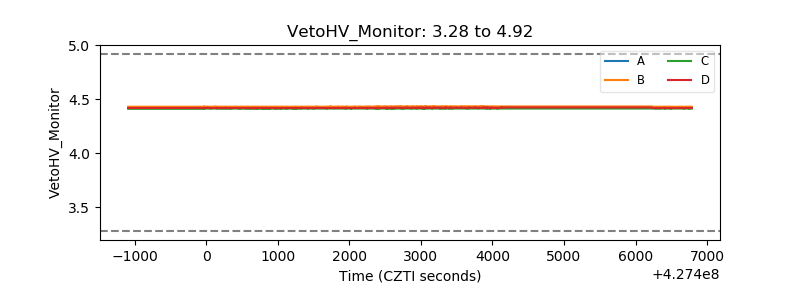 |
| Veto LLD | 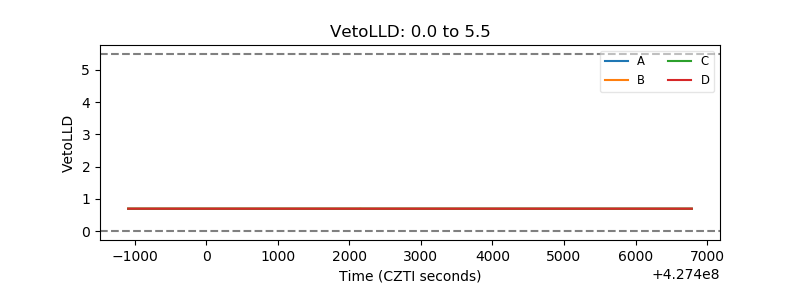 |
| Alpha Counter | 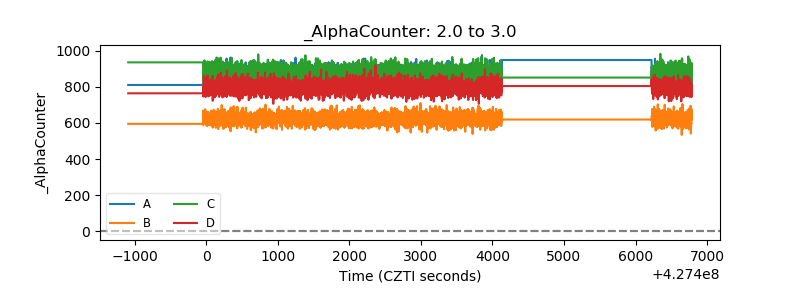 |
| _CPM_Rate | 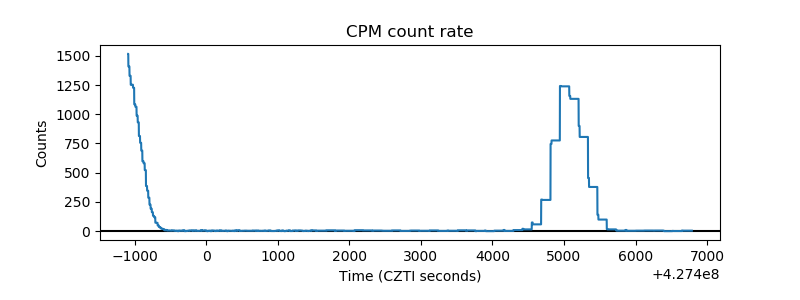 |
| CZT Counter | 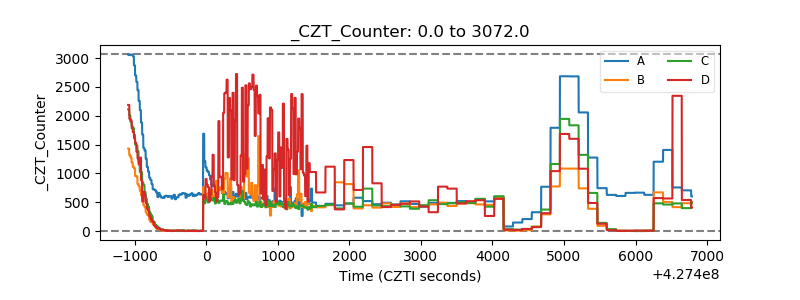 |
| +2.5 Volts monitor | 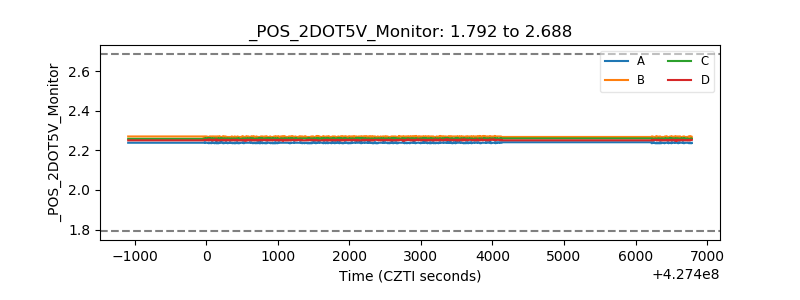 |
| +5 Volts monitor | 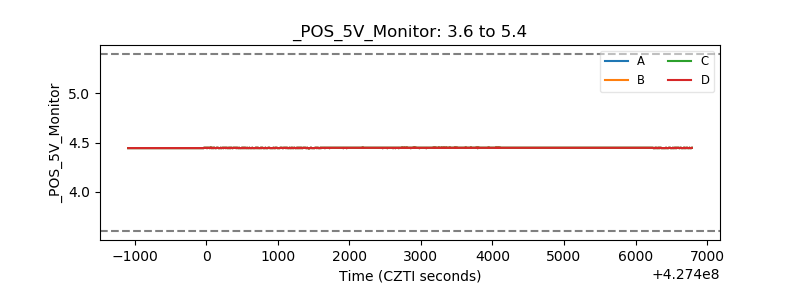 |
| _ROLL_ROT | 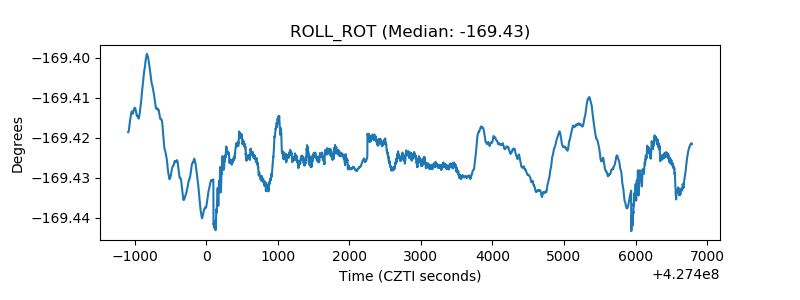 |
| _Roll_DEC | 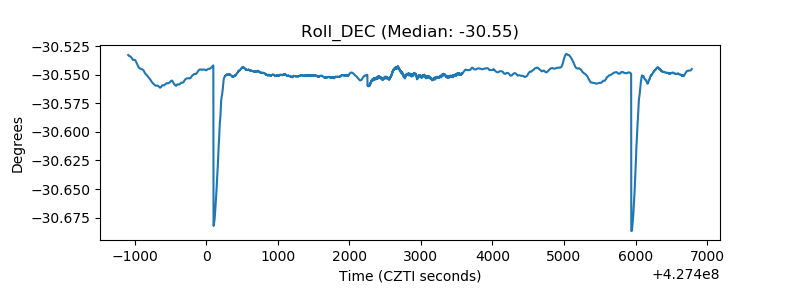 |
| _Roll_RA |  |
| Veto Counter | 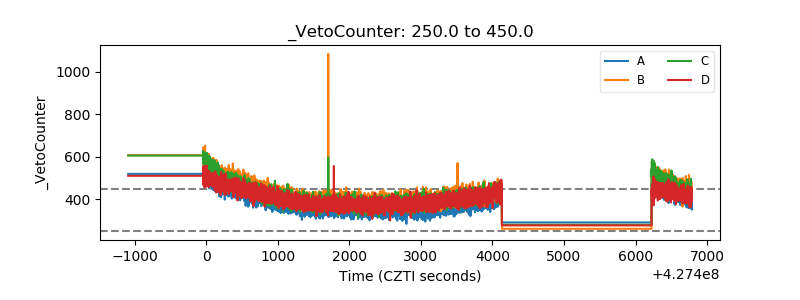 |