| Param | Original file | Final file |
|---|---|---|
| Filename | modeM0/AS1A12_088T59_9000005774_42200cztM0_level2.fits | modeM0/AS1A12_088T59_9000005774_42200cztM0_level2_quad_clean.evt |
| Size (bytes) | 42,736,320 | 10,584,000 |
| Size | 40.8 MB | 10.1 MB |
| Events in quadrant A | 480,654 | 72,058 |
| Events in quadrant B | 296,564 | 74,331 |
| Events in quadrant C | 281,697 | 69,275 |
| Events in quadrant D | 475,727 | 58,318 |
| Mode SS | |||
|---|---|---|---|
| Quadrant | BADHDUFLAG | Total packets | Discarded packets |
| A | 0 | 10 | 0 |
| B | 0 | 10 | 0 |
| C | 0 | 10 | 0 |
| D | 0 | 10 | 0 |
| Mode M9 | |||
|---|---|---|---|
| Quadrant | BADHDUFLAG | Total packets | Discarded packets |
| A | 0 | 8 | 0 |
| B | 0 | 9 | 0 |
| C | 0 | 9 | 0 |
| D | 0 | 9 | 0 |
| Mode M0 | |||
|---|---|---|---|
| Quadrant | BADHDUFLAG | Total packets | Discarded packets |
| A | 0 | 1875 | 1 |
| B | 0 | 1226 | 1 |
| C | 0 | 1148 | 1 |
| D | 0 | 1797 | 1 |
| Quadrant | Total seconds | Saturated seconds | Saturation percentage |
|---|---|---|---|
| A | 564 | 13 | 2.304965% |
| B | 564 | 3 | 0.531915% |
| C | 564 | 1 | 0.177305% |
| D | 564 | 61 | 10.815603% |
Noise dominated data is calculated using 1-second bins in cleaned event files. If a bin has >2000 counts, and if more than 50% of those come from <1% of pixels, then it is considered to be noise-dominated and hence unusable.
| Quadrant | # 1 sec bins | Bins with >0 counts | Bins with >2000 counts | High rate bins dominated by noise | Noise dominated (total time) | Noise dominated (detector-on time) | Marked lightcurve |
|---|---|---|---|---|---|---|---|
| A | 564 | 564 | 6 | 6 | 1.06% | 1.06% | 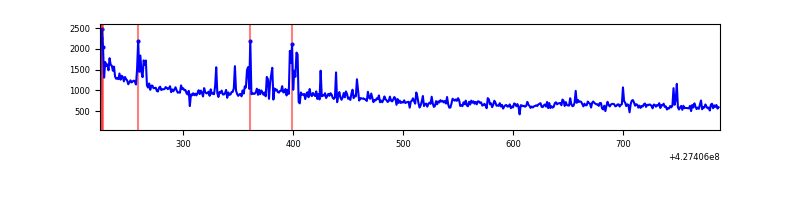 |
| B | 564 | 564 | 0 | 0 | 0.00% | 0.00% | 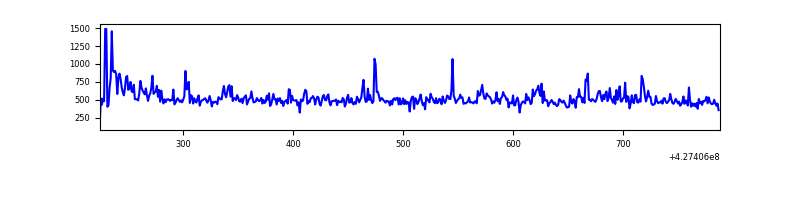 |
| C | 564 | 564 | 0 | 0 | 0.00% | 0.00% | 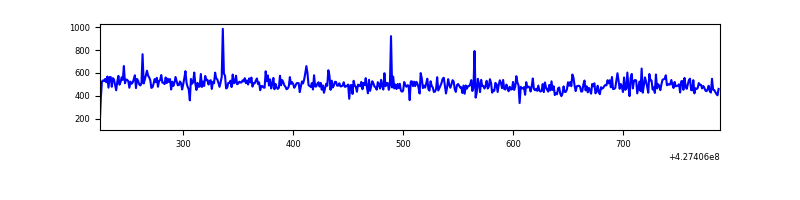 |
| D | 564 | 564 | 55 | 55 | 9.75% | 9.75% | 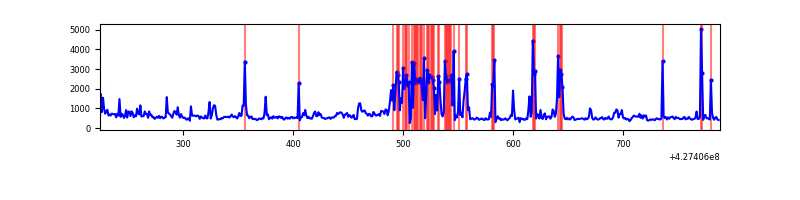 |
Top three noisy pixels from each quadrant. If the there are fewer than three noisy pixels in the level2.evt file, extra rows are filled as -1
| Pixel properties | Quadrant properties | ||||||
|---|---|---|---|---|---|---|---|
| Quadrant | DetID | PixID | Counts | Sigma | Mean | Median | Sigma |
| A | 10 | 83 | 143692 | 9043.34 | 67 | 66 | 15.9 |
| A | 15 | 223 | 65668 | 4130.6 | 67 | 66 | 15.9 |
| A | 13 | 6 | 4625 | 287.06 | 67 | 66 | 15.9 |
| B | 0 | 229 | 24778 | 1646.22 | 66 | 65 | 15.0 |
| B | 3 | 112 | 3124 | 203.77 | 66 | 65 | 15.0 |
| B | 0 | 156 | 2874 | 187.12 | 66 | 65 | 15.0 |
| C | 15 | 214 | 27998 | 1667.6 | 63 | 63 | 16.8 |
| C | 0 | 207 | 2035 | 117.72 | 63 | 63 | 16.8 |
| C | 7 | 247 | 1514 | 86.62 | 63 | 63 | 16.8 |
| D | 1 | 52 | 117194 | 6869.15 | 61 | 58 | 17.1 |
| D | 1 | 47 | 94010 | 5509.58 | 61 | 58 | 17.1 |
| D | 10 | 199 | 14571 | 851.08 | 61 | 58 | 17.1 |
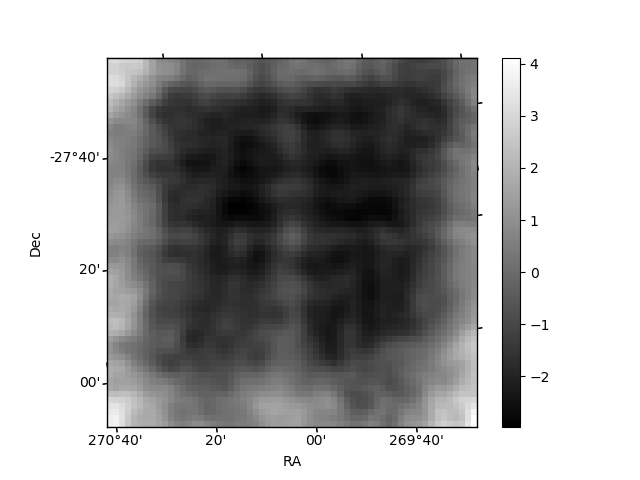
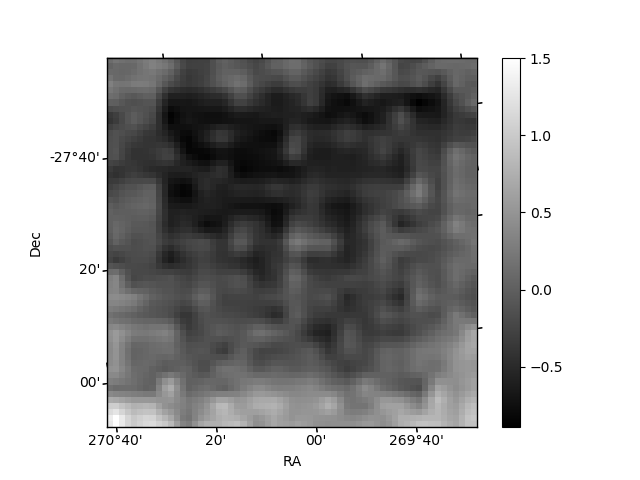
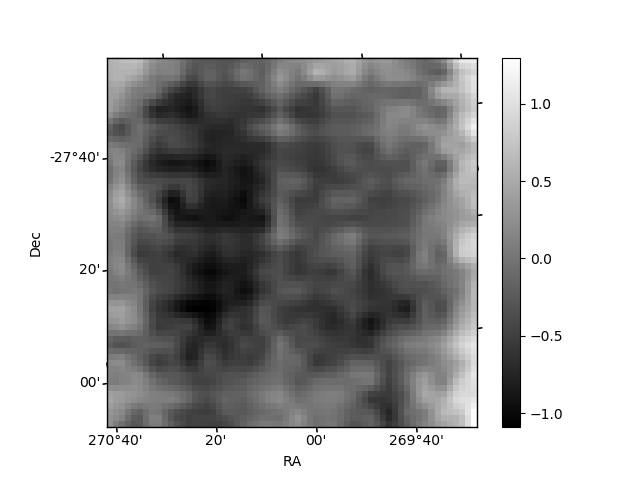
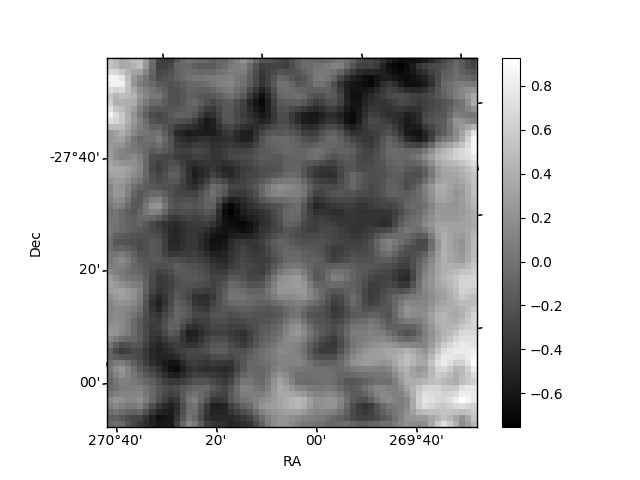
Histogram calculated using DETX and DETY for each event in the final _common_clean file
| Quadrant A | 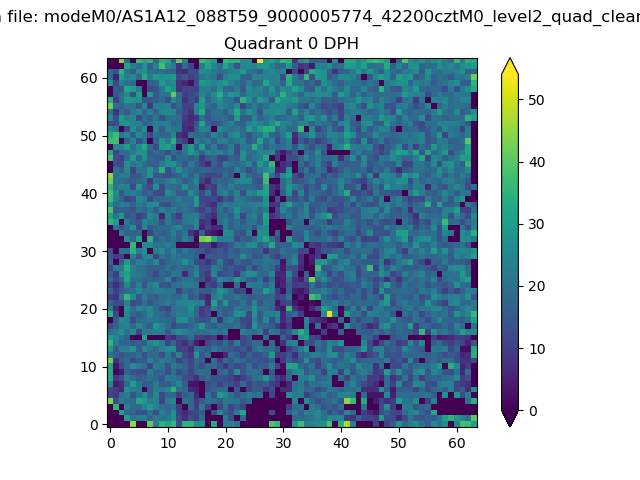 |
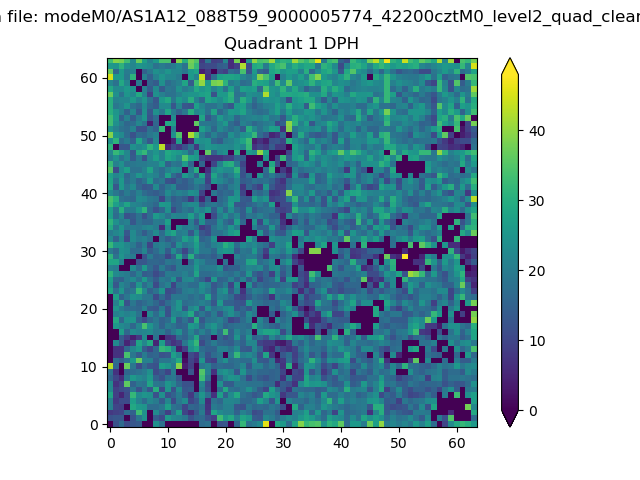 |
Quadrant B |
|---|---|---|---|
| Quadrant D | 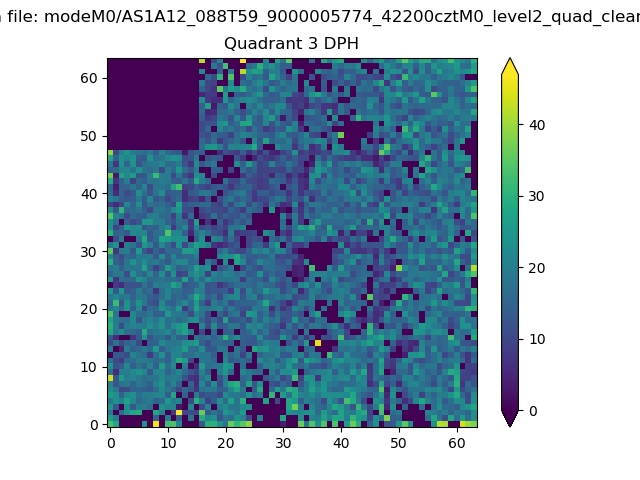 |
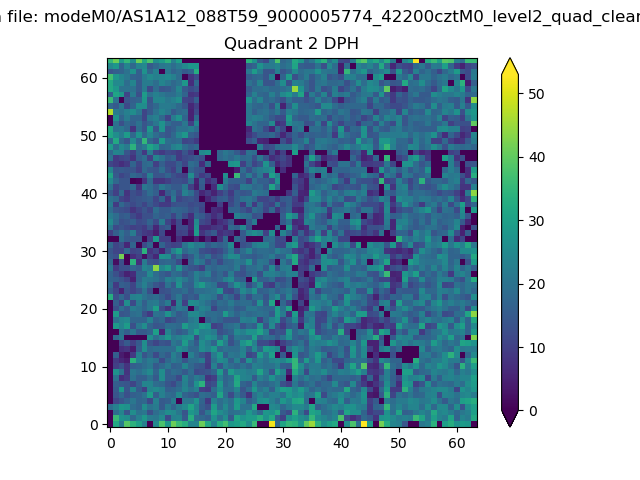 |
Quadrant C |
| Plot type | Count rate plots | Images |
|---|---|---|
| Comparison with Poisson distribution Blue bars denote a histogram of data divided into 1 sec bins. Red curve is a Poisson curve with rate = median count rate of data. |
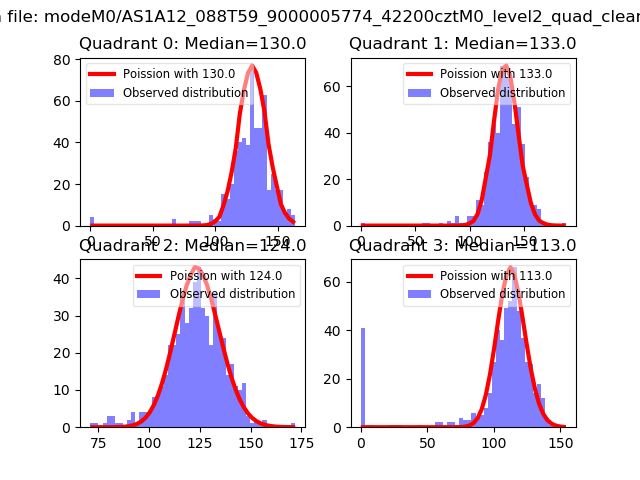 |
 |
| Quadrant-wise count rates Data is divided into 100 sec bins |
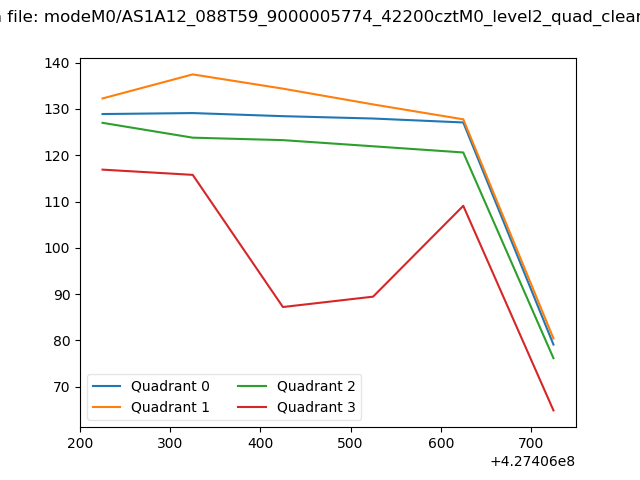 |
|
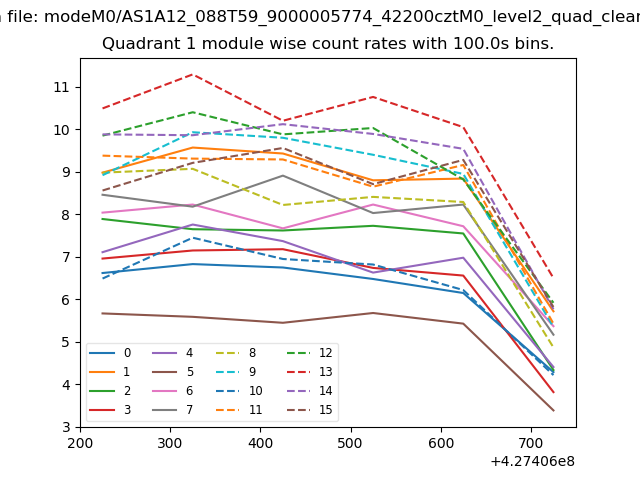
| Module-wise count rates for Quadrant A Data is divided into 100 sec bins |
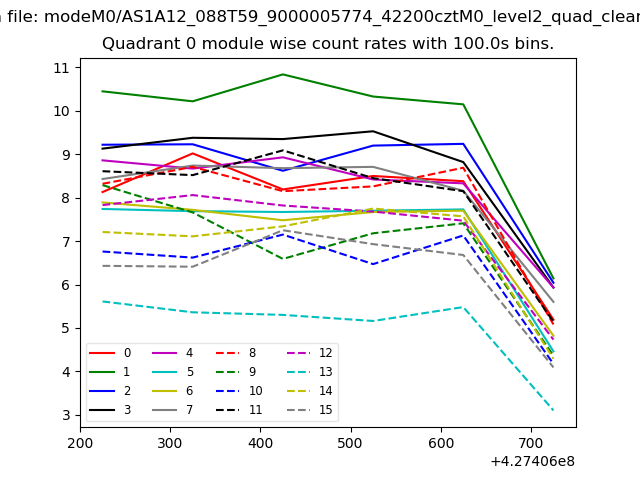 |
 |
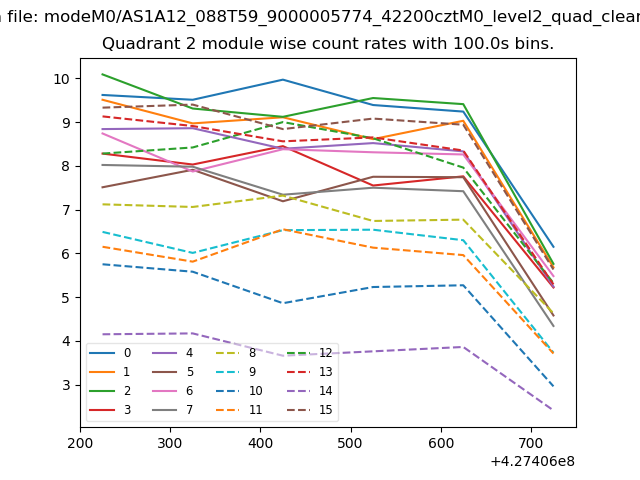
| Module-wise count rates for Quadrant B Data is divided into 100 sec bins |
 |
 |
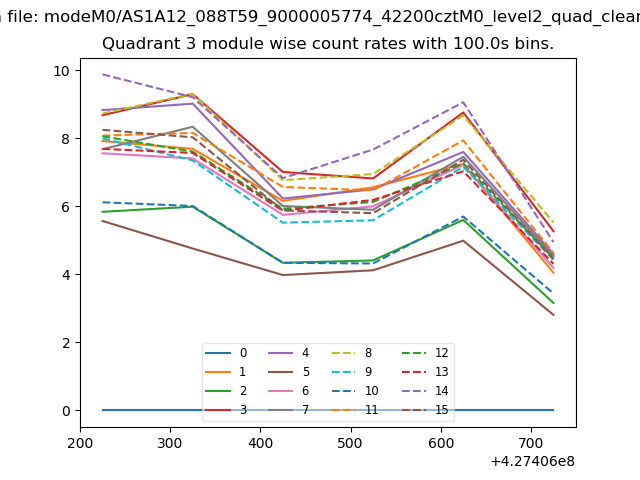
| Module-wise count rates for Quadrant C Data is divided into 100 sec bins |
 |
 |
| Module-wise count rates for Quadrant D Data is divided into 100 sec bins |
 |
 |
| Parameter | Plot |
|---|---|
| CZT HV Monitor | 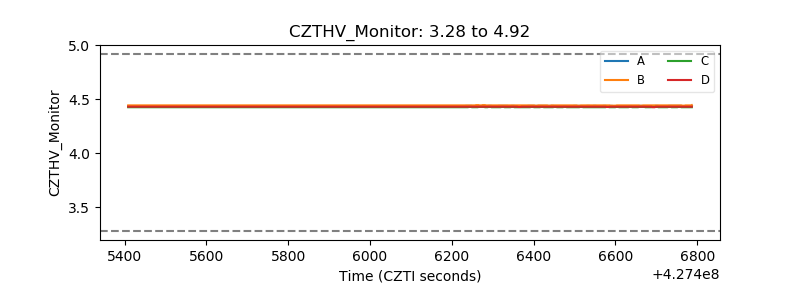 |
| D_VDD | 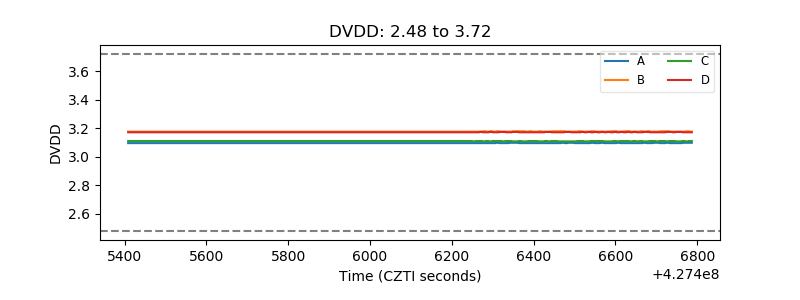 |
| Temperature 1 | 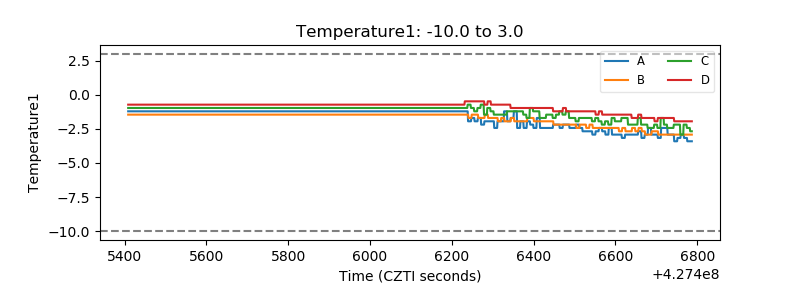 |
| Veto HV Monitor |  |
| Veto LLD | 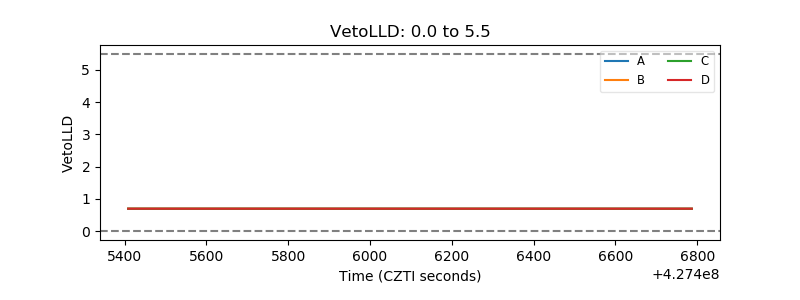 |
| Alpha Counter |  |
| _CPM_Rate |  |
| CZT Counter | 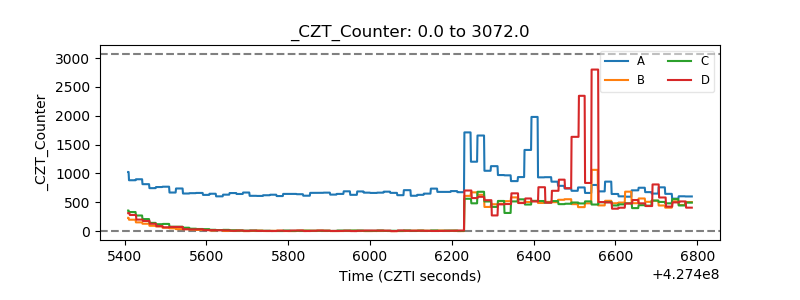 |
| +2.5 Volts monitor | 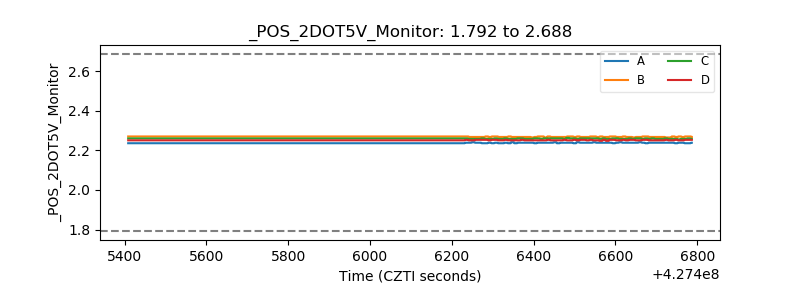 |
| +5 Volts monitor |  |
| _ROLL_ROT | 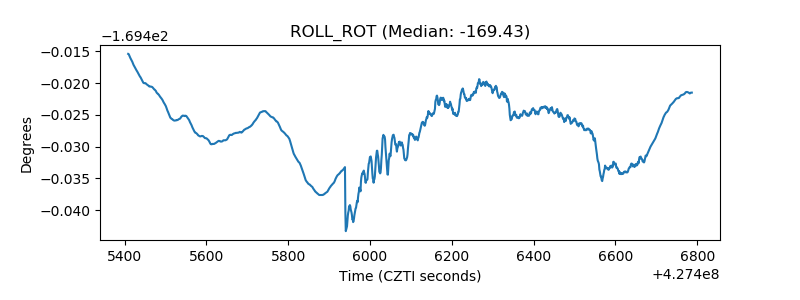 |
| _Roll_DEC | 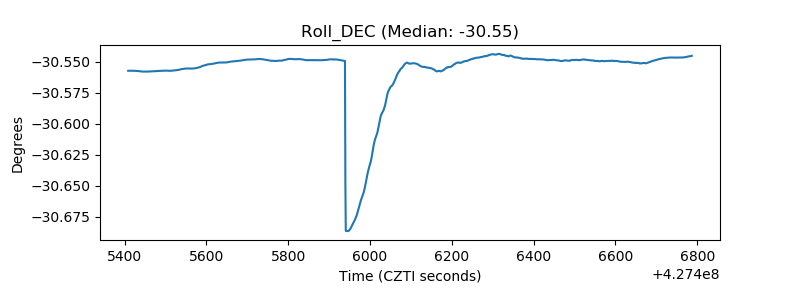 |
| _Roll_RA | 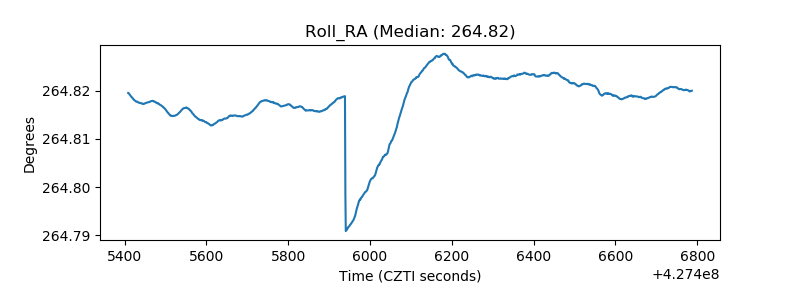 |
| Veto Counter | 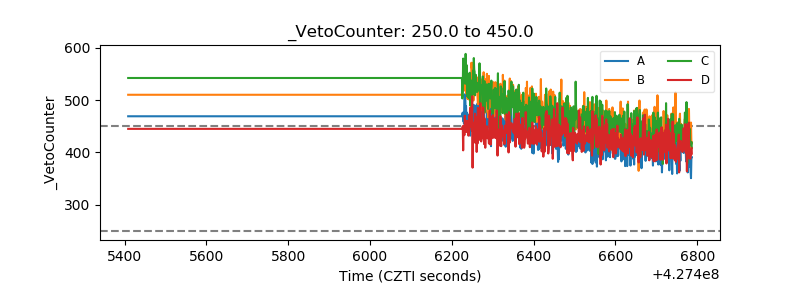 |