| Param | Original file | Final file |
|---|---|---|
| Filename | modeM0/AS1A12_089T01_9000005776_42200cztM0_level2.fits | modeM0/AS1A12_089T01_9000005776_42200cztM0_level2_quad_clean.evt |
| Size (bytes) | 238,250,880 | 68,423,040 |
| Size | 227.2 MB | 65.3 MB |
| Events in quadrant A | 2,389,311 | 460,534 |
| Events in quadrant B | 1,929,889 | 476,622 |
| Events in quadrant C | 1,857,580 | 446,085 |
| Events in quadrant D | 2,329,224 | 405,512 |
| Mode SS | |||
|---|---|---|---|
| Quadrant | BADHDUFLAG | Total packets | Discarded packets |
| A | 0 | 84 | 0 |
| B | 0 | 84 | 0 |
| C | 0 | 84 | 0 |
| D | 0 | 84 | 0 |
| Mode M0 | |||
|---|---|---|---|
| Quadrant | BADHDUFLAG | Total packets | Discarded packets |
| A | 0 | 9472 | 1 |
| B | 0 | 8509 | 1 |
| C | 0 | 8095 | 1 |
| D | 0 | 9734 | 1 |
| Mode M9 | |||
|---|---|---|---|
| Quadrant | BADHDUFLAG | Total packets | Discarded packets |
| A | 0 | 21 | 0 |
| B | 0 | 21 | 0 |
| C | 0 | 21 | 0 |
| D | 0 | 21 | 0 |
| Quadrant | Total seconds | Saturated seconds | Saturation percentage |
|---|---|---|---|
| A | 4009 | 51 | 1.272138% |
| B | 4009 | 14 | 0.349214% |
| C | 4009 | 4 | 0.099776% |
| D | 4009 | 63 | 1.571464% |
Noise dominated data is calculated using 1-second bins in cleaned event files. If a bin has >2000 counts, and if more than 50% of those come from <1% of pixels, then it is considered to be noise-dominated and hence unusable.
| Quadrant | # 1 sec bins | Bins with >0 counts | Bins with >2000 counts | High rate bins dominated by noise | Noise dominated (total time) | Noise dominated (detector-on time) | Marked lightcurve |
|---|---|---|---|---|---|---|---|
| A | 6163 | 4010 | 56 | 56 | 0.91% | 1.40% | 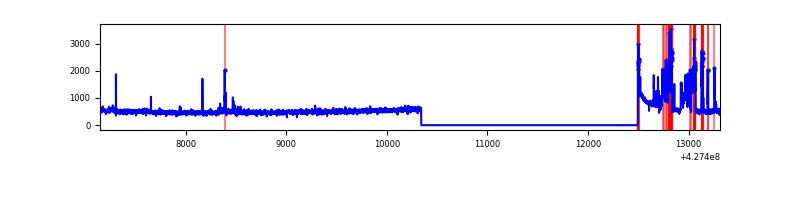 |
| B | 6163 | 4010 | 14 | 14 | 0.23% | 0.35% | 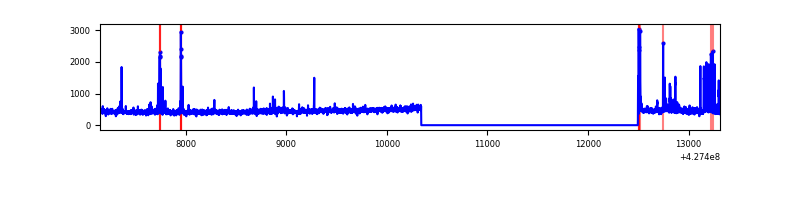 |
| C | 6163 | 4010 | 2 | 2 | 0.03% | 0.05% | 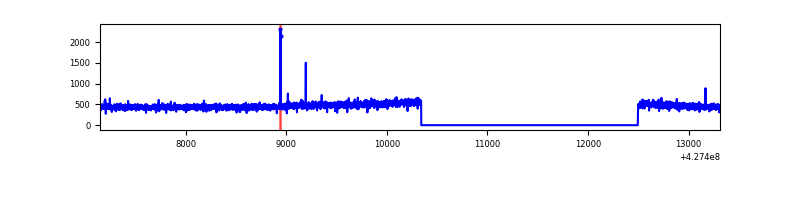 |
| D | 6163 | 4010 | 65 | 65 | 1.05% | 1.62% | 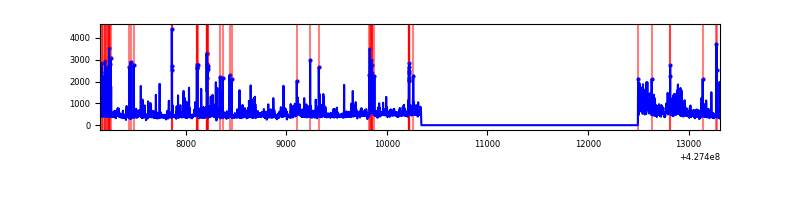 |
Top three noisy pixels from each quadrant. If the there are fewer than three noisy pixels in the level2.evt file, extra rows are filled as -1
| Pixel properties | Quadrant properties | ||||||
|---|---|---|---|---|---|---|---|
| Quadrant | DetID | PixID | Counts | Sigma | Mean | Median | Sigma |
| A | 10 | 83 | 365431 | 4039.27 | 437 | 429 | 90.4 |
| A | 15 | 223 | 277348 | 3064.51 | 437 | 429 | 90.4 |
| A | 13 | 248 | 31792 | 347.08 | 437 | 429 | 90.4 |
| B | 7 | 202 | 97147 | 1132.91 | 441 | 429 | 85.4 |
| B | 0 | 229 | 58490 | 680.1 | 441 | 429 | 85.4 |
| B | 5 | 255 | 27503 | 317.13 | 441 | 429 | 85.4 |
| C | 15 | 214 | 165210 | 1625.87 | 427 | 430 | 101.3 |
| C | 0 | 207 | 11271 | 106.97 | 427 | 430 | 101.3 |
| C | 7 | 247 | 8009 | 74.78 | 427 | 430 | 101.3 |
| D | 1 | 52 | 394296 | 3773.81 | 420 | 407 | 104.4 |
| D | 12 | 6 | 80673 | 769.02 | 420 | 407 | 104.4 |
| D | 10 | 199 | 61609 | 586.37 | 420 | 407 | 104.4 |
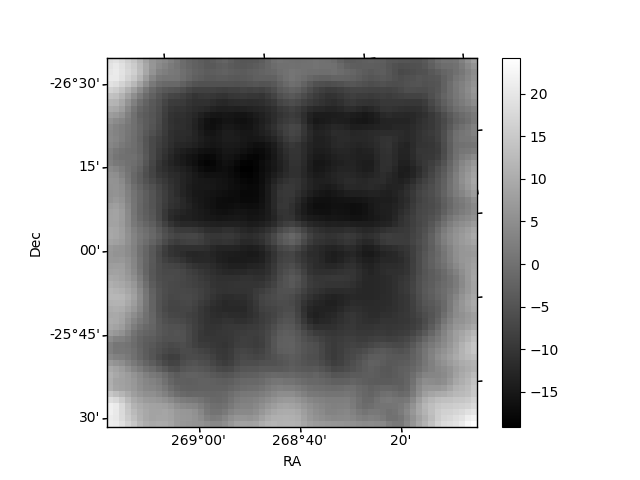
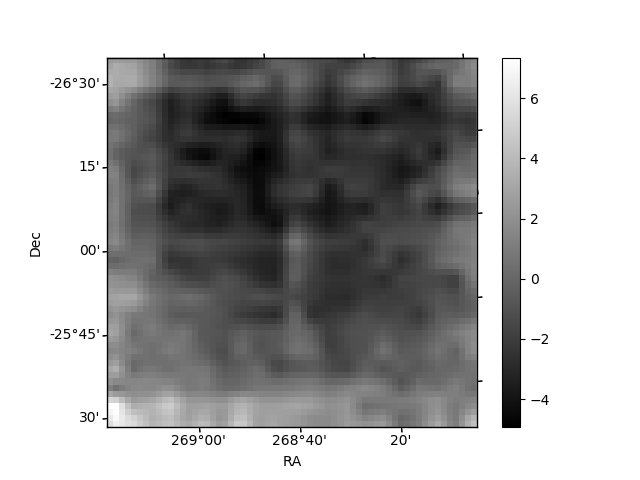
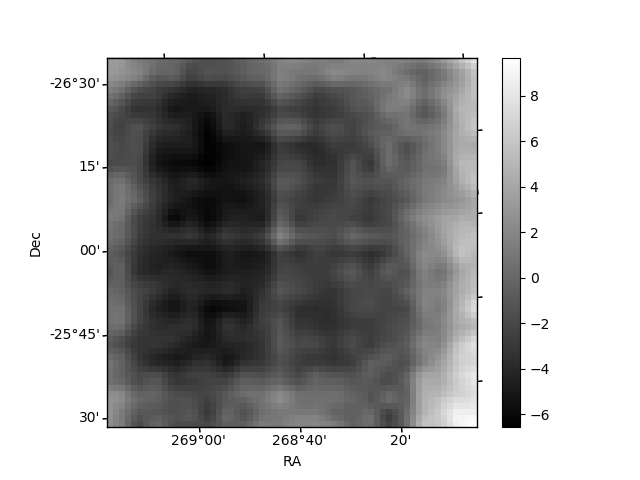
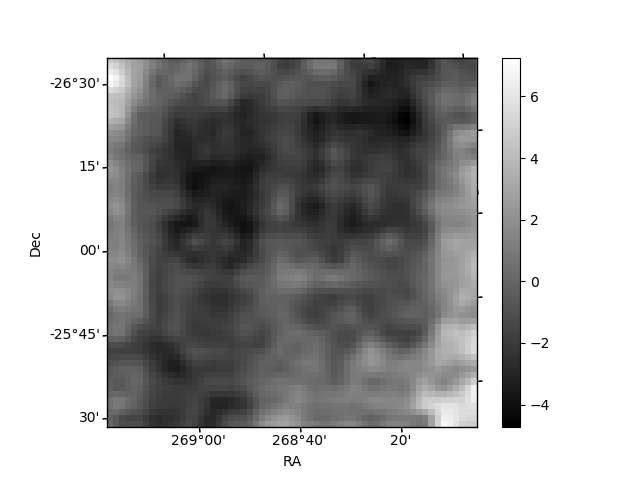
Histogram calculated using DETX and DETY for each event in the final _common_clean file
| Quadrant A | 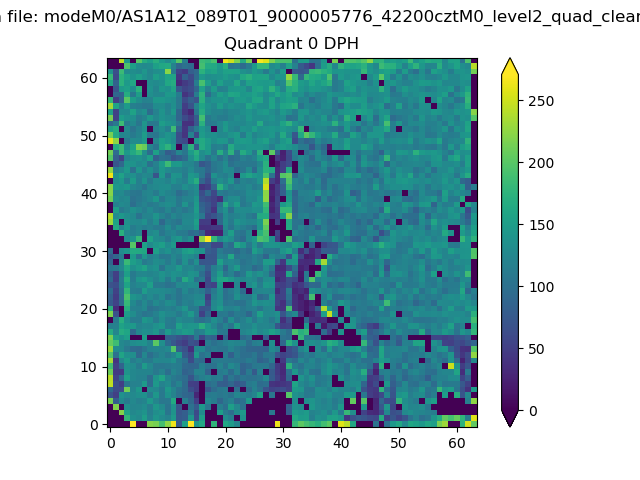 |
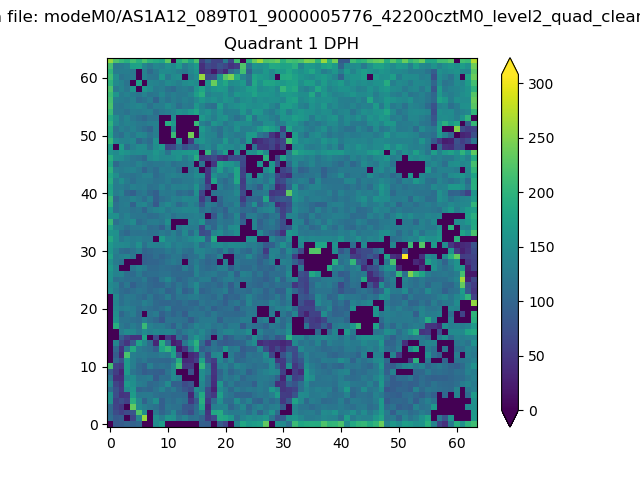 |
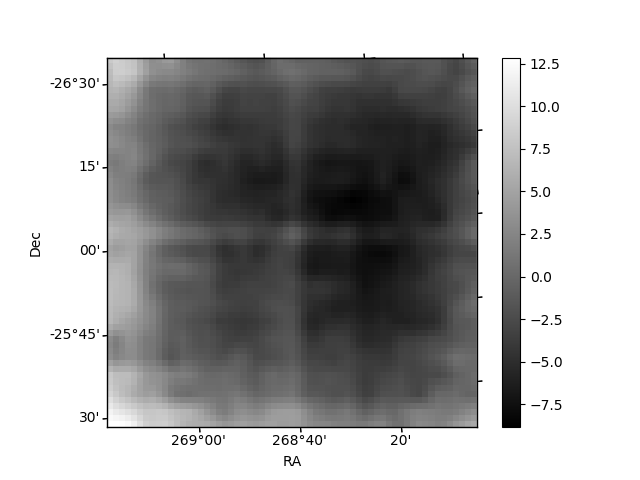
Quadrant B |
|---|---|---|---|
| Quadrant D | 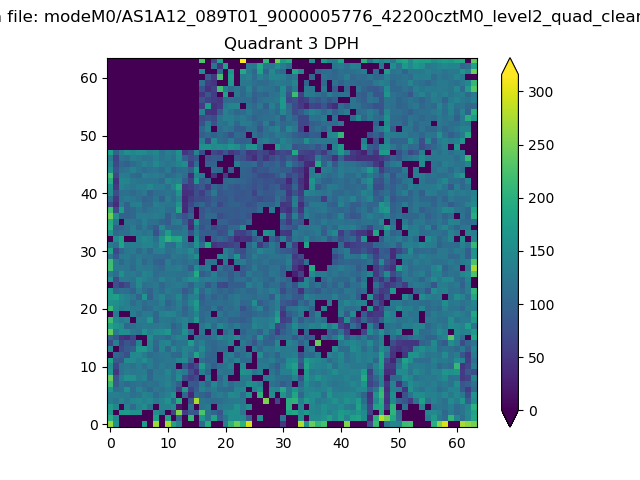 |
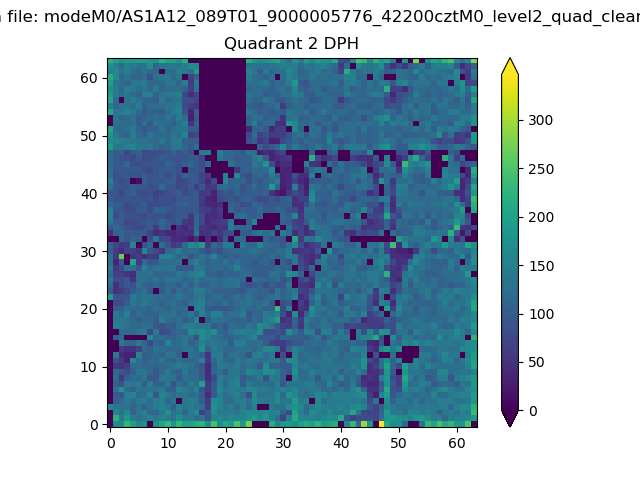 |
Quadrant C |
| Plot type | Count rate plots | Images |
|---|---|---|
| Comparison with Poisson distribution Blue bars denote a histogram of data divided into 1 sec bins. Red curve is a Poisson curve with rate = median count rate of data. |
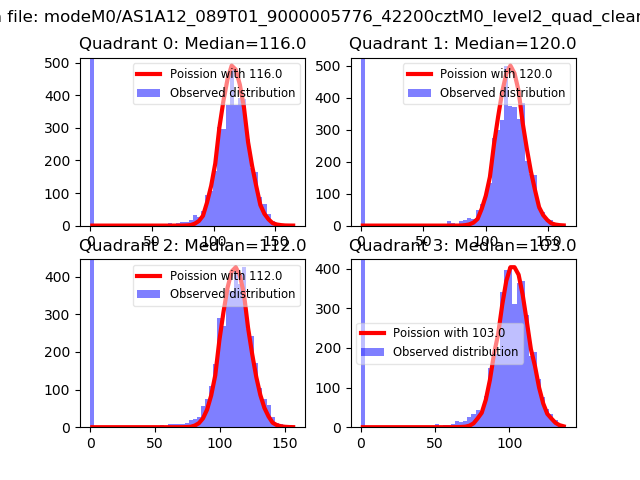 |
 |
| Quadrant-wise count rates Data is divided into 100 sec bins |
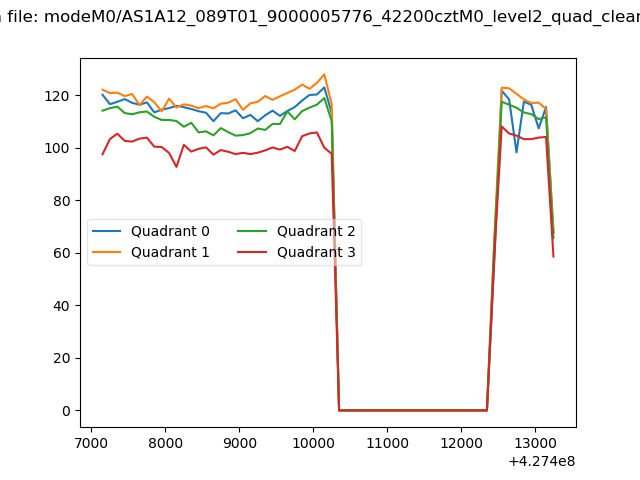 |
|
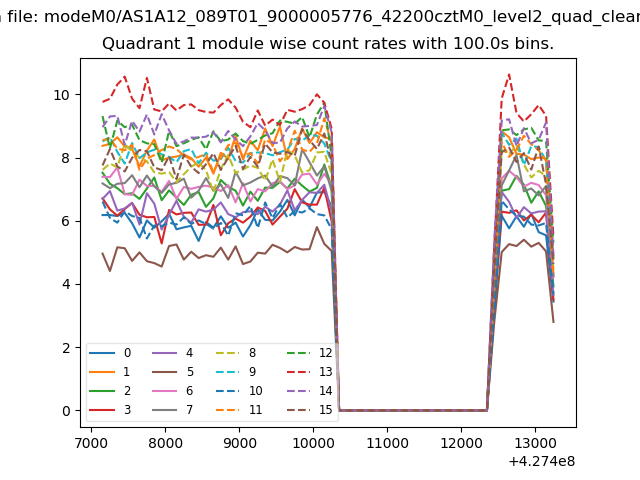
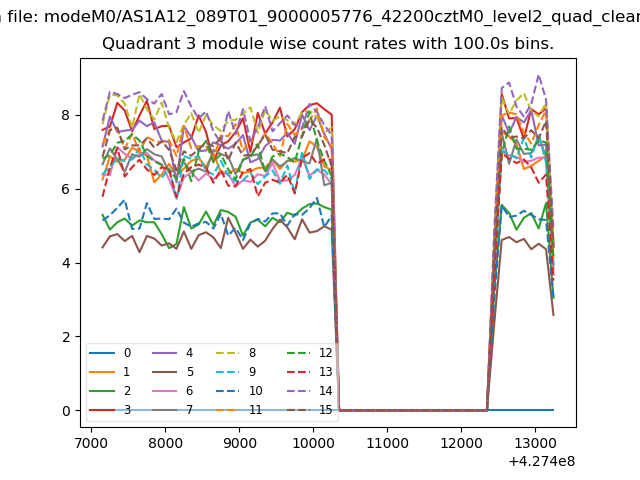
| Module-wise count rates for Quadrant A Data is divided into 100 sec bins |
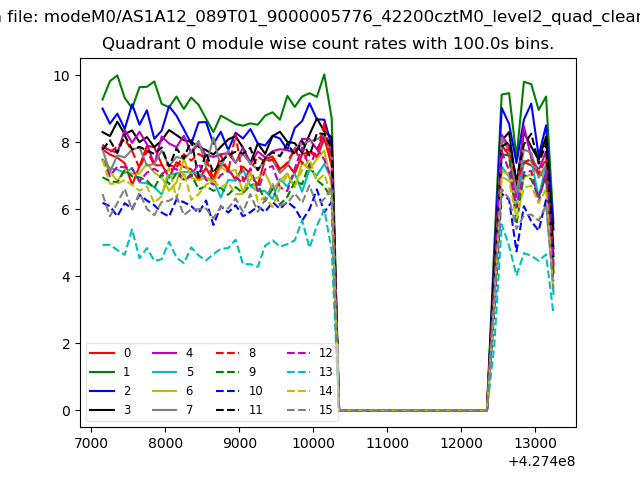 |
 |
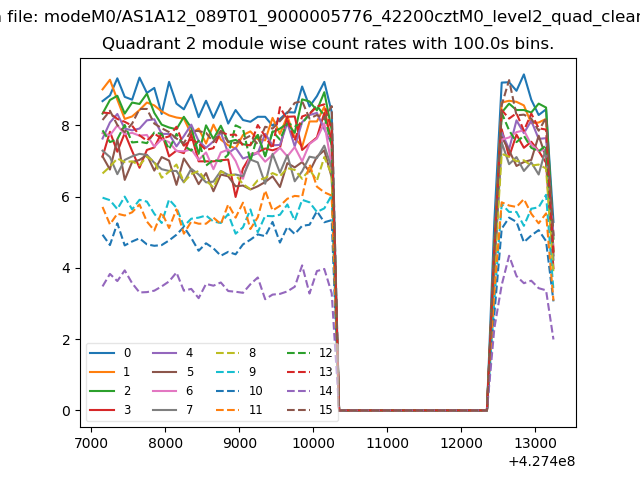
| Module-wise count rates for Quadrant B Data is divided into 100 sec bins |
 |
 |
| Module-wise count rates for Quadrant C Data is divided into 100 sec bins |
 |
 |
| Module-wise count rates for Quadrant D Data is divided into 100 sec bins |
 |
 |
| Parameter | Plot |
|---|---|
| CZT HV Monitor | 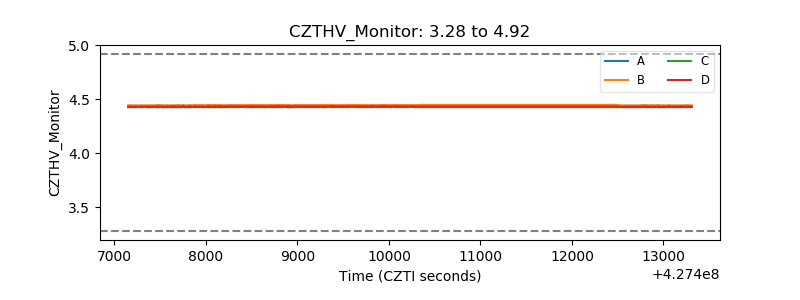 |
| D_VDD | 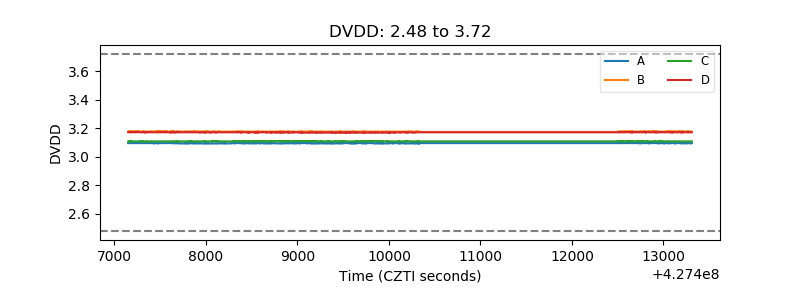 |
| Temperature 1 | 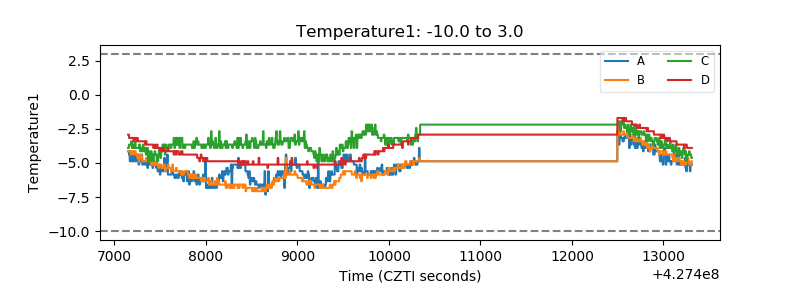 |
| Veto HV Monitor | 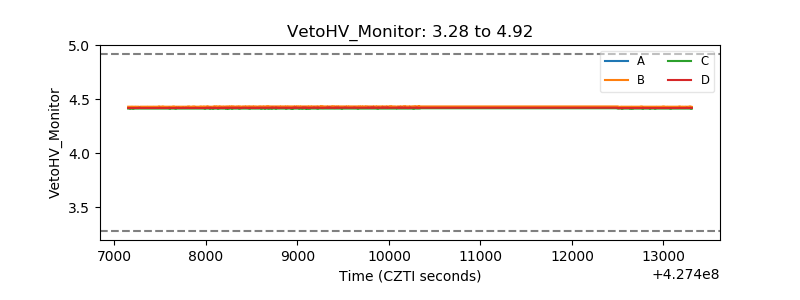 |
| Veto LLD | 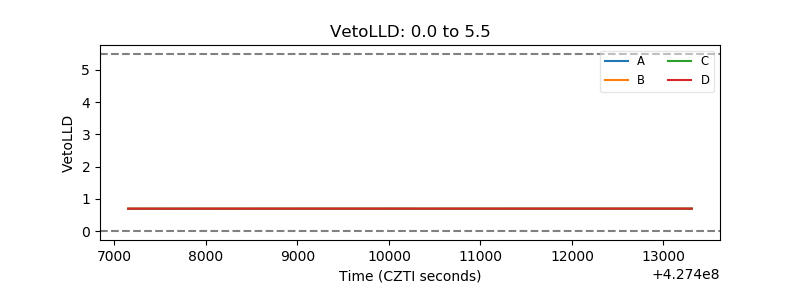 |
| Alpha Counter | 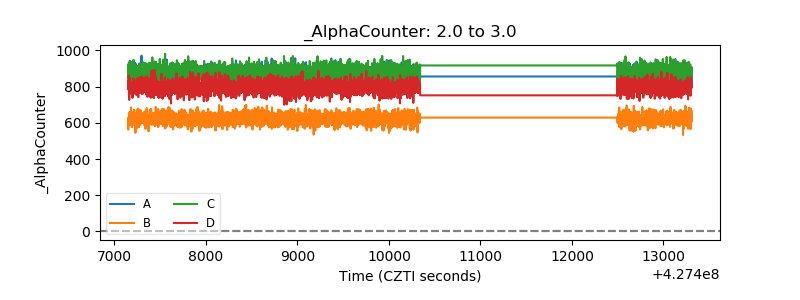 |
| _CPM_Rate | 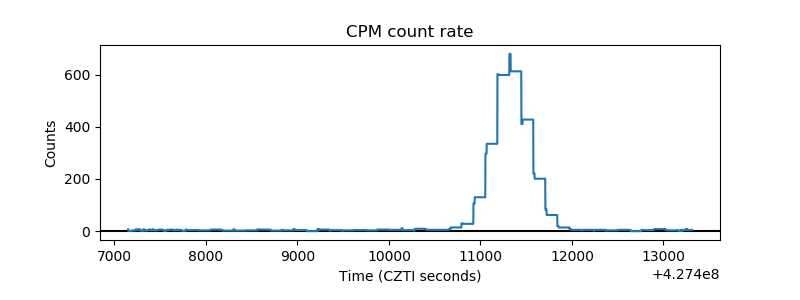 |
| CZT Counter | 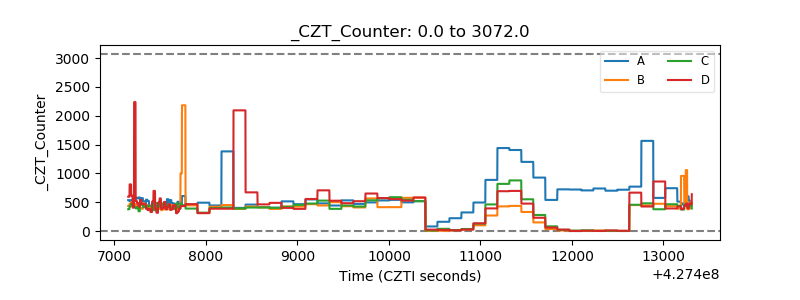 |
| +2.5 Volts monitor | 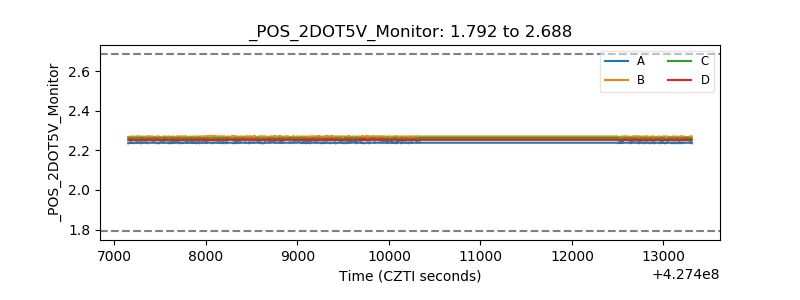 |
| +5 Volts monitor | 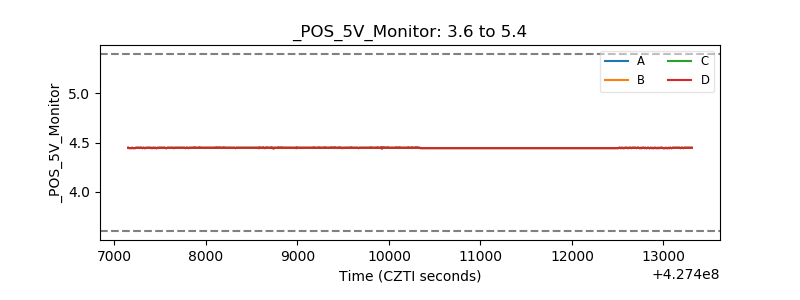 |
| _ROLL_ROT | 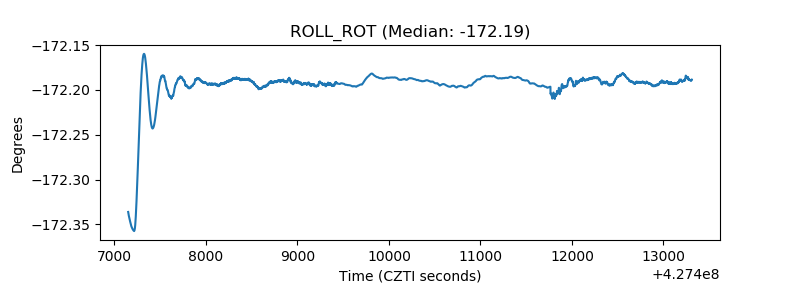 |
| _Roll_DEC | 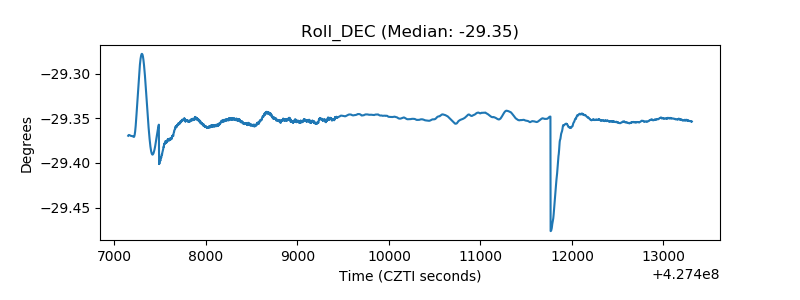 |
| _Roll_RA | 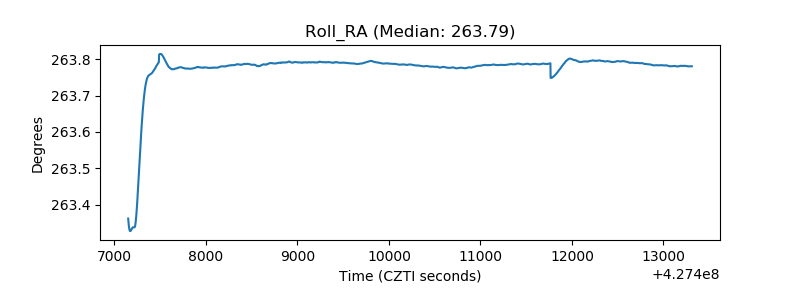 |
| Veto Counter | 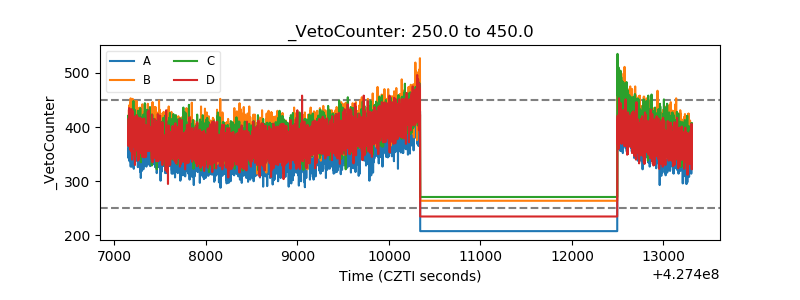 |