| Param | Original file | Final file |
|---|---|---|
| Filename | modeM0/AS1A12_089T01_9000005776_42201cztM0_level2.fits | modeM0/AS1A12_089T01_9000005776_42201cztM0_level2_quad_clean.evt |
| Size (bytes) | 290,416,320 | 80,988,480 |
| Size | 277.0 MB | 77.2 MB |
| Events in quadrant A | 2,928,405 | 544,038 |
| Events in quadrant B | 2,368,282 | 560,404 |
| Events in quadrant C | 2,241,266 | 531,033 |
| Events in quadrant D | 2,832,904 | 475,369 |
| Mode SS | |||
|---|---|---|---|
| Quadrant | BADHDUFLAG | Total packets | Discarded packets |
| A | 0 | 100 | 0 |
| B | 0 | 100 | 0 |
| C | 0 | 100 | 0 |
| D | 0 | 100 | 0 |
| Mode M0 | |||
|---|---|---|---|
| Quadrant | BADHDUFLAG | Total packets | Discarded packets |
| A | 0 | 11717 | 2 |
| B | 0 | 10441 | 2 |
| C | 0 | 9821 | 2 |
| D | 0 | 11998 | 2 |
| Mode M9 | |||
|---|---|---|---|
| Quadrant | BADHDUFLAG | Total packets | Discarded packets |
| A | 0 | 35 | 0 |
| B | 0 | 35 | 0 |
| C | 0 | 36 | 0 |
| D | 0 | 36 | 0 |
| Quadrant | Total seconds | Saturated seconds | Saturation percentage |
|---|---|---|---|
| A | 4865 | 60 | 1.233299% |
| B | 4865 | 33 | 0.678314% |
| C | 4865 | 2 | 0.041110% |
| D | 4865 | 114 | 2.343268% |
Noise dominated data is calculated using 1-second bins in cleaned event files. If a bin has >2000 counts, and if more than 50% of those come from <1% of pixels, then it is considered to be noise-dominated and hence unusable.
| Quadrant | # 1 sec bins | Bins with >0 counts | Bins with >2000 counts | High rate bins dominated by noise | Noise dominated (total time) | Noise dominated (detector-on time) | Marked lightcurve |
|---|---|---|---|---|---|---|---|
| A | 6958 | 4866 | 63 | 63 | 0.91% | 1.29% | 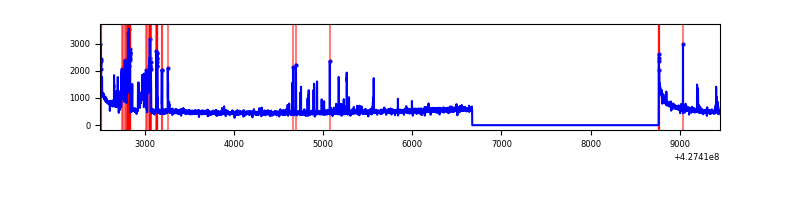 |
| B | 6958 | 4866 | 31 | 31 | 0.45% | 0.64% | 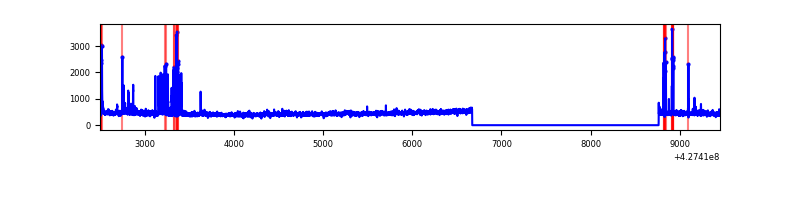 |
| C | 6958 | 4866 | 1 | 1 | 0.01% | 0.02% | 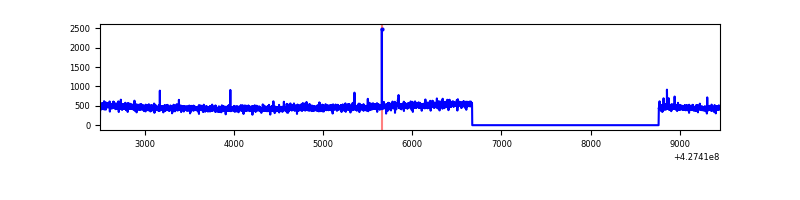 |
| D | 6958 | 4866 | 100 | 100 | 1.44% | 2.06% | 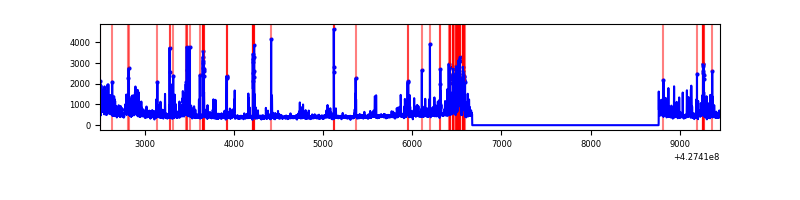 |
Top three noisy pixels from each quadrant. If the there are fewer than three noisy pixels in the level2.evt file, extra rows are filled as -1
| Pixel properties | Quadrant properties | ||||||
|---|---|---|---|---|---|---|---|
| Quadrant | DetID | PixID | Counts | Sigma | Mean | Median | Sigma |
| A | 10 | 83 | 514370 | 4726.06 | 526 | 517 | 108.7 |
| A | 15 | 223 | 268354 | 2463.38 | 526 | 517 | 108.7 |
| A | 14 | 24 | 37786 | 342.77 | 526 | 517 | 108.7 |
| B | 7 | 202 | 183301 | 1772.75 | 528 | 514 | 103.1 |
| B | 0 | 229 | 64028 | 615.99 | 528 | 514 | 103.1 |
| B | 15 | 35 | 29700 | 283.06 | 528 | 514 | 103.1 |
| C | 15 | 214 | 204283 | 1673.25 | 515 | 519 | 121.8 |
| C | 7 | 247 | 12018 | 94.43 | 515 | 519 | 121.8 |
| C | 12 | 251 | 5950 | 44.6 | 515 | 519 | 121.8 |
| D | 1 | 52 | 362643 | 2897.96 | 504 | 488 | 125.0 |
| D | 13 | 249 | 145488 | 1160.29 | 504 | 488 | 125.0 |
| D | 1 | 47 | 106827 | 850.92 | 504 | 488 | 125.0 |
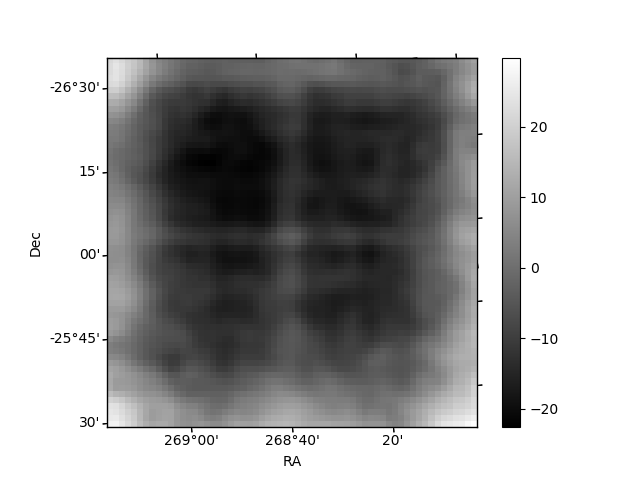
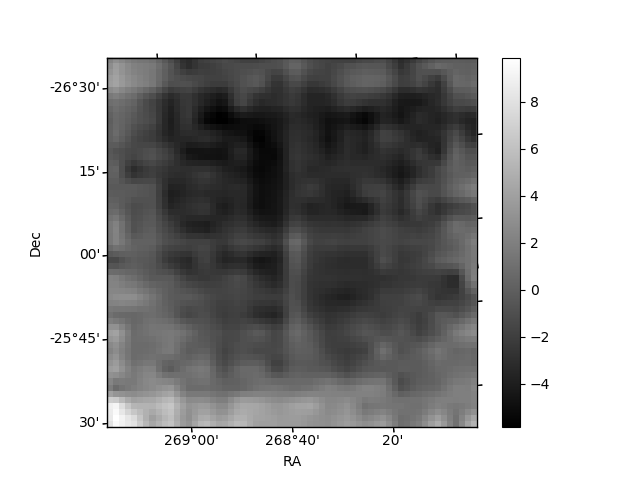
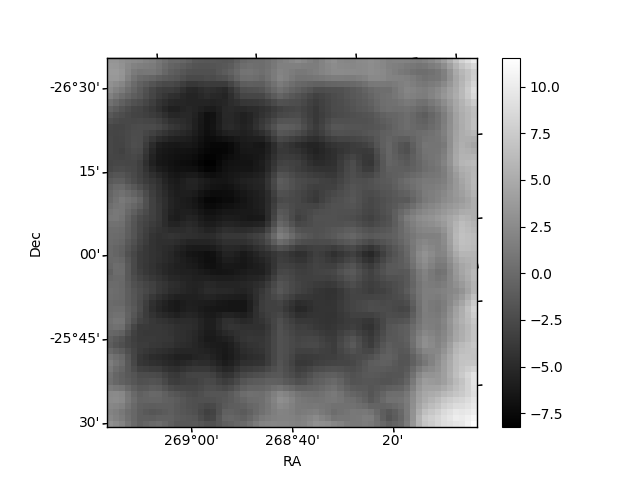
Histogram calculated using DETX and DETY for each event in the final _common_clean file
| Quadrant A | 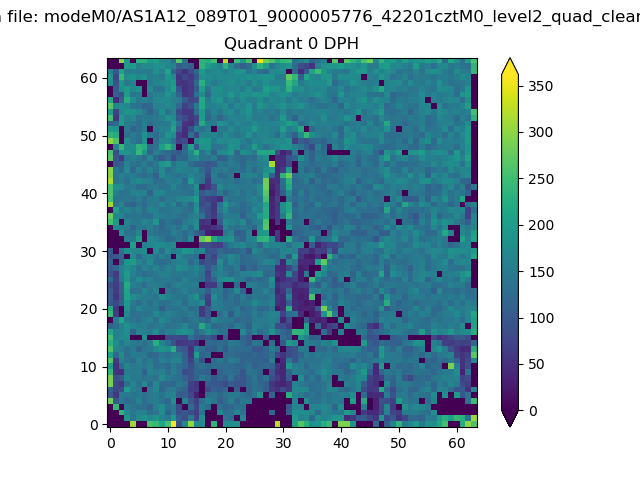 |
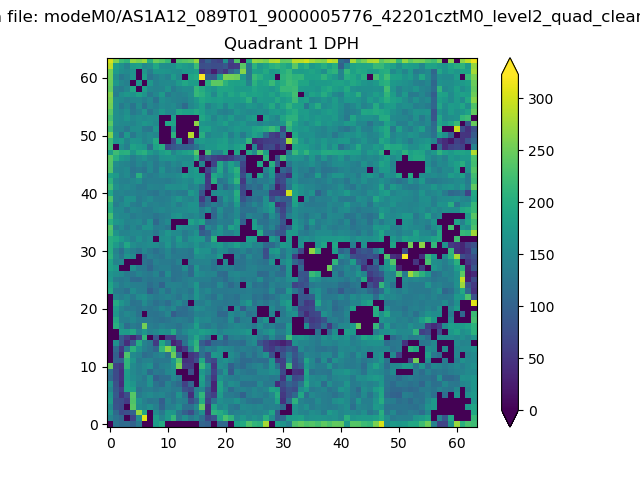 |
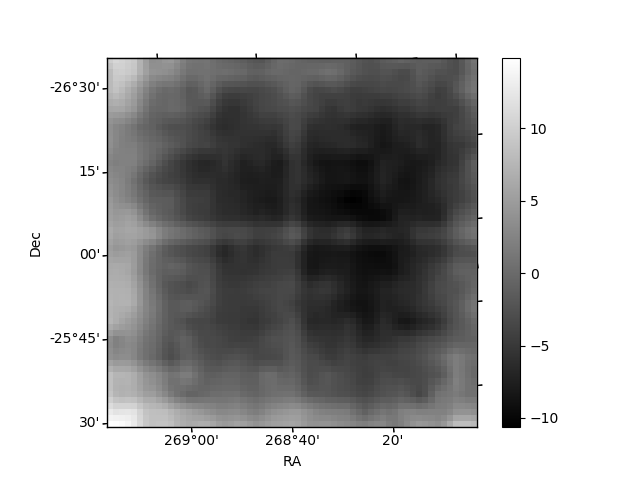
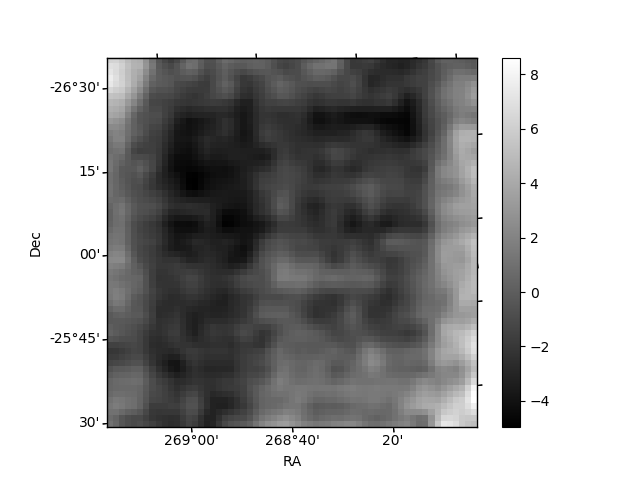
Quadrant B |
|---|---|---|---|
| Quadrant D | 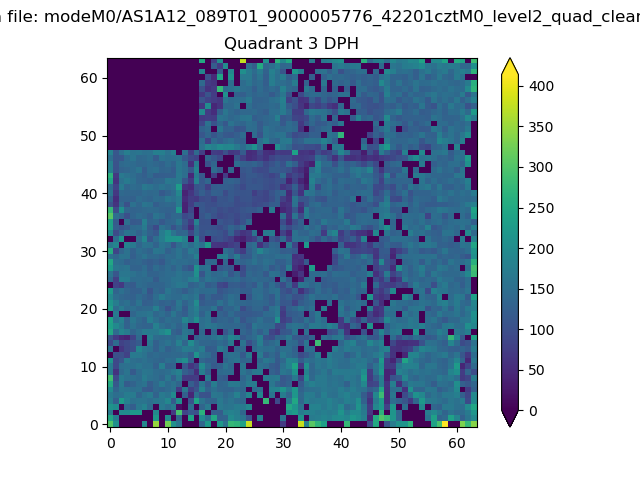 |
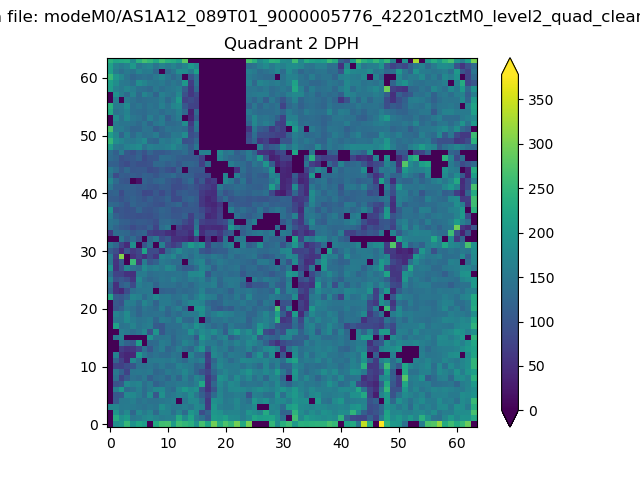 |
Quadrant C |
| Plot type | Count rate plots | Images |
|---|---|---|
| Comparison with Poisson distribution Blue bars denote a histogram of data divided into 1 sec bins. Red curve is a Poisson curve with rate = median count rate of data. |
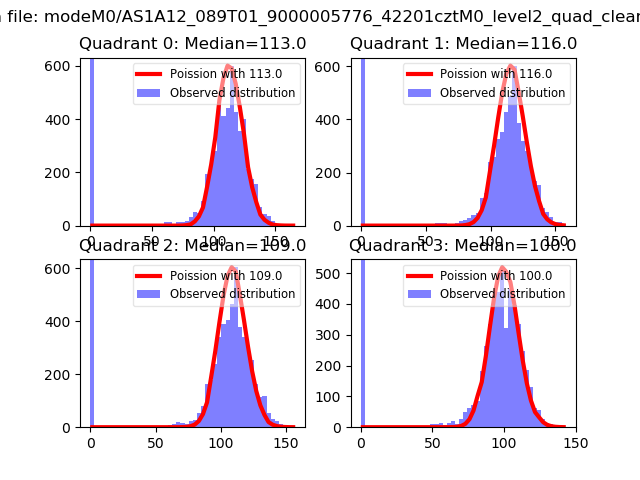 |
 |
| Quadrant-wise count rates Data is divided into 100 sec bins |
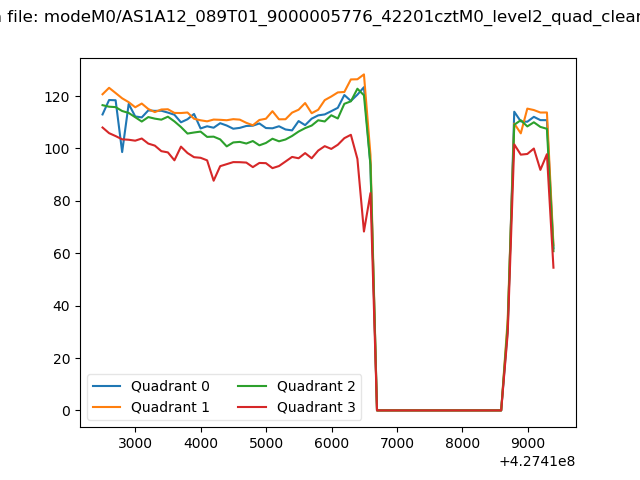 |
|
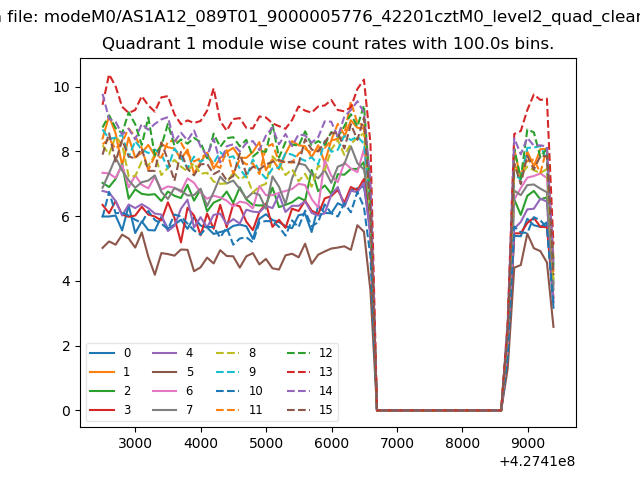
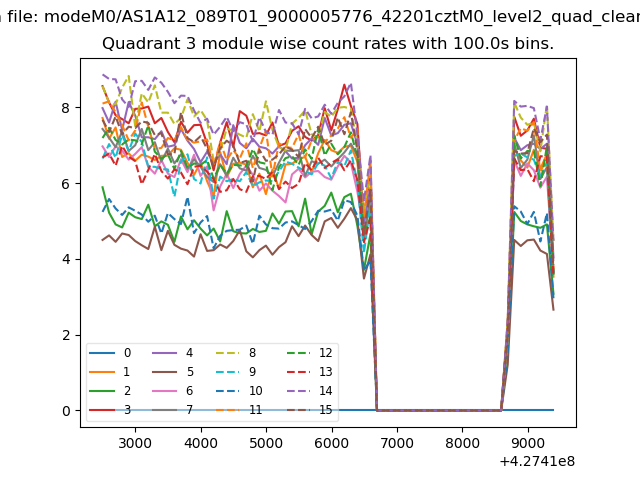
| Module-wise count rates for Quadrant A Data is divided into 100 sec bins |
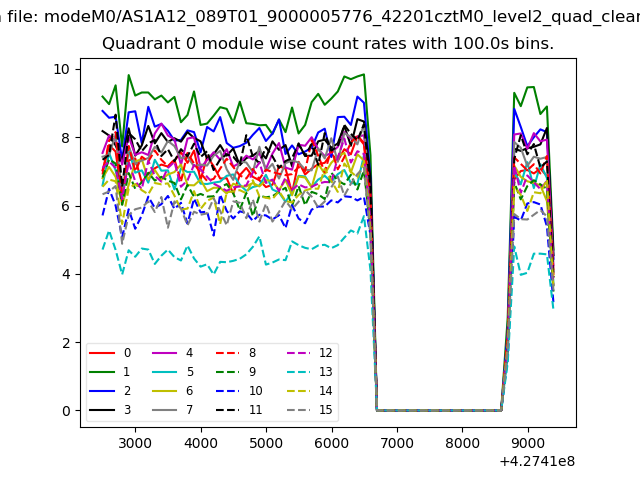 |
 |
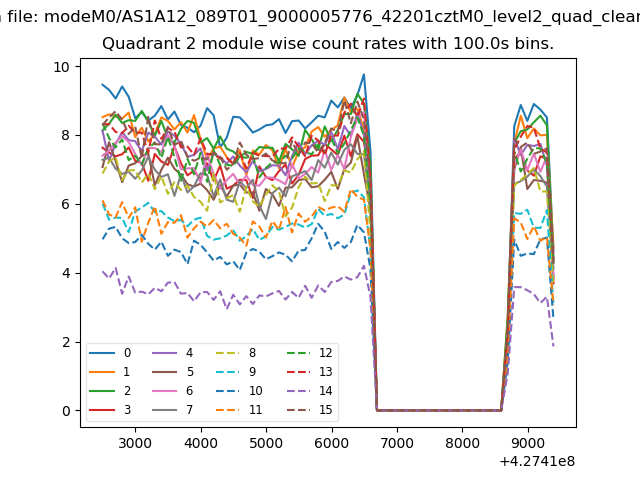
| Module-wise count rates for Quadrant B Data is divided into 100 sec bins |
 |
 |
| Module-wise count rates for Quadrant C Data is divided into 100 sec bins |
 |
 |
| Module-wise count rates for Quadrant D Data is divided into 100 sec bins |
 |
 |
| Parameter | Plot |
|---|---|
| CZT HV Monitor | 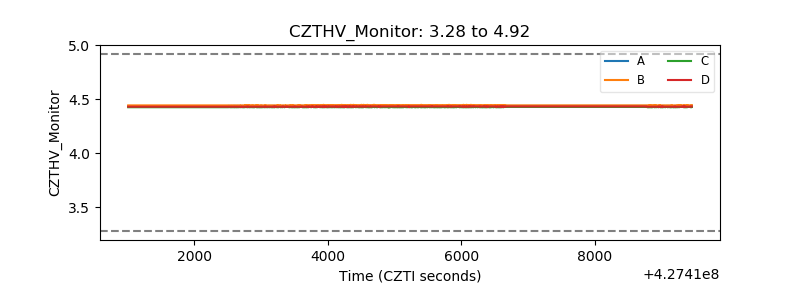 |
| D_VDD | 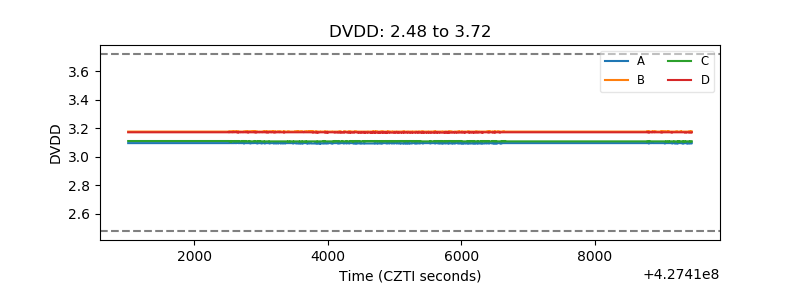 |
| Temperature 1 | 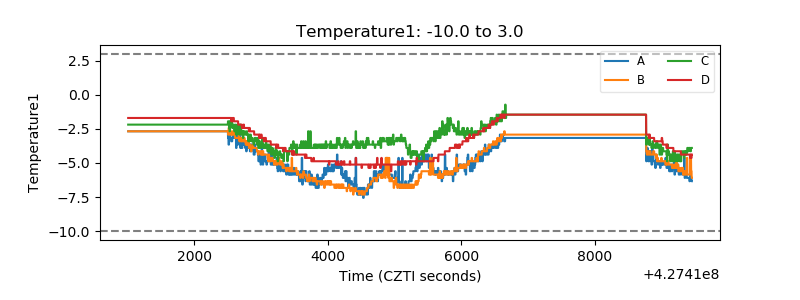 |
| Veto HV Monitor | 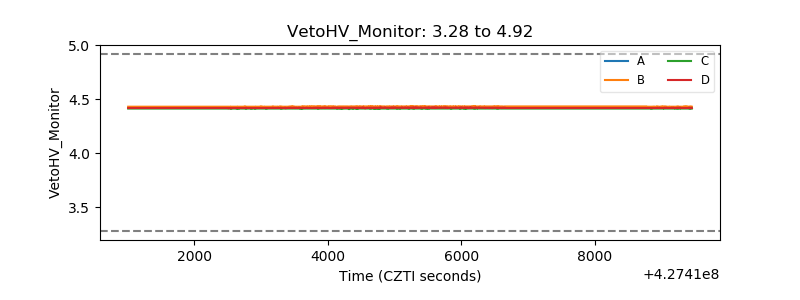 |
| Veto LLD | 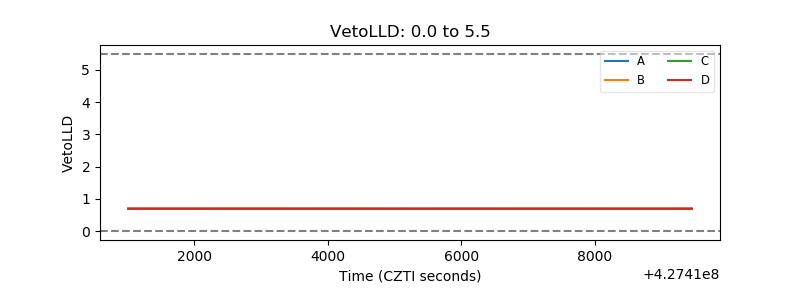 |
| Alpha Counter | 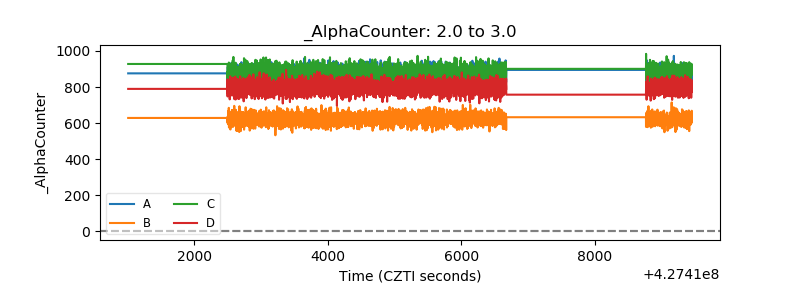 |
| _CPM_Rate | 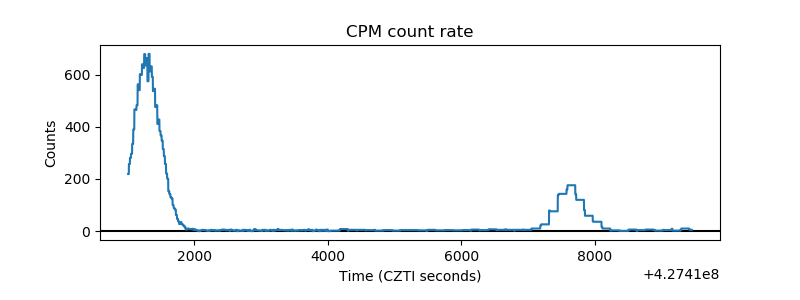 |
| CZT Counter |  |
| +2.5 Volts monitor | 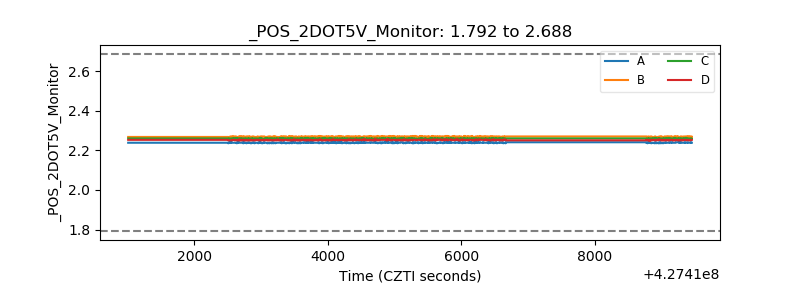 |
| +5 Volts monitor | 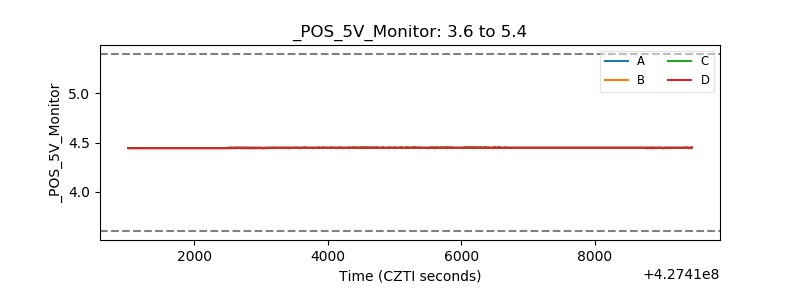 |
| _ROLL_ROT | 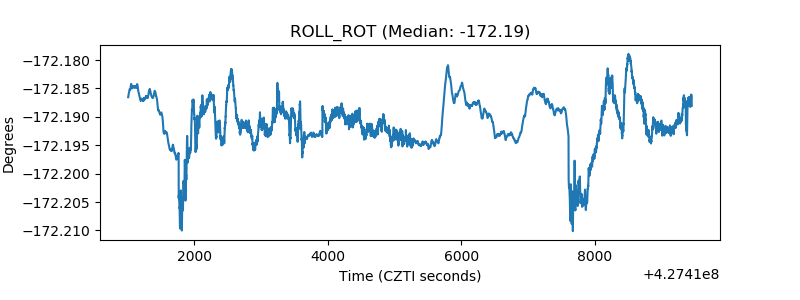 |
| _Roll_DEC | 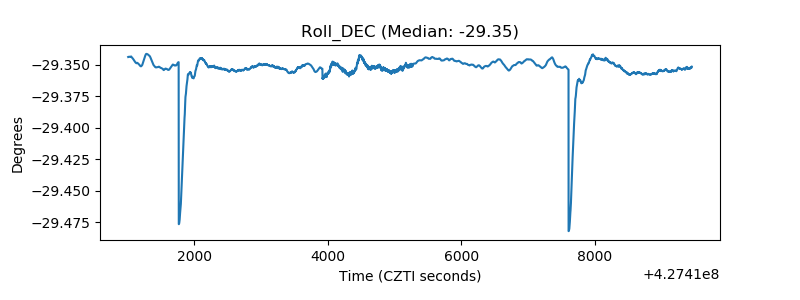 |
| _Roll_RA | 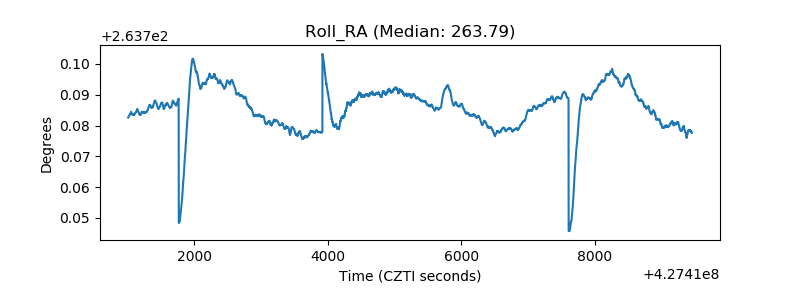 |
| Veto Counter | 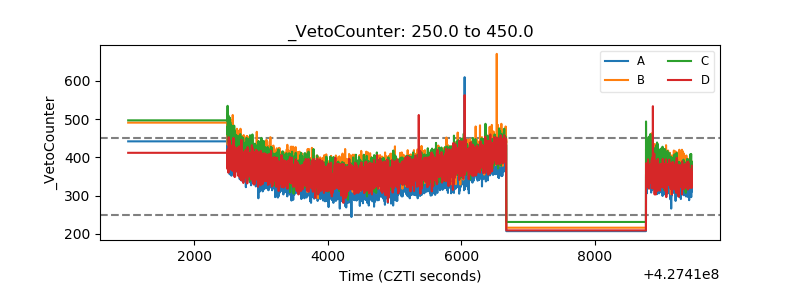 |