| Param | Original file | Final file |
|---|---|---|
| Filename | modeM0/AS1A12_089T01_9000005776_42202cztM0_level2.fits | modeM0/AS1A12_089T01_9000005776_42202cztM0_level2_quad_clean.evt |
| Size (bytes) | 309,052,800 | 84,864,960 |
| Size | 294.7 MB | 80.9 MB |
| Events in quadrant A | 3,001,241 | 568,509 |
| Events in quadrant B | 2,442,926 | 586,982 |
| Events in quadrant C | 2,389,421 | 552,811 |
| Events in quadrant D | 3,200,853 | 496,812 |
| Mode SS | |||
|---|---|---|---|
| Quadrant | BADHDUFLAG | Total packets | Discarded packets |
| A | 0 | 106 | 0 |
| B | 0 | 106 | 0 |
| C | 0 | 106 | 0 |
| D | 0 | 106 | 0 |
| Mode M0 | |||
|---|---|---|---|
| Quadrant | BADHDUFLAG | Total packets | Discarded packets |
| A | 0 | 12148 | 2 |
| B | 0 | 10958 | 2 |
| C | 0 | 10465 | 2 |
| D | 0 | 13230 | 2 |
| Mode M9 | |||
|---|---|---|---|
| Quadrant | BADHDUFLAG | Total packets | Discarded packets |
| A | 0 | 28 | 0 |
| B | 0 | 29 | 0 |
| C | 0 | 29 | 0 |
| D | 0 | 29 | 0 |
| Quadrant | Total seconds | Saturated seconds | Saturation percentage |
|---|---|---|---|
| A | 5204 | 48 | 0.922367% |
| B | 5204 | 39 | 0.749424% |
| C | 5204 | 4 | 0.076864% |
| D | 5204 | 161 | 3.093774% |
Noise dominated data is calculated using 1-second bins in cleaned event files. If a bin has >2000 counts, and if more than 50% of those come from <1% of pixels, then it is considered to be noise-dominated and hence unusable.
| Quadrant | # 1 sec bins | Bins with >0 counts | Bins with >2000 counts | High rate bins dominated by noise | Noise dominated (total time) | Noise dominated (detector-on time) | Marked lightcurve |
|---|---|---|---|---|---|---|---|
| A | 7027 | 5205 | 58 | 58 | 0.83% | 1.11% | 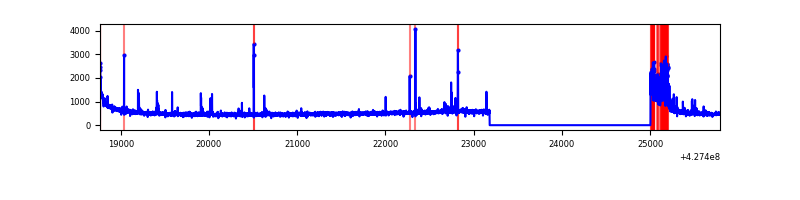 |
| B | 7027 | 5205 | 33 | 33 | 0.47% | 0.63% | 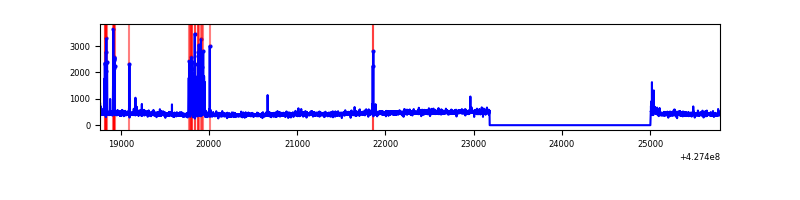 |
| C | 7027 | 5205 | 0 | 0 | 0.00% | 0.00% | 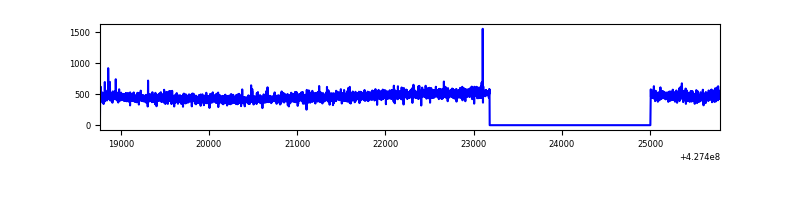 |
| D | 7027 | 5205 | 144 | 144 | 2.05% | 2.77% | 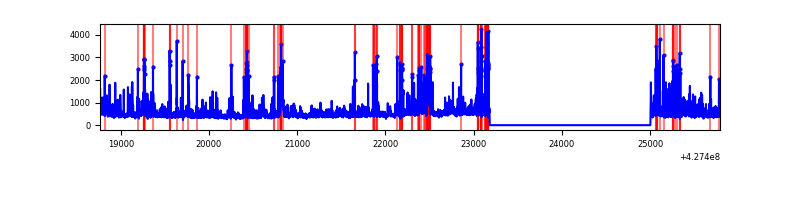 |
Top three noisy pixels from each quadrant. If the there are fewer than three noisy pixels in the level2.evt file, extra rows are filled as -1
| Pixel properties | Quadrant properties | ||||||
|---|---|---|---|---|---|---|---|
| Quadrant | DetID | PixID | Counts | Sigma | Mean | Median | Sigma |
| A | 10 | 83 | 520072 | 4444.28 | 561 | 549 | 116.9 |
| A | 15 | 223 | 191980 | 1637.6 | 561 | 549 | 116.9 |
| A | 15 | 222 | 44473 | 375.75 | 561 | 549 | 116.9 |
| B | 7 | 202 | 130833 | 1191.36 | 562 | 546 | 109.4 |
| B | 0 | 229 | 39086 | 352.42 | 562 | 546 | 109.4 |
| B | 15 | 35 | 30083 | 270.09 | 562 | 546 | 109.4 |
| C | 15 | 214 | 217624 | 1671.93 | 549 | 553 | 129.8 |
| C | 15 | 159 | 18495 | 138.19 | 549 | 553 | 129.8 |
| C | 7 | 220 | 6328 | 44.48 | 549 | 553 | 129.8 |
| D | 1 | 52 | 619290 | 4672.6 | 536 | 519 | 132.4 |
| D | 13 | 249 | 153055 | 1151.86 | 536 | 519 | 132.4 |
| D | 12 | 6 | 73407 | 550.41 | 536 | 519 | 132.4 |
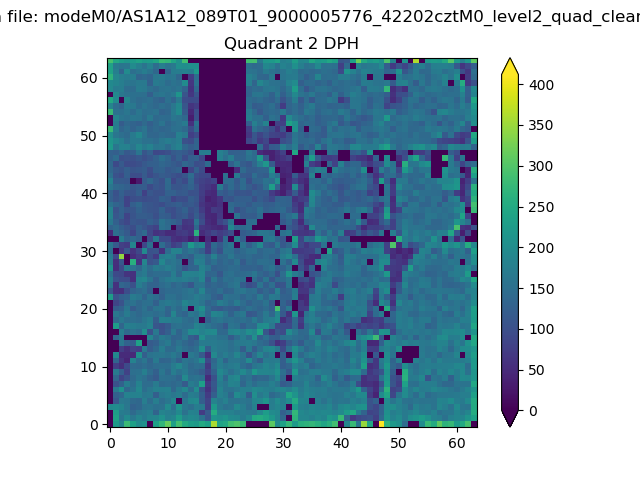
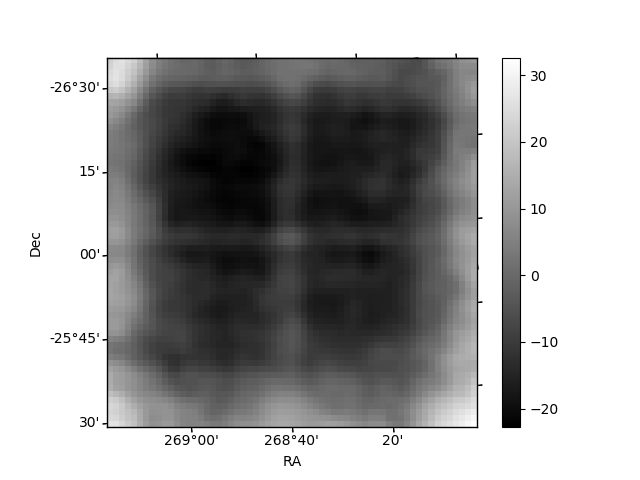
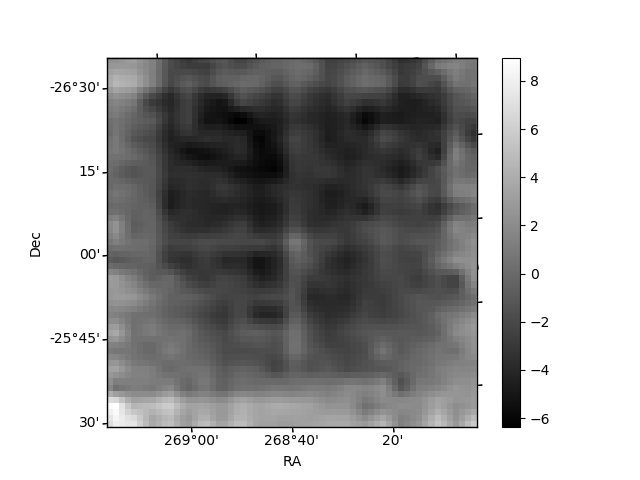
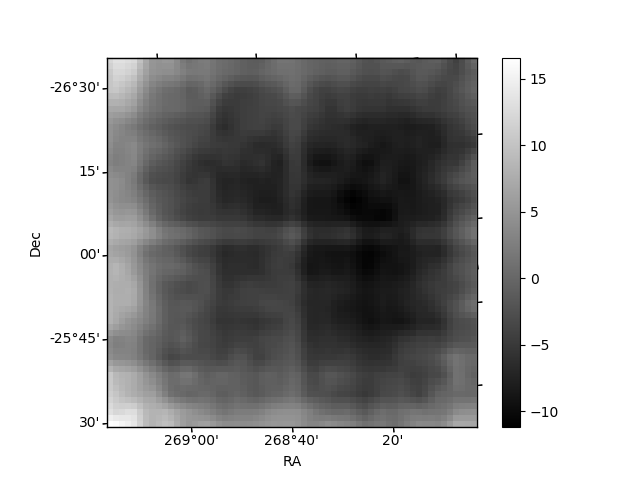
Histogram calculated using DETX and DETY for each event in the final _common_clean file
| Quadrant A | 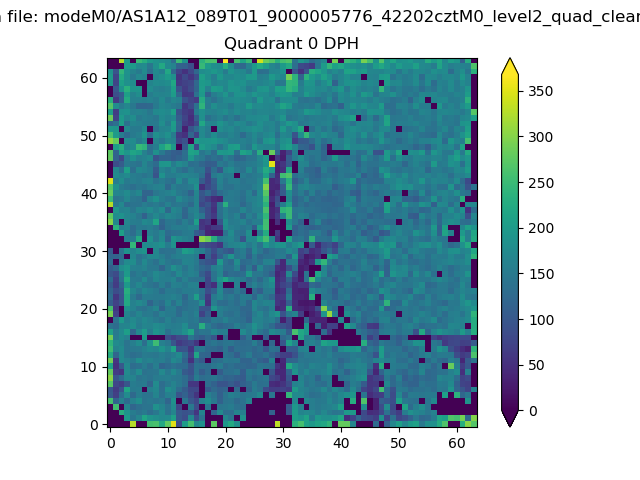 |
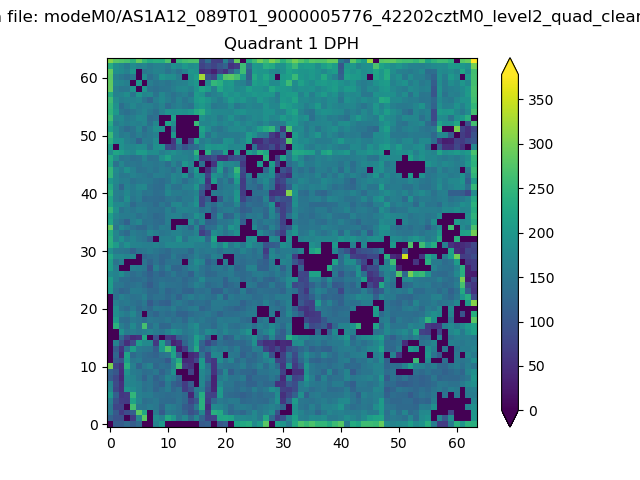 |
Quadrant B |
|---|---|---|---|
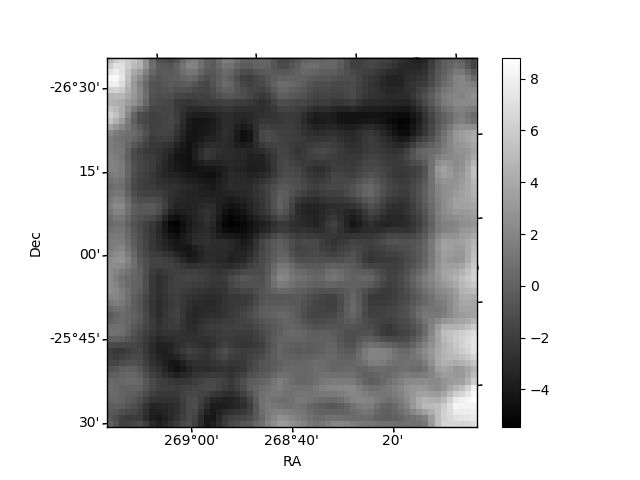
| Quadrant D | 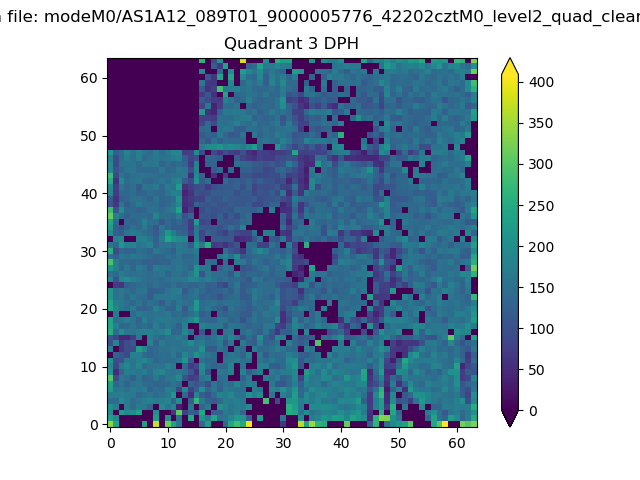 |
 |
Quadrant C |
| Plot type | Count rate plots | Images |
|---|---|---|
| Comparison with Poisson distribution Blue bars denote a histogram of data divided into 1 sec bins. Red curve is a Poisson curve with rate = median count rate of data. |
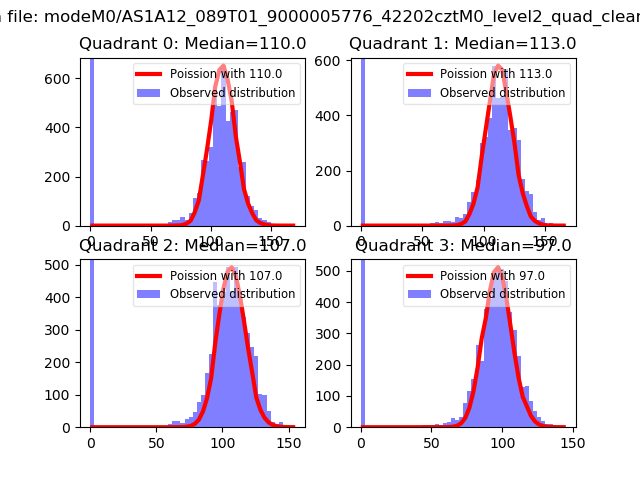 |
 |
| Quadrant-wise count rates Data is divided into 100 sec bins |
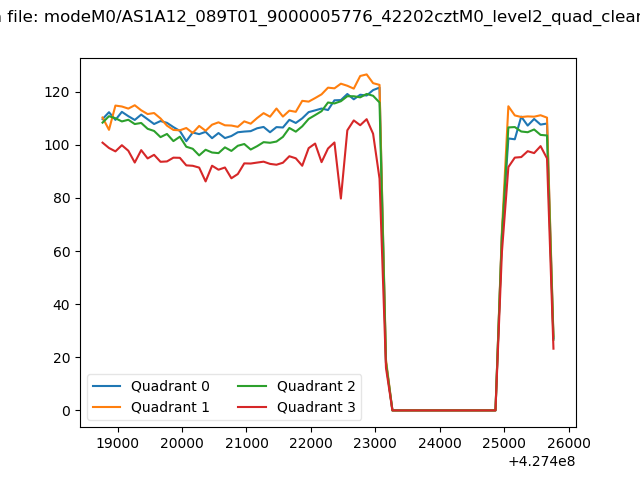 |
|
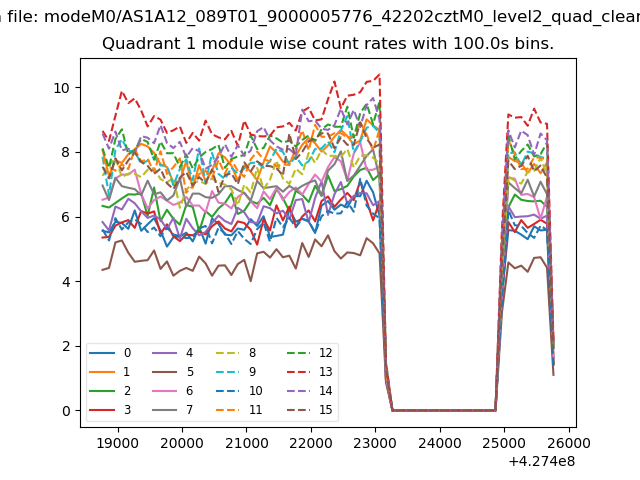
| Module-wise count rates for Quadrant A Data is divided into 100 sec bins |
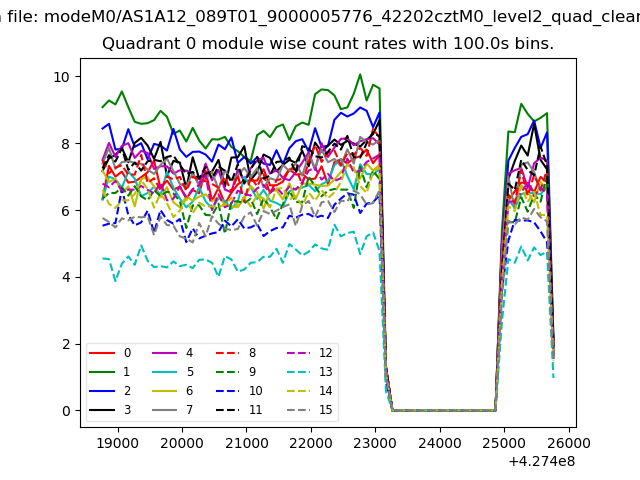 |
 |
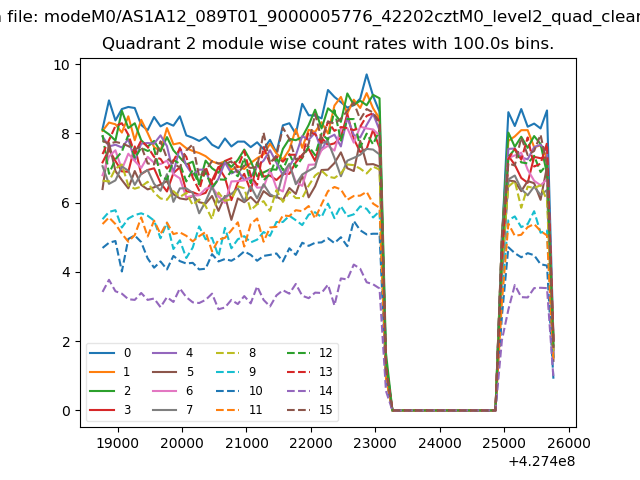
| Module-wise count rates for Quadrant B Data is divided into 100 sec bins |
 |
 |
| Module-wise count rates for Quadrant C Data is divided into 100 sec bins |
 |
 |
| Module-wise count rates for Quadrant D Data is divided into 100 sec bins |
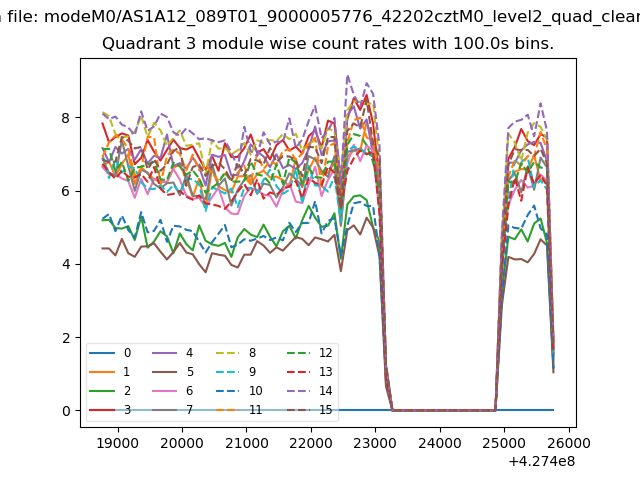 |
 |
| Parameter | Plot |
|---|---|
| CZT HV Monitor | 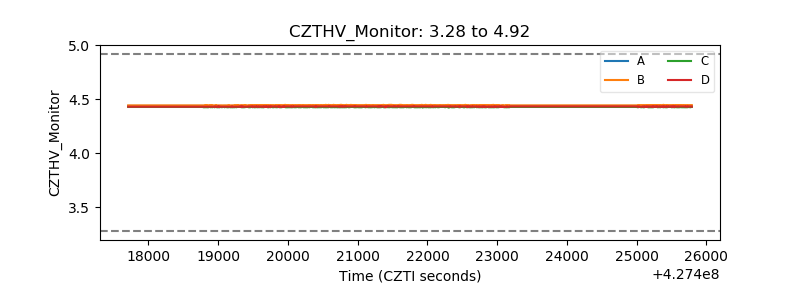 |
| D_VDD | 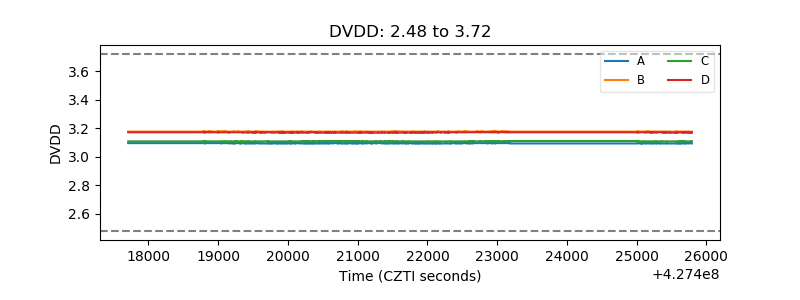 |
| Temperature 1 | 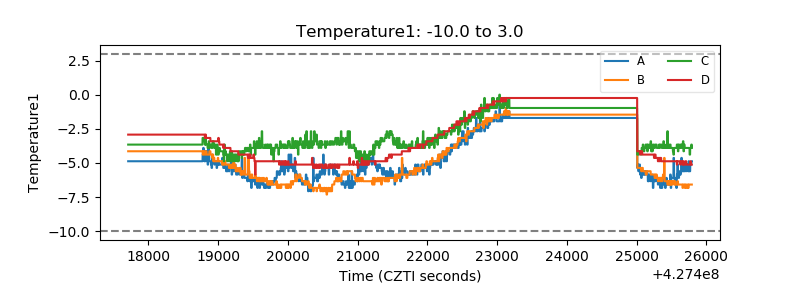 |
| Veto HV Monitor | 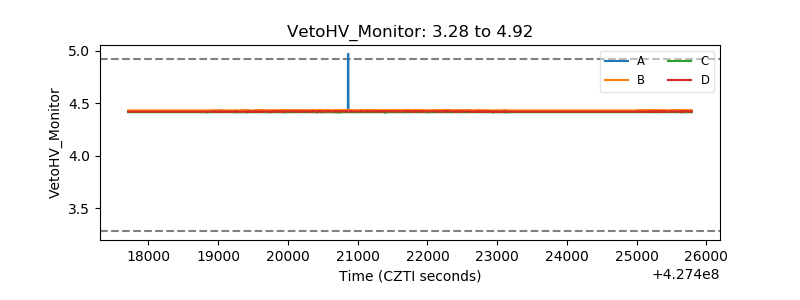 |
| Veto LLD | 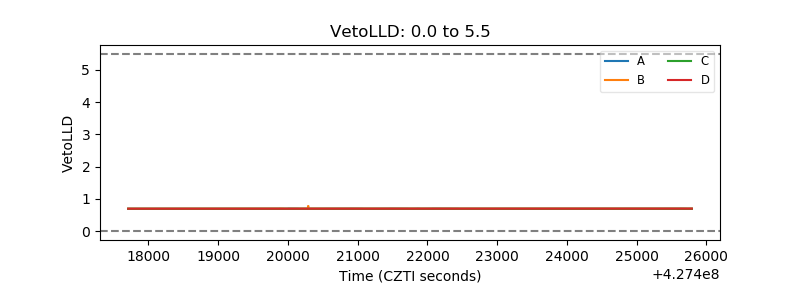 |
| Alpha Counter | 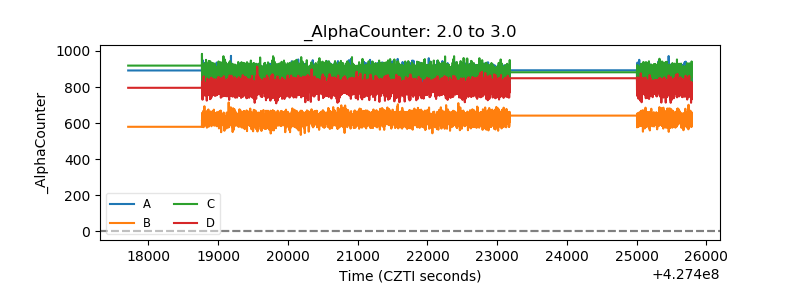 |
| _CPM_Rate |  |
| CZT Counter | 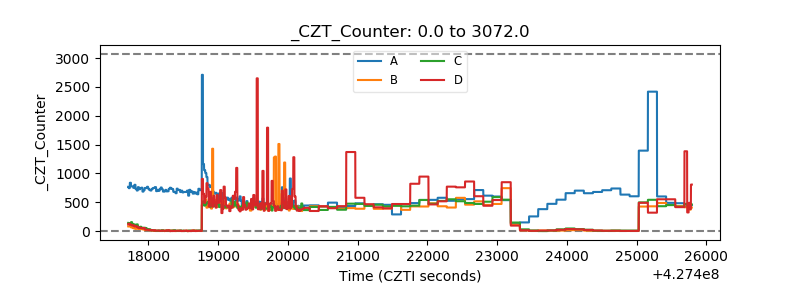 |
| +2.5 Volts monitor | 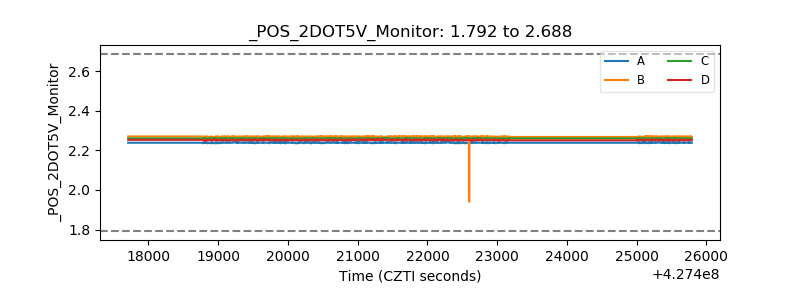 |
| +5 Volts monitor | 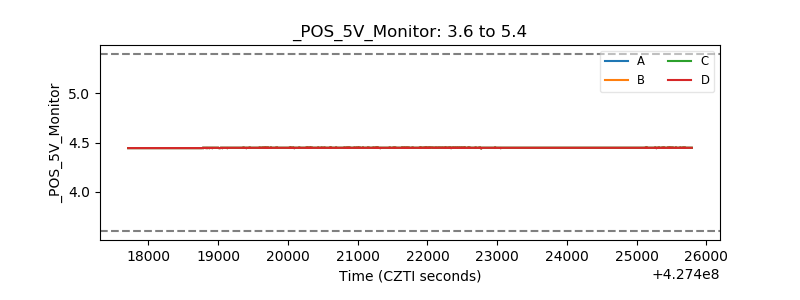 |
| _ROLL_ROT | 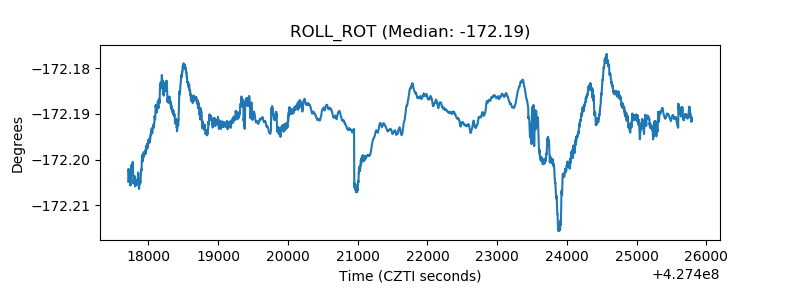 |
| _Roll_DEC | 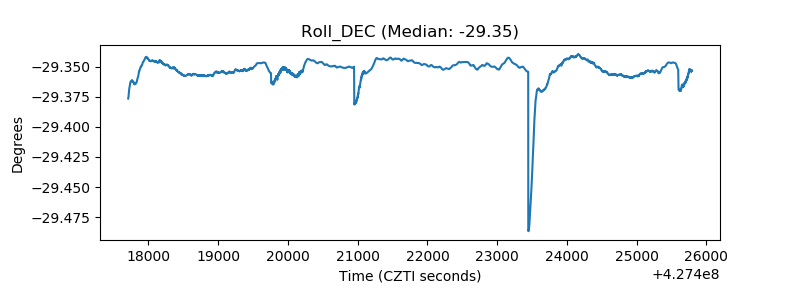 |
| _Roll_RA | 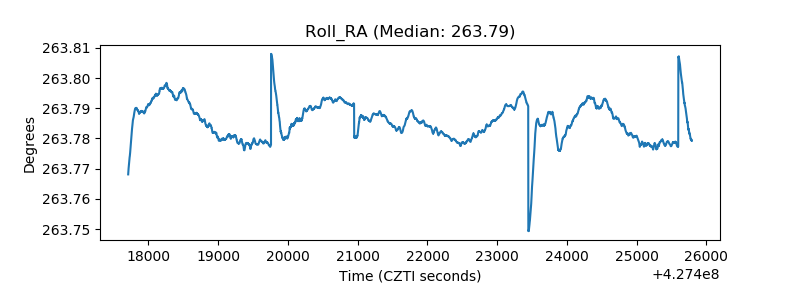 |
| Veto Counter | 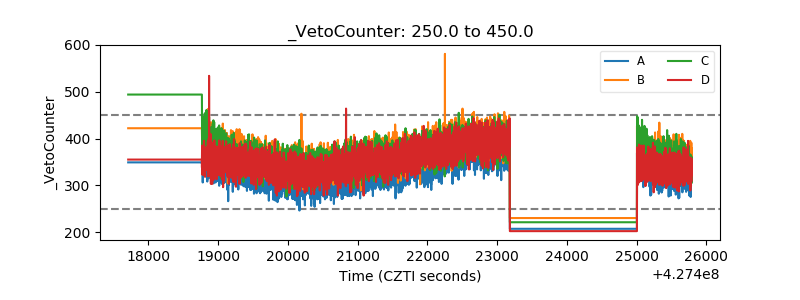 |