| Param | Original file | Final file |
|---|---|---|
| Filename | modeM0/AS1A12_089T01_9000005776_42203cztM0_level2.fits | modeM0/AS1A12_089T01_9000005776_42203cztM0_level2_quad_clean.evt |
| Size (bytes) | 346,227,840 | 95,783,040 |
| Size | 330.2 MB | 91.3 MB |
| Events in quadrant A | 3,311,438 | 642,581 |
| Events in quadrant B | 2,641,192 | 659,702 |
| Events in quadrant C | 2,827,492 | 622,811 |
| Events in quadrant D | 3,577,043 | 563,216 |
| Mode SS | |||
|---|---|---|---|
| Quadrant | BADHDUFLAG | Total packets | Discarded packets |
| A | 0 | 122 | 0 |
| B | 0 | 122 | 0 |
| C | 0 | 122 | 0 |
| D | 0 | 122 | 0 |
| Mode M0 | |||
|---|---|---|---|
| Quadrant | BADHDUFLAG | Total packets | Discarded packets |
| A | 0 | 13353 | 2 |
| B | 0 | 11989 | 2 |
| C | 0 | 11964 | 2 |
| D | 0 | 14857 | 2 |
| Mode M9 | |||
|---|---|---|---|
| Quadrant | BADHDUFLAG | Total packets | Discarded packets |
| A | 0 | 33 | 0 |
| B | 0 | 33 | 0 |
| C | 0 | 33 | 0 |
| D | 0 | 33 | 0 |
| Quadrant | Total seconds | Saturated seconds | Saturation percentage |
|---|---|---|---|
| A | 5893 | 39 | 0.661802% |
| B | 5894 | 7 | 0.118765% |
| C | 5894 | 4 | 0.067866% |
| D | 5893 | 157 | 2.664178% |
Noise dominated data is calculated using 1-second bins in cleaned event files. If a bin has >2000 counts, and if more than 50% of those come from <1% of pixels, then it is considered to be noise-dominated and hence unusable.
| Quadrant | # 1 sec bins | Bins with >0 counts | Bins with >2000 counts | High rate bins dominated by noise | Noise dominated (total time) | Noise dominated (detector-on time) | Marked lightcurve |
|---|---|---|---|---|---|---|---|
| A | 9209 | 5895 | 49 | 49 | 0.53% | 0.83% | 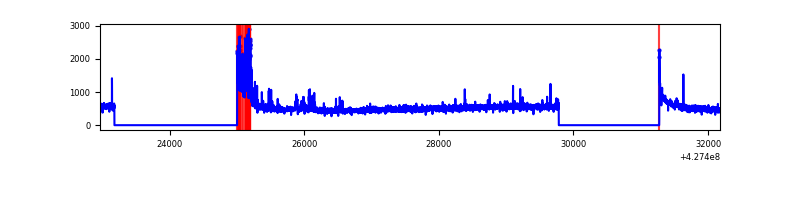 |
| B | 9210 | 5896 | 0 | 0 | 0.00% | 0.00% | 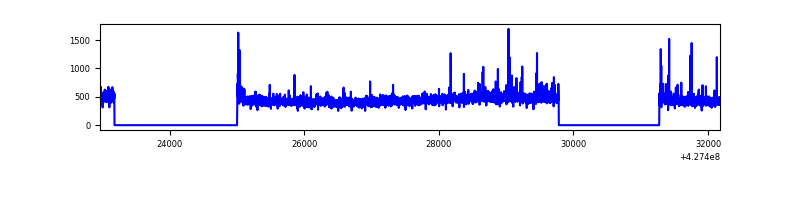 |
| C | 9210 | 5896 | 0 | 0 | 0.00% | 0.00% | 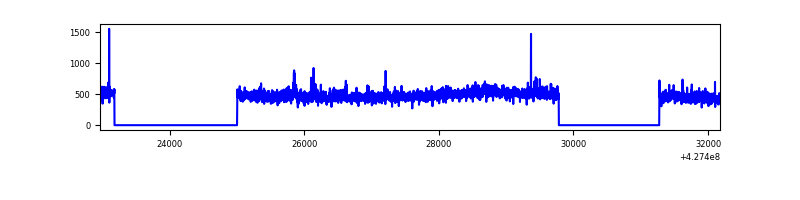 |
| D | 9209 | 5895 | 147 | 147 | 1.60% | 2.49% | 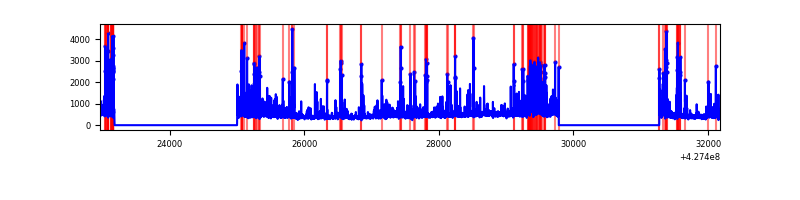 |
Top three noisy pixels from each quadrant. If the there are fewer than three noisy pixels in the level2.evt file, extra rows are filled as -1
| Pixel properties | Quadrant properties | ||||||
|---|---|---|---|---|---|---|---|
| Quadrant | DetID | PixID | Counts | Sigma | Mean | Median | Sigma |
| A | 10 | 83 | 569036 | 4269.18 | 641 | 628 | 133.1 |
| A | 15 | 223 | 181703 | 1360.01 | 641 | 628 | 133.1 |
| A | 7 | 3 | 30805 | 226.65 | 641 | 628 | 133.1 |
| B | 0 | 229 | 61435 | 483.78 | 641 | 621 | 125.7 |
| B | 5 | 255 | 28974 | 225.55 | 641 | 621 | 125.7 |
| B | 12 | 111 | 16004 | 122.37 | 641 | 621 | 125.7 |
| C | 15 | 214 | 245390 | 1663.92 | 626 | 627 | 147.1 |
| C | 15 | 159 | 130098 | 880.16 | 626 | 627 | 147.1 |
| C | 7 | 220 | 6724 | 41.45 | 626 | 627 | 147.1 |
| D | 1 | 52 | 669552 | 4368.76 | 617 | 597 | 153.1 |
| D | 12 | 6 | 176310 | 1147.53 | 617 | 597 | 153.1 |
| D | 2 | 249 | 83747 | 543.03 | 617 | 597 | 153.1 |
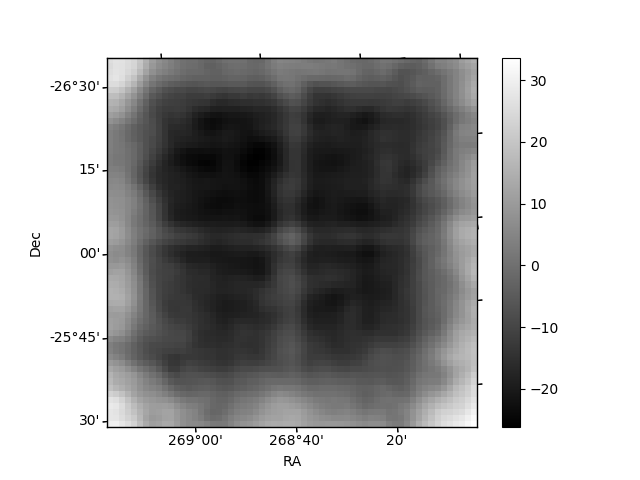
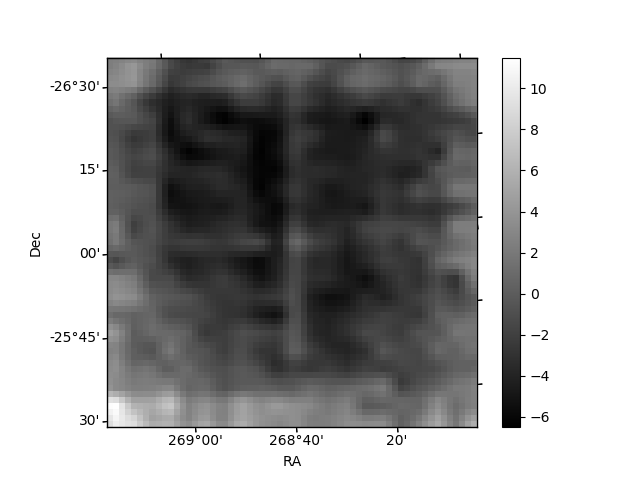
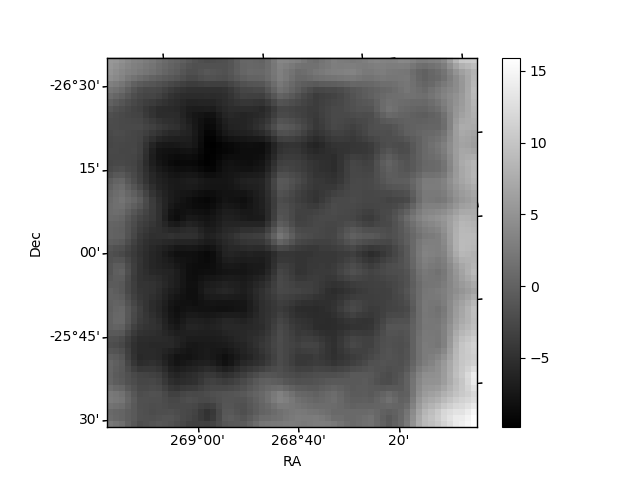
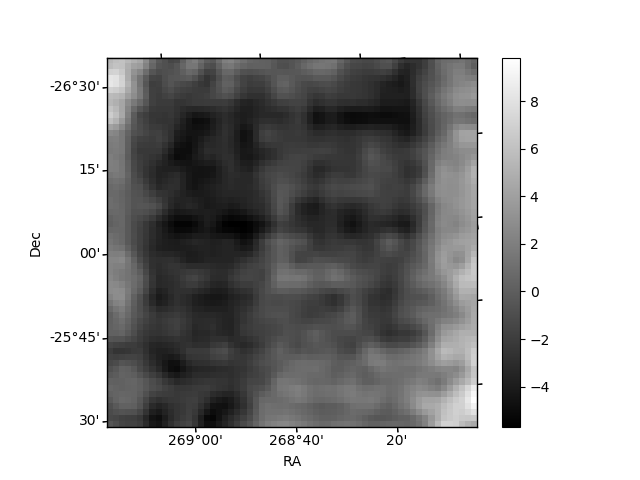
Histogram calculated using DETX and DETY for each event in the final _common_clean file
| Quadrant A | 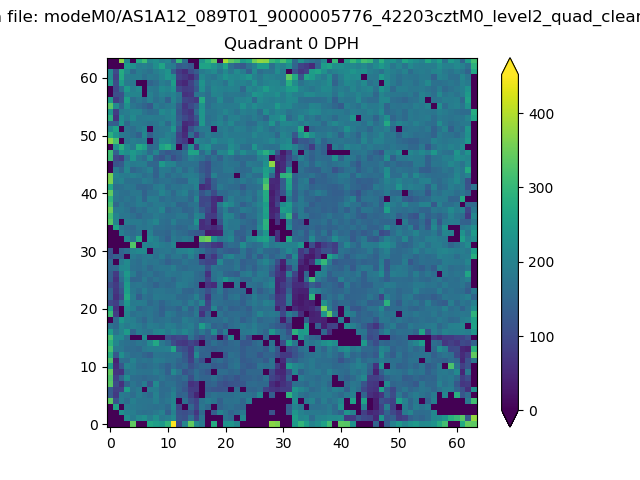 |
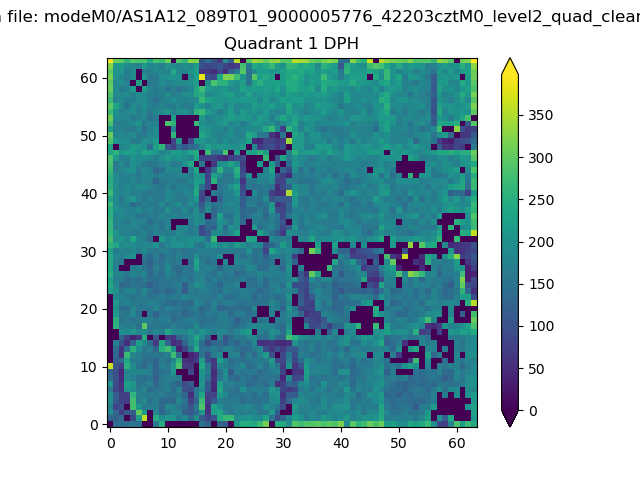 |
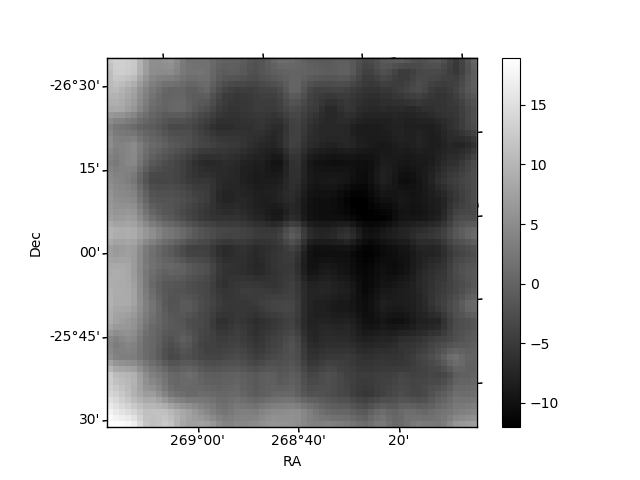
Quadrant B |
|---|---|---|---|
| Quadrant D | 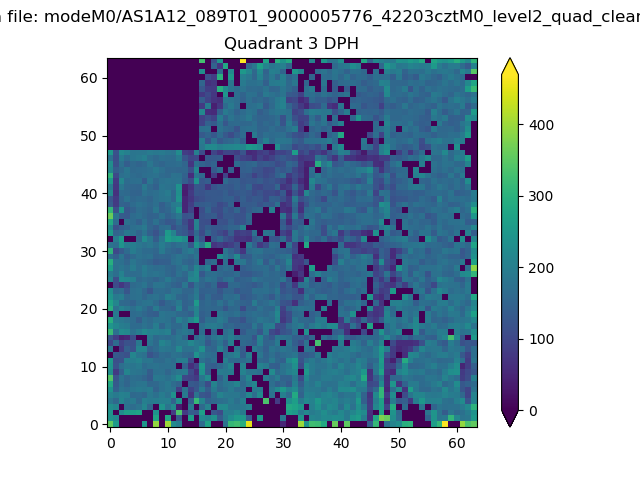 |
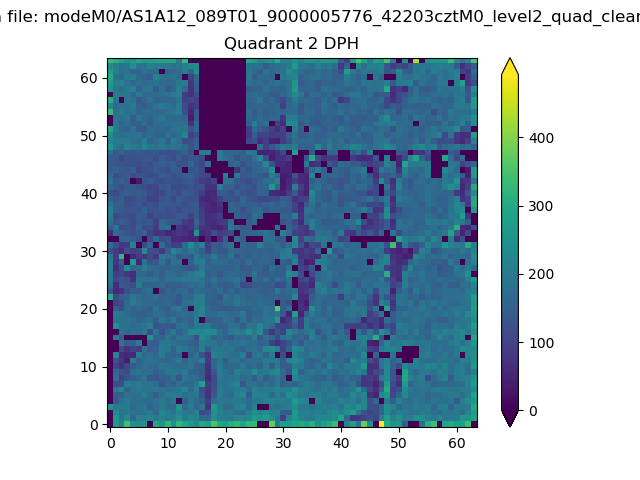 |
Quadrant C |
| Plot type | Count rate plots | Images |
|---|---|---|
| Comparison with Poisson distribution Blue bars denote a histogram of data divided into 1 sec bins. Red curve is a Poisson curve with rate = median count rate of data. |
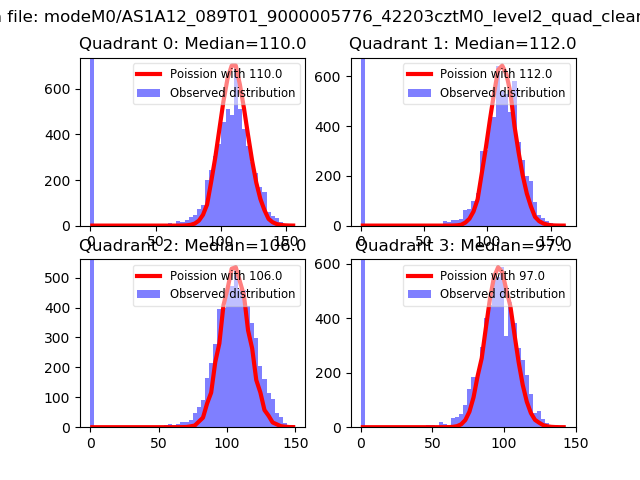 |
 |
| Quadrant-wise count rates Data is divided into 100 sec bins |
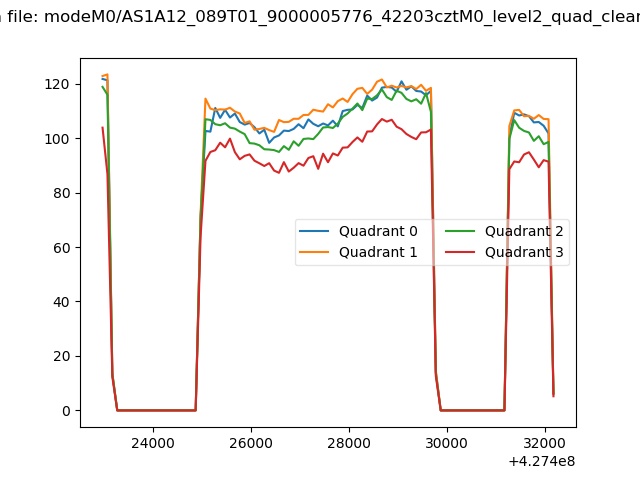 |
|
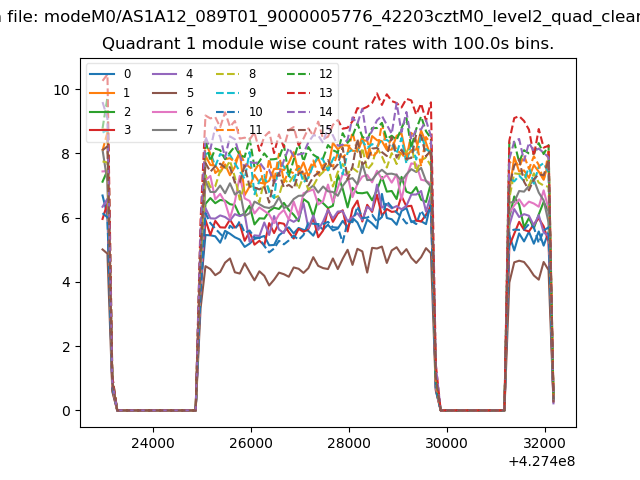
| Module-wise count rates for Quadrant A Data is divided into 100 sec bins |
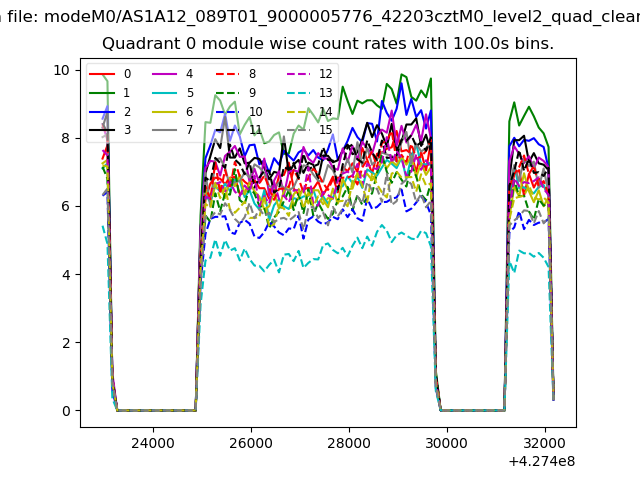 |
 |
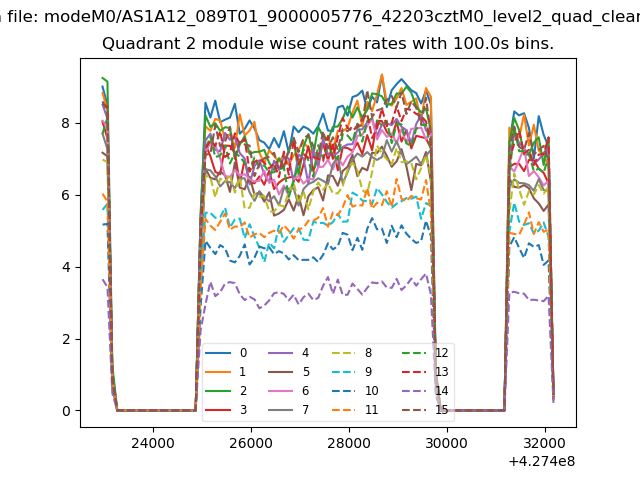
| Module-wise count rates for Quadrant B Data is divided into 100 sec bins |
 |
 |
| Module-wise count rates for Quadrant C Data is divided into 100 sec bins |
 |
 |
| Module-wise count rates for Quadrant D Data is divided into 100 sec bins |
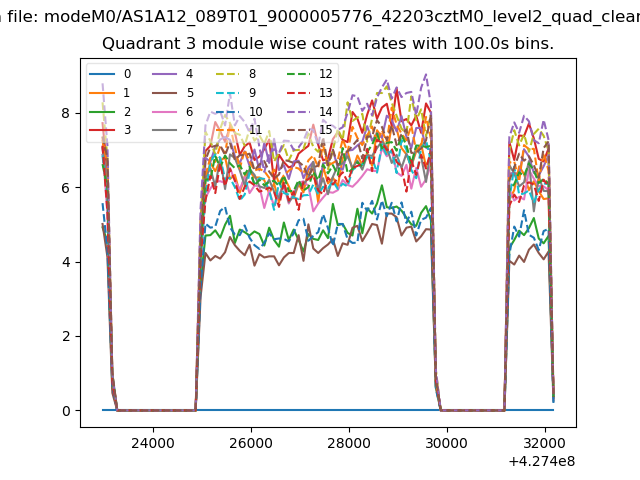 |
 |
| Parameter | Plot |
|---|---|
| CZT HV Monitor | 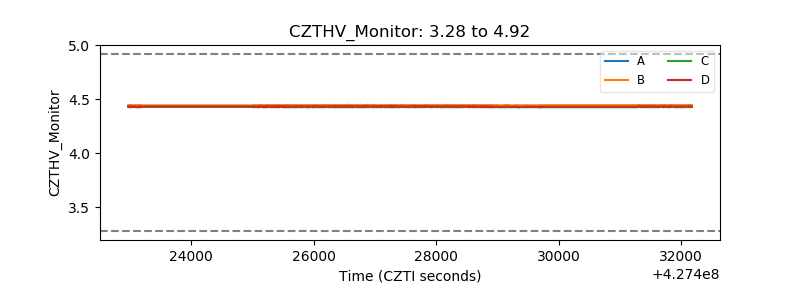 |
| D_VDD | 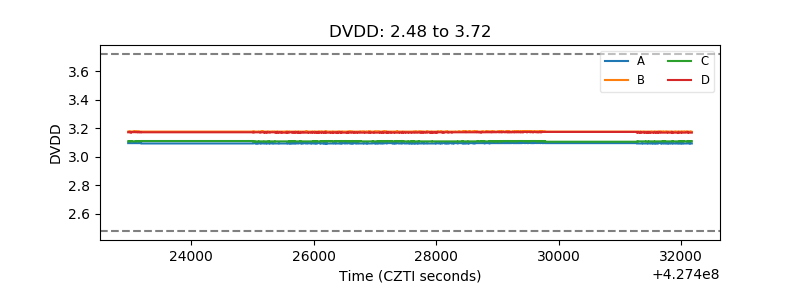 |
| Temperature 1 | 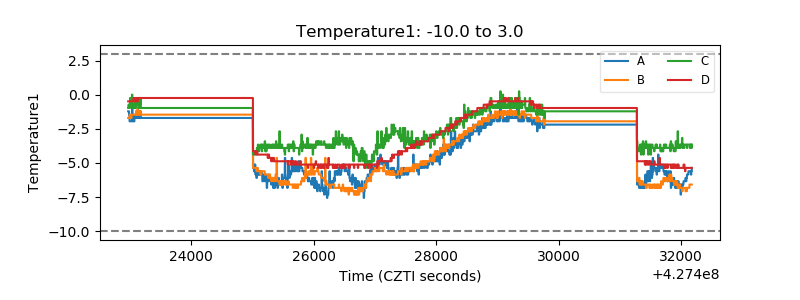 |
| Veto HV Monitor | 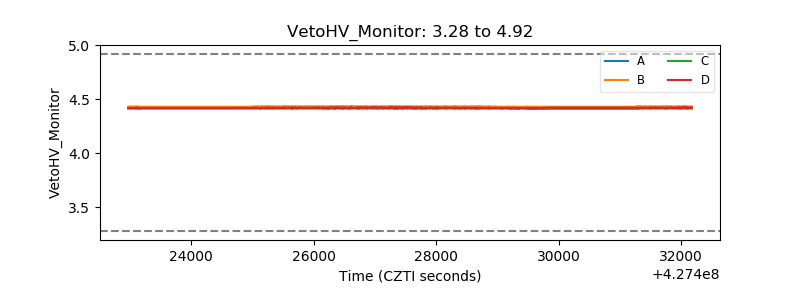 |
| Veto LLD | 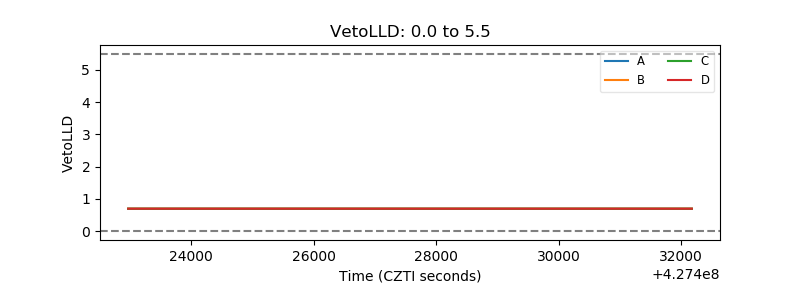 |
| Alpha Counter | 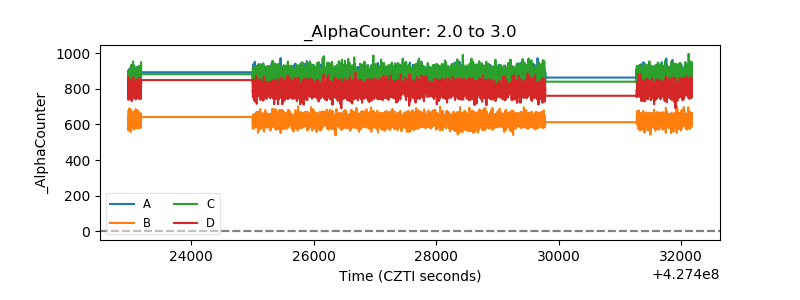 |
| _CPM_Rate | 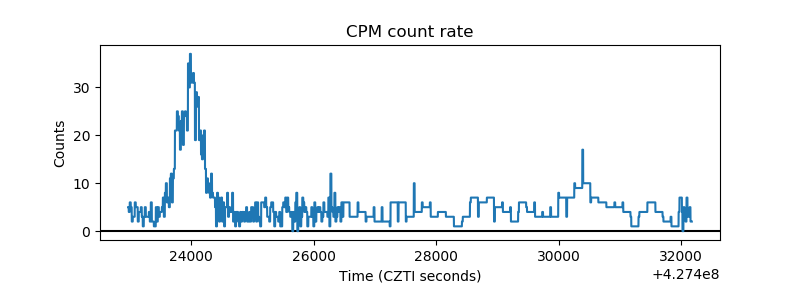 |
| CZT Counter | 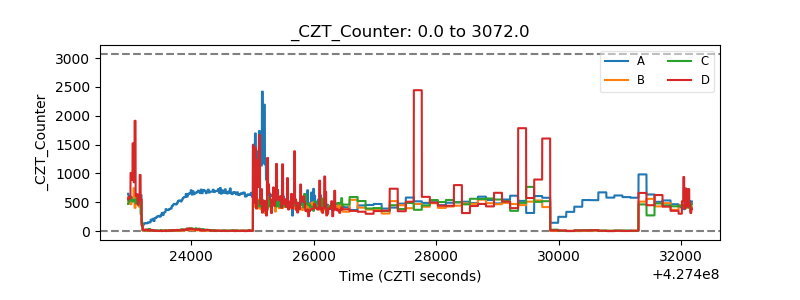 |
| +2.5 Volts monitor | 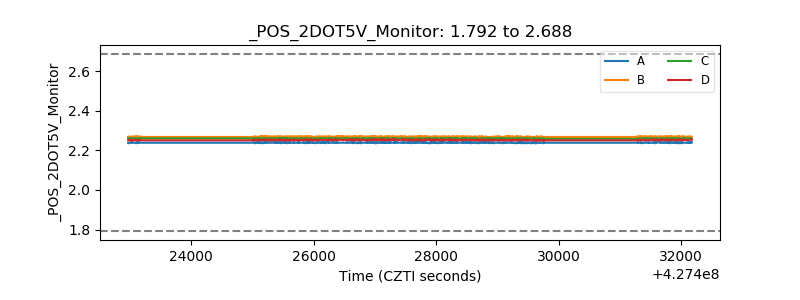 |
| +5 Volts monitor | 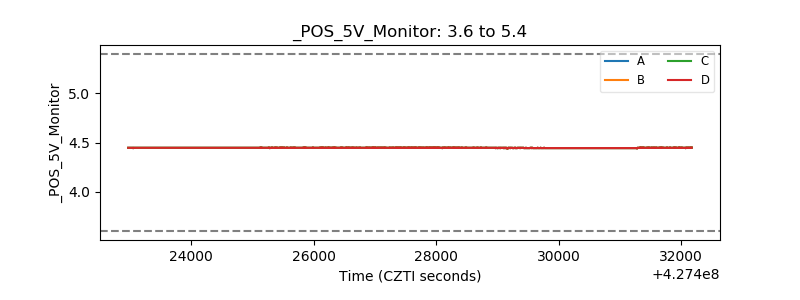 |
| _ROLL_ROT | 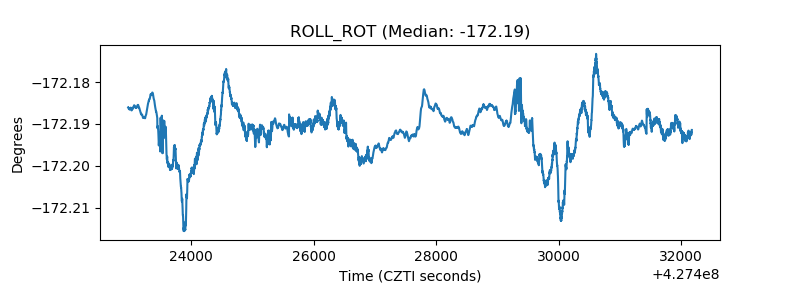 |
| _Roll_DEC | 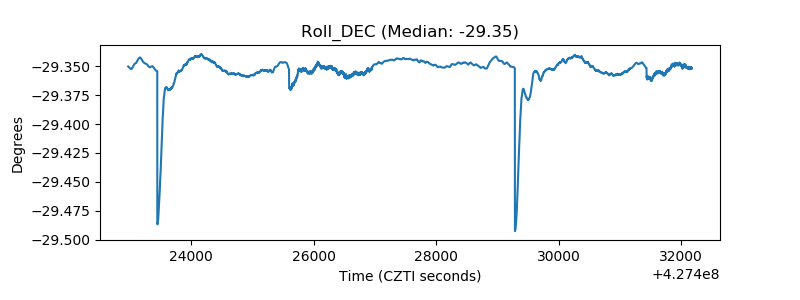 |
| _Roll_RA | 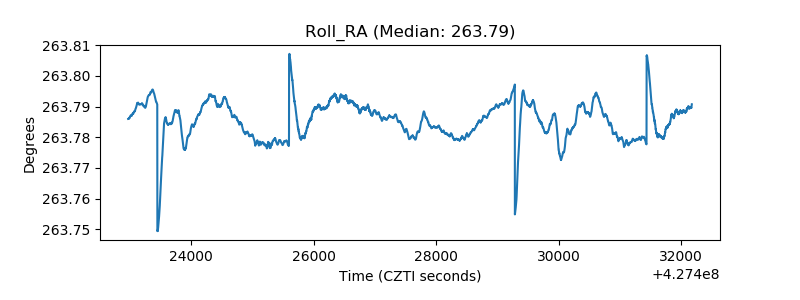 |
| Veto Counter | 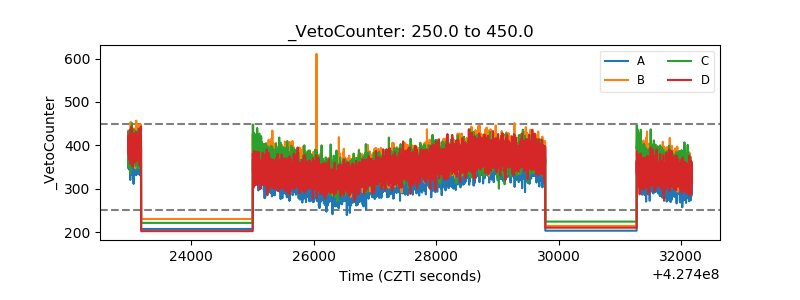 |