| Param | Original file | Final file |
|---|---|---|
| Filename | modeM0/AS1A12_089T01_9000005776_42204cztM0_level2.fits | modeM0/AS1A12_089T01_9000005776_42204cztM0_level2_quad_clean.evt |
| Size (bytes) | 340,732,800 | 94,440,960 |
| Size | 324.9 MB | 90.1 MB |
| Events in quadrant A | 3,164,567 | 632,153 |
| Events in quadrant B | 2,707,873 | 652,129 |
| Events in quadrant C | 2,684,159 | 611,196 |
| Events in quadrant D | 3,596,270 | 551,419 |
| Mode SS | |||
|---|---|---|---|
| Quadrant | BADHDUFLAG | Total packets | Discarded packets |
| A | 0 | 122 | 0 |
| B | 0 | 122 | 0 |
| C | 0 | 122 | 0 |
| D | 0 | 122 | 0 |
| Mode M0 | |||
|---|---|---|---|
| Quadrant | BADHDUFLAG | Total packets | Discarded packets |
| A | 0 | 12882 | 2 |
| B | 0 | 12207 | 3 |
| C | 0 | 11837 | 2 |
| D | 0 | 14978 | 2 |
| Mode M9 | |||
|---|---|---|---|
| Quadrant | BADHDUFLAG | Total packets | Discarded packets |
| A | 0 | 28 | 0 |
| B | 0 | 28 | 0 |
| C | 0 | 28 | 0 |
| D | 0 | 28 | 0 |
| Quadrant | Total seconds | Saturated seconds | Saturation percentage |
|---|---|---|---|
| A | 5904 | 26 | 0.440379% |
| B | 5903 | 29 | 0.491276% |
| C | 5904 | 2 | 0.033875% |
| D | 5904 | 190 | 3.218157% |
Noise dominated data is calculated using 1-second bins in cleaned event files. If a bin has >2000 counts, and if more than 50% of those come from <1% of pixels, then it is considered to be noise-dominated and hence unusable.
| Quadrant | # 1 sec bins | Bins with >0 counts | Bins with >2000 counts | High rate bins dominated by noise | Noise dominated (total time) | Noise dominated (detector-on time) | Marked lightcurve |
|---|---|---|---|---|---|---|---|
| A | 8710 | 5906 | 14 | 14 | 0.16% | 0.24% | 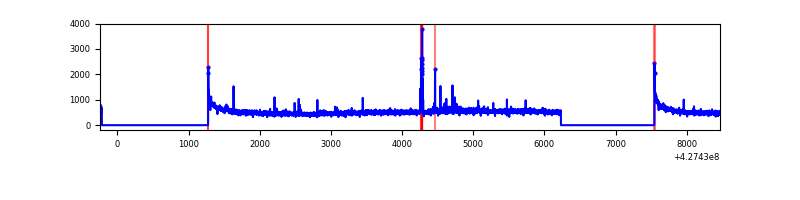 |
| B | 8709 | 5905 | 12 | 12 | 0.14% | 0.20% | 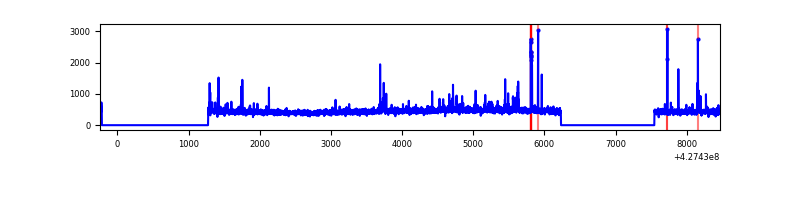 |
| C | 8710 | 5906 | 0 | 0 | 0.00% | 0.00% | 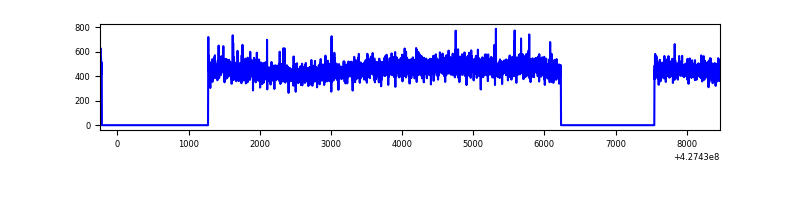 |
| D | 8710 | 5906 | 166 | 166 | 1.91% | 2.81% | 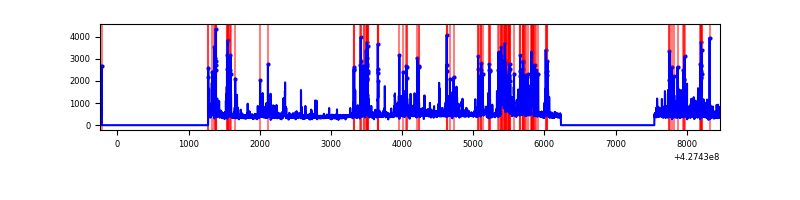 |
Top three noisy pixels from each quadrant. If the there are fewer than three noisy pixels in the level2.evt file, extra rows are filled as -1
| Pixel properties | Quadrant properties | ||||||
|---|---|---|---|---|---|---|---|
| Quadrant | DetID | PixID | Counts | Sigma | Mean | Median | Sigma |
| A | 10 | 83 | 592803 | 4480.67 | 638 | 623 | 132.2 |
| A | 13 | 248 | 64441 | 482.87 | 638 | 623 | 132.2 |
| A | 15 | 222 | 16580 | 120.74 | 638 | 623 | 132.2 |
| B | 0 | 229 | 95226 | 766.84 | 636 | 618 | 123.4 |
| B | 4 | 141 | 48120 | 385.02 | 636 | 618 | 123.4 |
| B | 3 | 112 | 22780 | 179.63 | 636 | 618 | 123.4 |
| C | 15 | 214 | 246978 | 1700.1 | 621 | 625 | 144.9 |
| C | 7 | 220 | 8124 | 51.75 | 621 | 625 | 144.9 |
| C | 13 | 61 | 4200 | 24.67 | 621 | 625 | 144.9 |
| D | 1 | 52 | 521490 | 3443.71 | 611 | 590 | 151.3 |
| D | 1 | 47 | 328997 | 2171.12 | 611 | 590 | 151.3 |
| D | 12 | 6 | 232146 | 1530.83 | 611 | 590 | 151.3 |
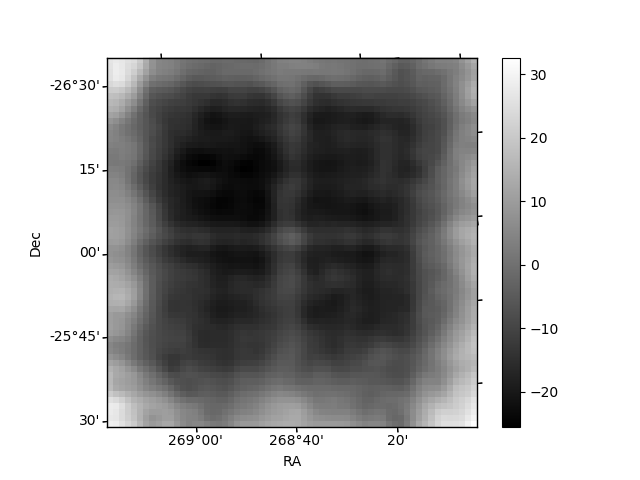
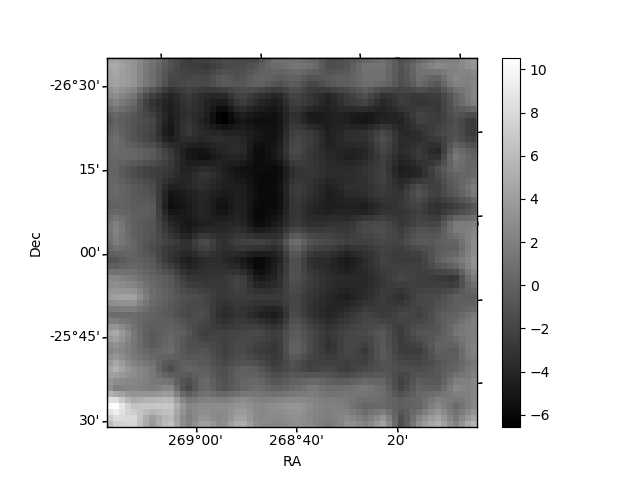
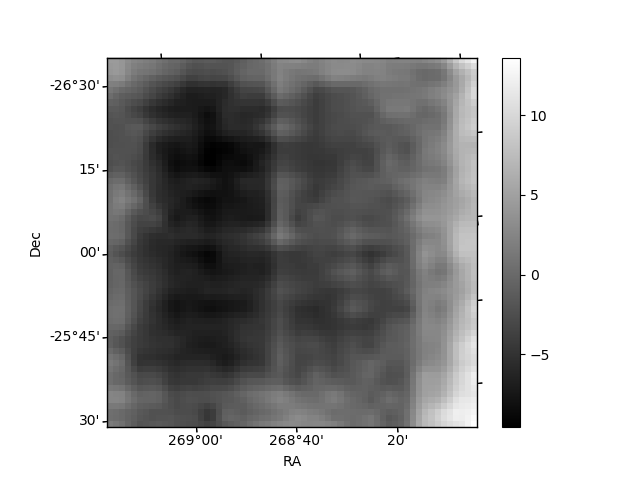
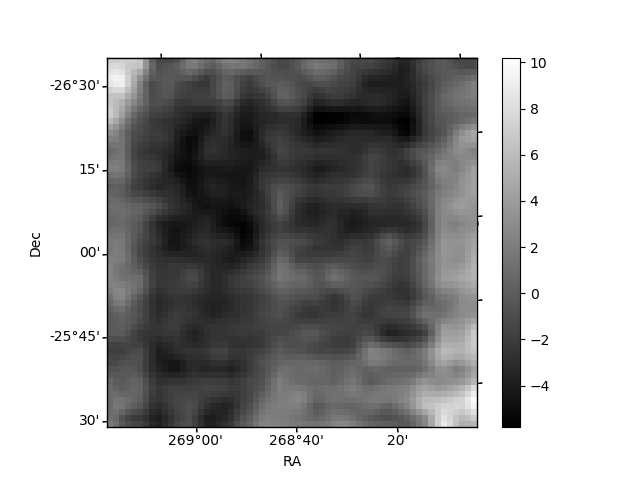
Histogram calculated using DETX and DETY for each event in the final _common_clean file
| Quadrant A | 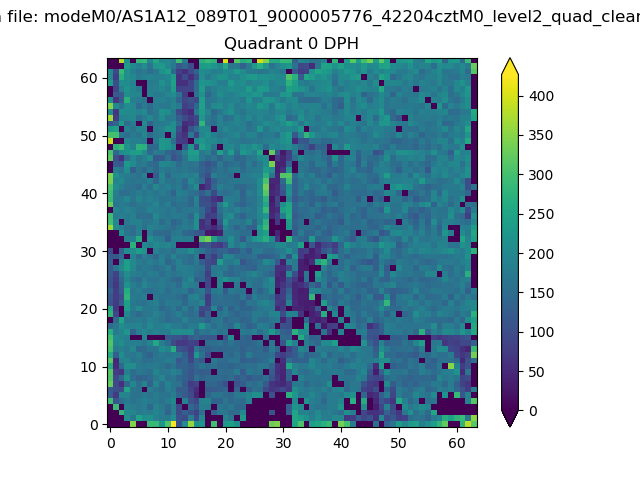 |
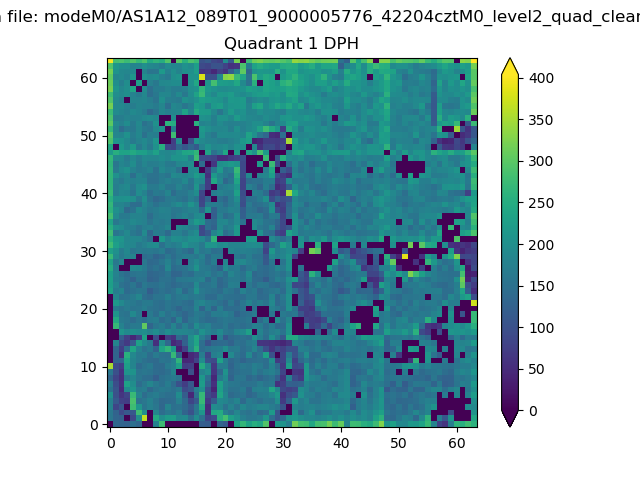 |
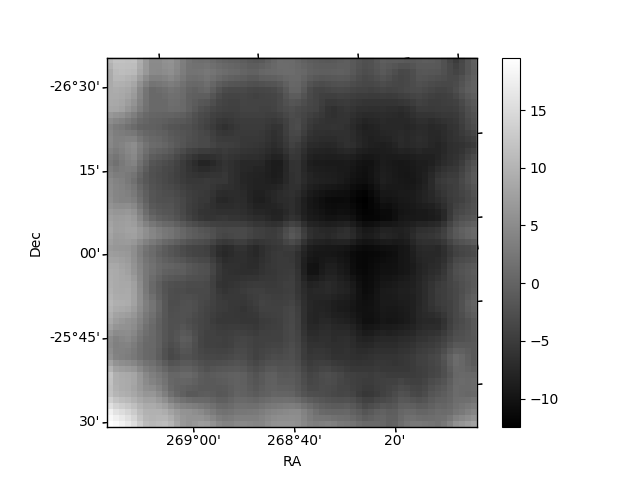
Quadrant B |
|---|---|---|---|
| Quadrant D | 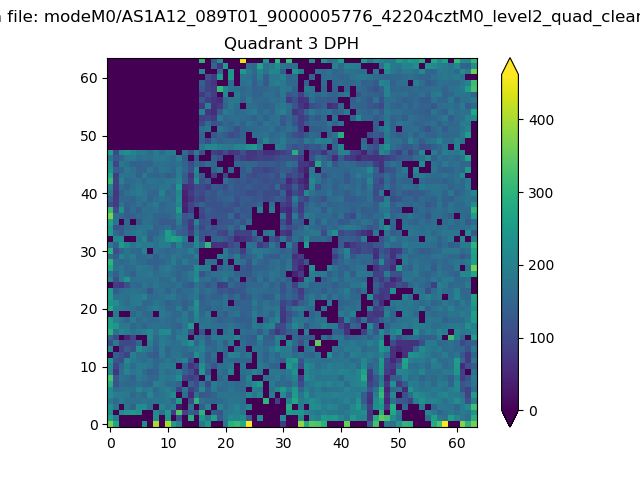 |
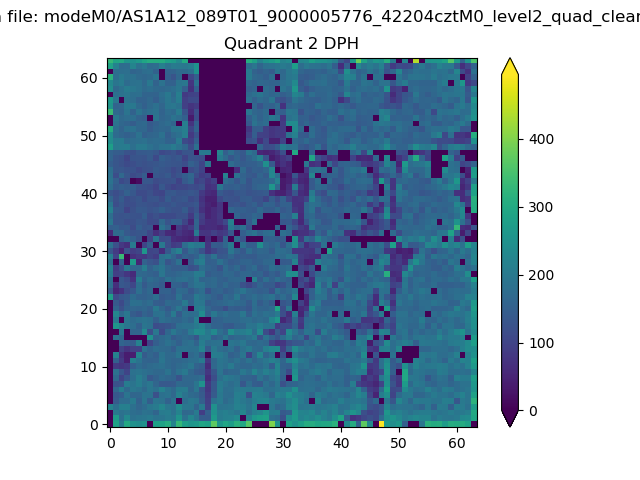 |
Quadrant C |
| Plot type | Count rate plots | Images |
|---|---|---|
| Comparison with Poisson distribution Blue bars denote a histogram of data divided into 1 sec bins. Red curve is a Poisson curve with rate = median count rate of data. |
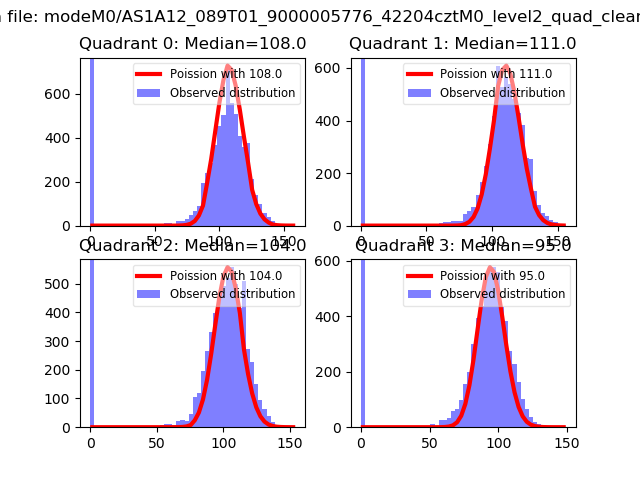 |
 |
| Quadrant-wise count rates Data is divided into 100 sec bins |
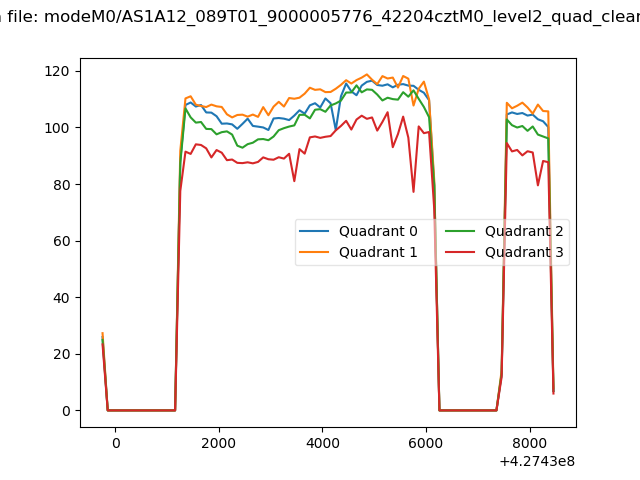 |
|
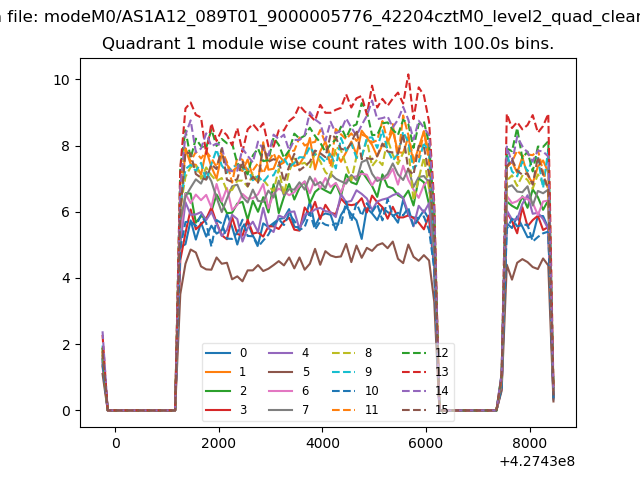
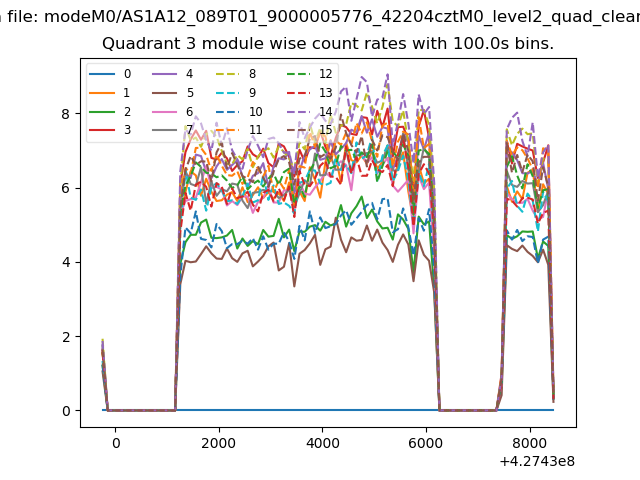
| Module-wise count rates for Quadrant A Data is divided into 100 sec bins |
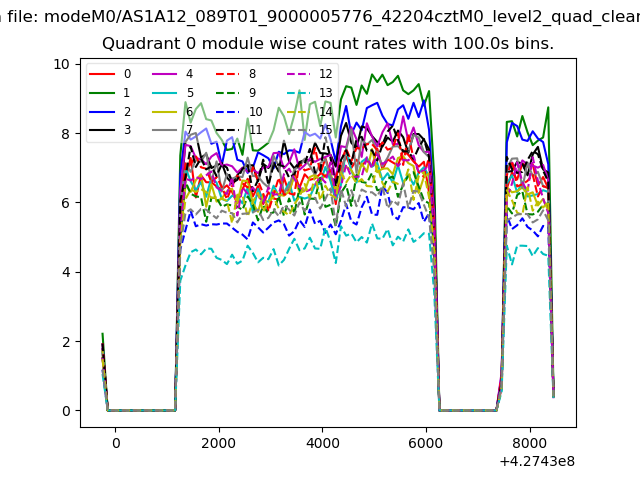 |
 |
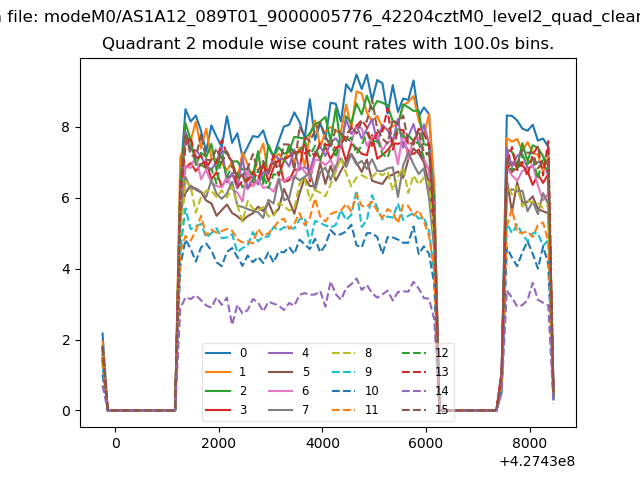
| Module-wise count rates for Quadrant B Data is divided into 100 sec bins |
 |
 |
| Module-wise count rates for Quadrant C Data is divided into 100 sec bins |
 |
 |
| Module-wise count rates for Quadrant D Data is divided into 100 sec bins |
 |
 |
| Parameter | Plot |
|---|---|
| CZT HV Monitor | 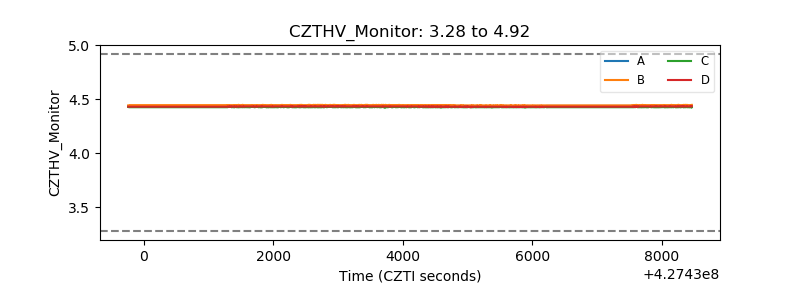 |
| D_VDD | 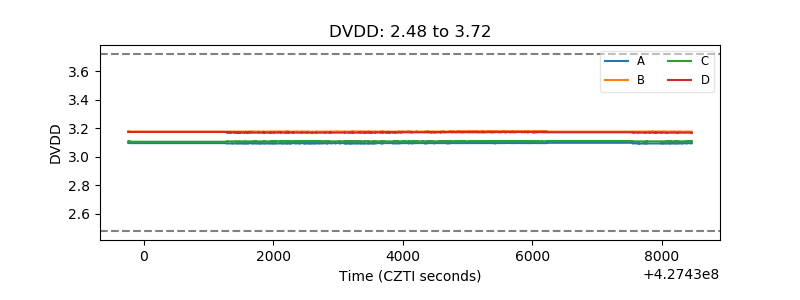 |
| Temperature 1 | 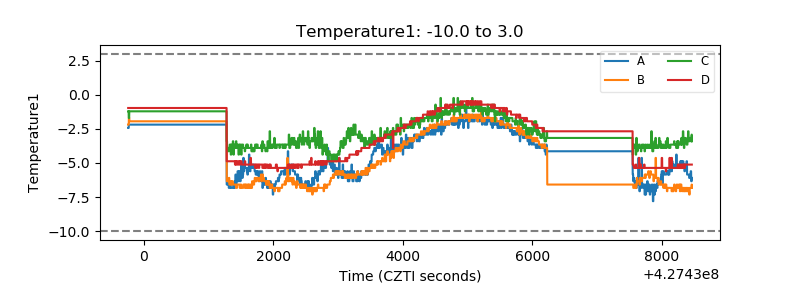 |
| Veto HV Monitor | 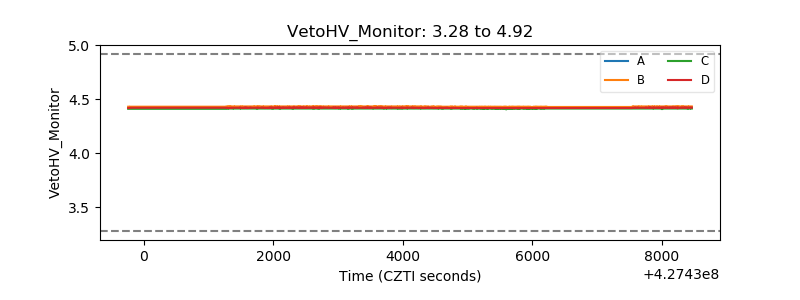 |
| Veto LLD | 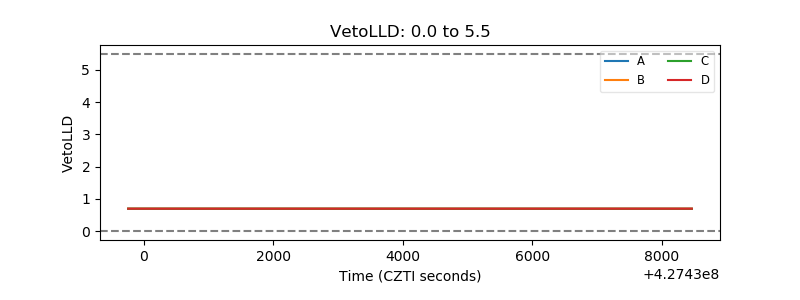 |
| Alpha Counter | 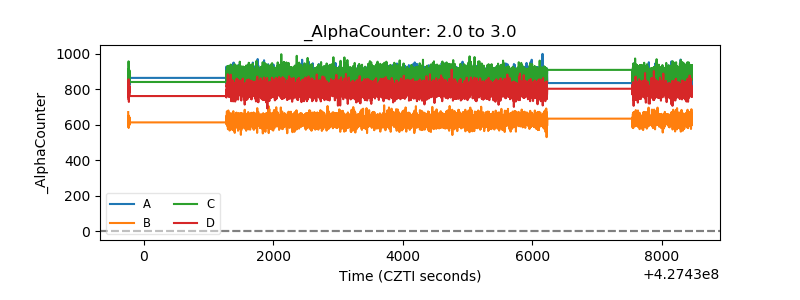 |
| _CPM_Rate | 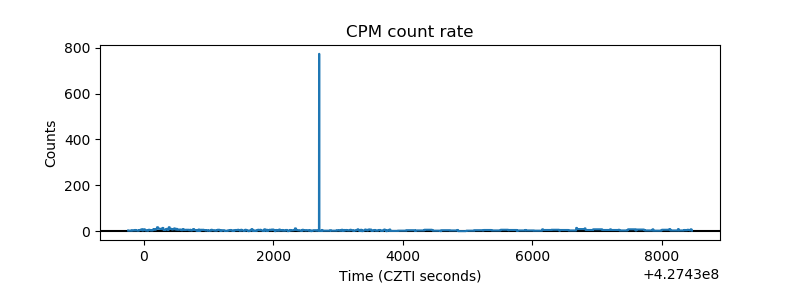 |
| CZT Counter |  |
| +2.5 Volts monitor | 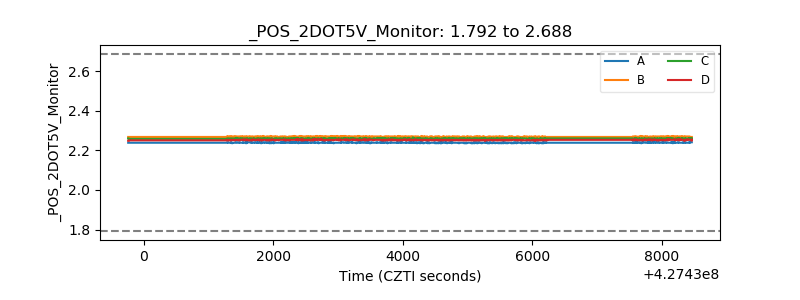 |
| +5 Volts monitor | 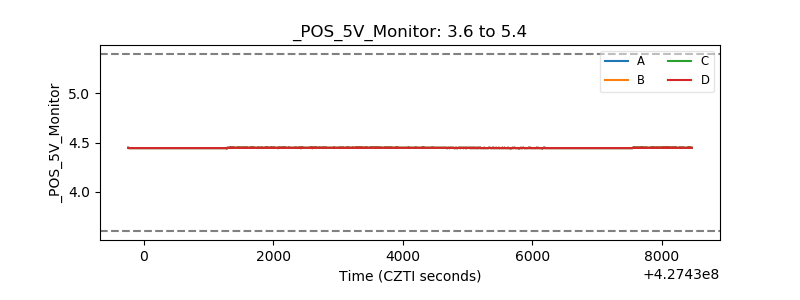 |
| _ROLL_ROT | 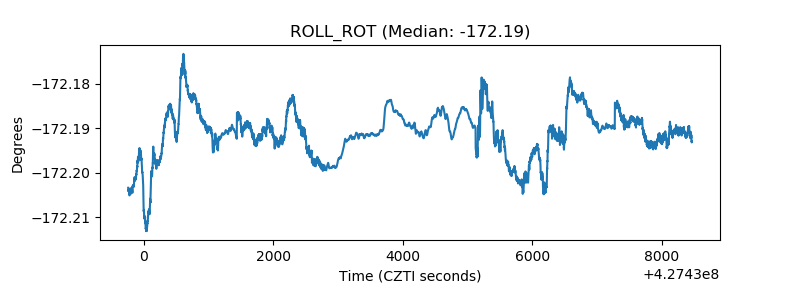 |
| _Roll_DEC | 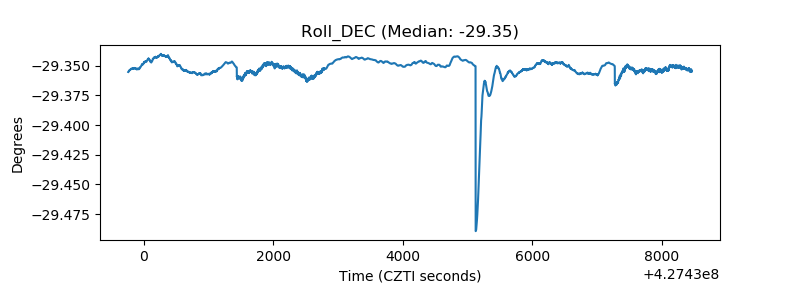 |
| _Roll_RA | 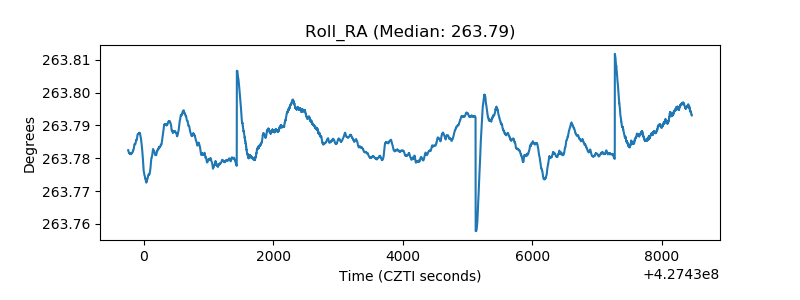 |
| Veto Counter | 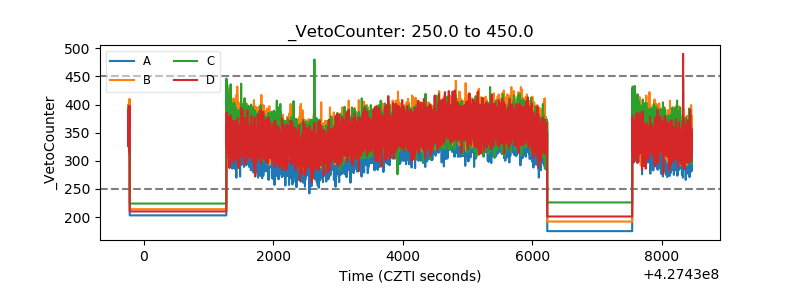 |