| Param | Original file | Final file |
|---|---|---|
| Filename | modeM0/AS1A12_089T01_9000005776_42205cztM0_level2.fits | modeM0/AS1A12_089T01_9000005776_42205cztM0_level2_quad_clean.evt |
| Size (bytes) | 370,771,200 | 94,656,960 |
| Size | 353.6 MB | 90.3 MB |
| Events in quadrant A | 3,198,225 | 639,226 |
| Events in quadrant B | 3,534,733 | 628,828 |
| Events in quadrant C | 2,743,266 | 621,768 |
| Events in quadrant D | 3,780,743 | 557,146 |
| Mode SS | |||
|---|---|---|---|
| Quadrant | BADHDUFLAG | Total packets | Discarded packets |
| A | 0 | 120 | 0 |
| B | 0 | 120 | 0 |
| C | 0 | 120 | 0 |
| D | 0 | 120 | 0 |
| Mode M0 | |||
|---|---|---|---|
| Quadrant | BADHDUFLAG | Total packets | Discarded packets |
| A | 0 | 12927 | 2 |
| B | 0 | 14675 | 2 |
| C | 0 | 12044 | 2 |
| D | 0 | 15480 | 3 |
| Mode M9 | |||
|---|---|---|---|
| Quadrant | BADHDUFLAG | Total packets | Discarded packets |
| A | 0 | 21 | 0 |
| B | 0 | 22 | 0 |
| C | 0 | 22 | 0 |
| D | 0 | 22 | 0 |
| Quadrant | Total seconds | Saturated seconds | Saturation percentage |
|---|---|---|---|
| A | 6005 | 14 | 0.233139% |
| B | 6005 | 331 | 5.512073% |
| C | 6005 | 2 | 0.033306% |
| D | 6004 | 210 | 3.497668% |
Noise dominated data is calculated using 1-second bins in cleaned event files. If a bin has >2000 counts, and if more than 50% of those come from <1% of pixels, then it is considered to be noise-dominated and hence unusable.
| Quadrant | # 1 sec bins | Bins with >0 counts | Bins with >2000 counts | High rate bins dominated by noise | Noise dominated (total time) | Noise dominated (detector-on time) | Marked lightcurve |
|---|---|---|---|---|---|---|---|
| A | 7318 | 6006 | 7 | 7 | 0.10% | 0.12% | 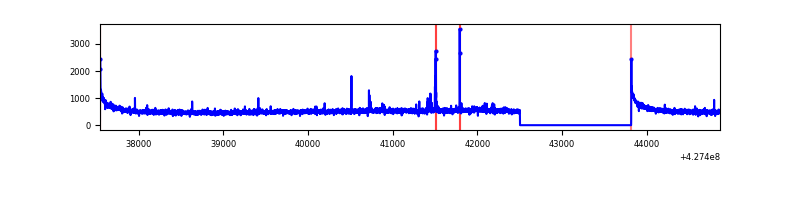 |
| B | 7318 | 6006 | 301 | 301 | 4.11% | 5.01% | 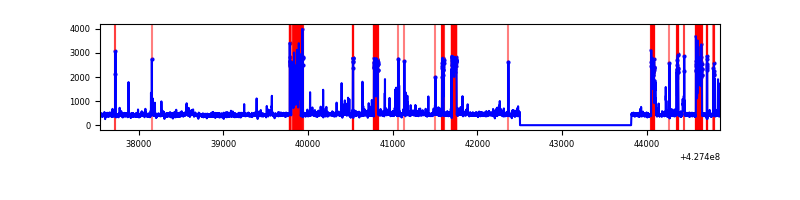 |
| C | 7318 | 6006 | 0 | 0 | 0.00% | 0.00% | 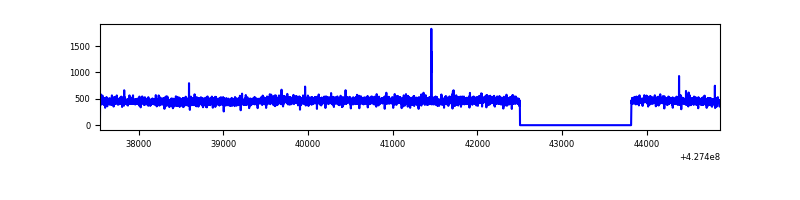 |
| D | 7317 | 6005 | 181 | 181 | 2.47% | 3.01% | 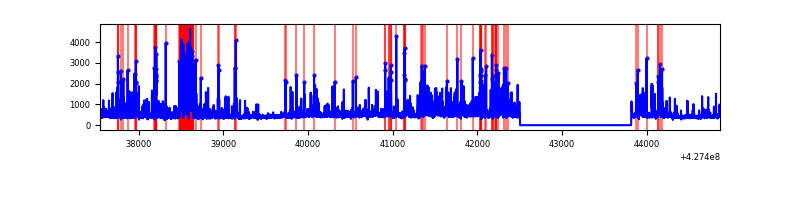 |
Top three noisy pixels from each quadrant. If the there are fewer than three noisy pixels in the level2.evt file, extra rows are filled as -1
| Pixel properties | Quadrant properties | ||||||
|---|---|---|---|---|---|---|---|
| Quadrant | DetID | PixID | Counts | Sigma | Mean | Median | Sigma |
| A | 10 | 83 | 605131 | 4515.84 | 650 | 638 | 133.9 |
| A | 13 | 248 | 30183 | 220.71 | 650 | 638 | 133.9 |
| A | 13 | 6 | 24879 | 181.09 | 650 | 638 | 133.9 |
| B | 7 | 202 | 841307 | 6826.54 | 634 | 616 | 123.2 |
| B | 0 | 229 | 69017 | 555.43 | 634 | 616 | 123.2 |
| B | 3 | 112 | 66632 | 536.06 | 634 | 616 | 123.2 |
| C | 15 | 214 | 251685 | 1695.78 | 635 | 639 | 148.0 |
| C | 7 | 220 | 6597 | 40.25 | 635 | 639 | 148.0 |
| C | 15 | 159 | 5455 | 32.53 | 635 | 639 | 148.0 |
| D | 1 | 52 | 1001053 | 6531.92 | 621 | 601 | 153.2 |
| D | 12 | 6 | 115373 | 749.34 | 621 | 601 | 153.2 |
| D | 2 | 249 | 84222 | 545.96 | 621 | 601 | 153.2 |
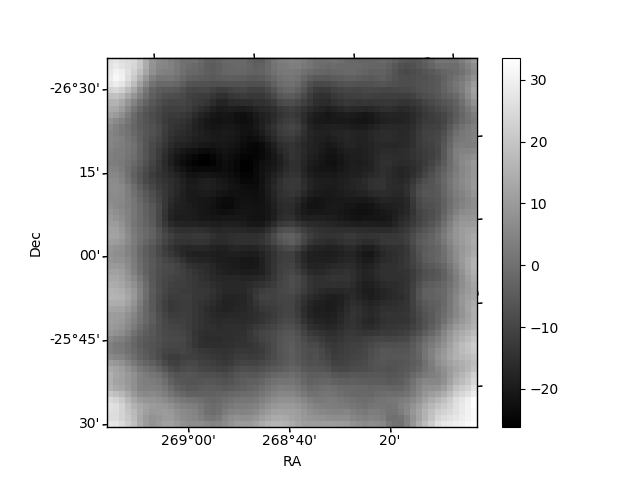
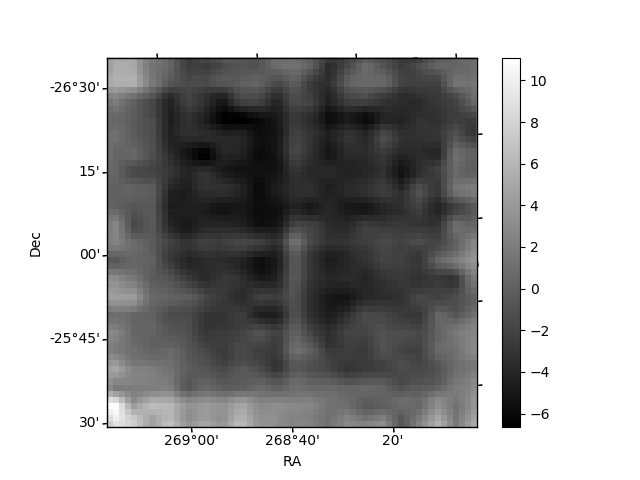
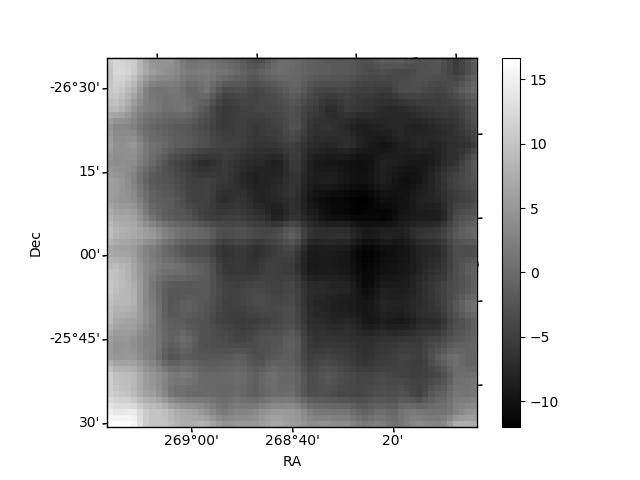
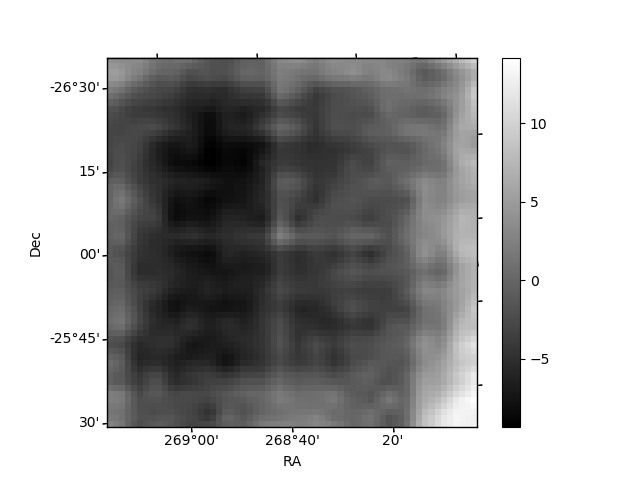
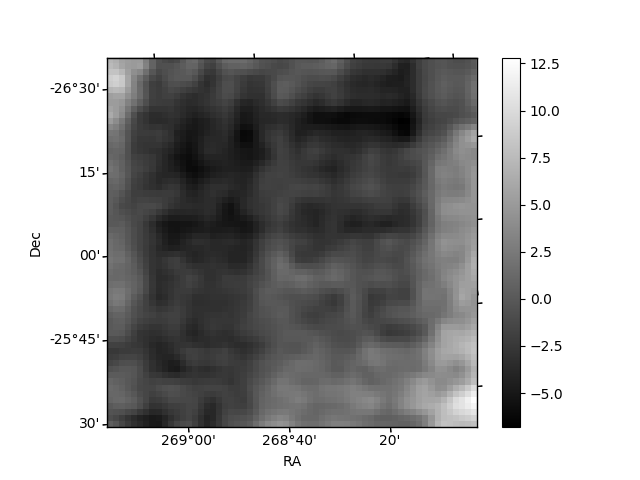
Histogram calculated using DETX and DETY for each event in the final _common_clean file
| Quadrant A | 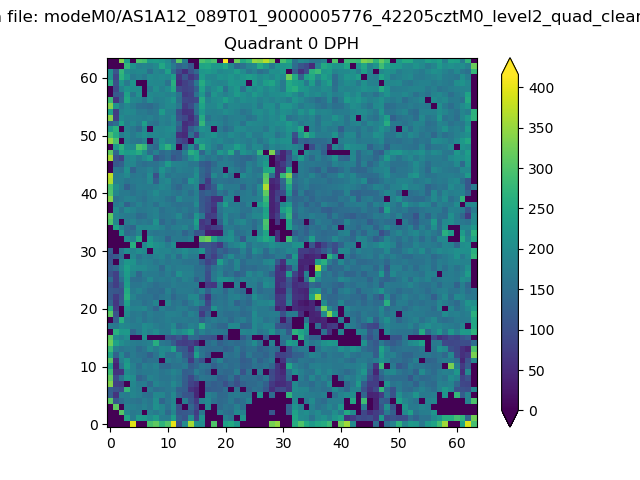 |
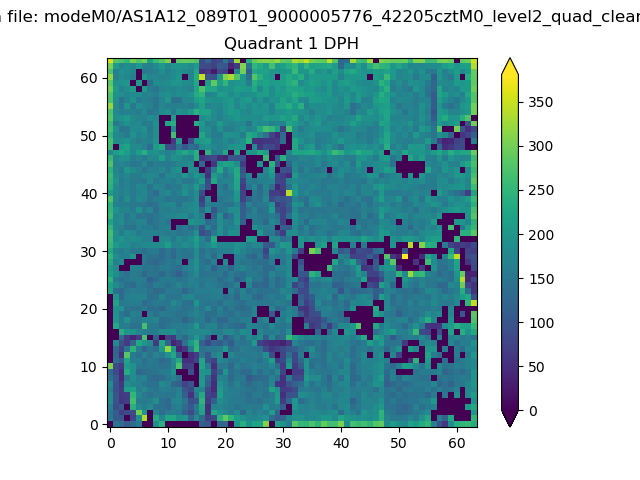 |
Quadrant B |
|---|---|---|---|
| Quadrant D | 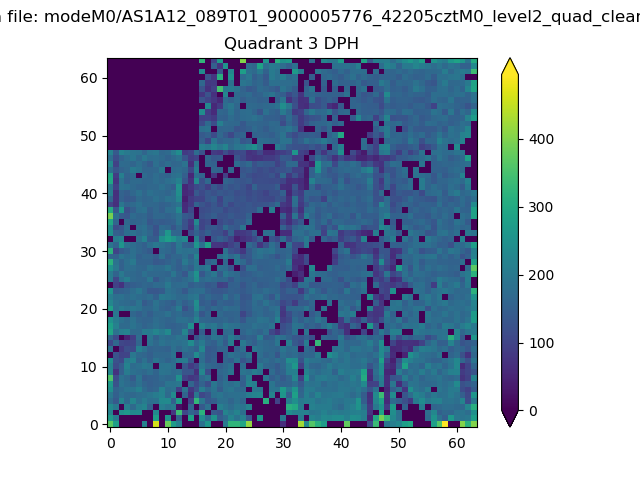 |
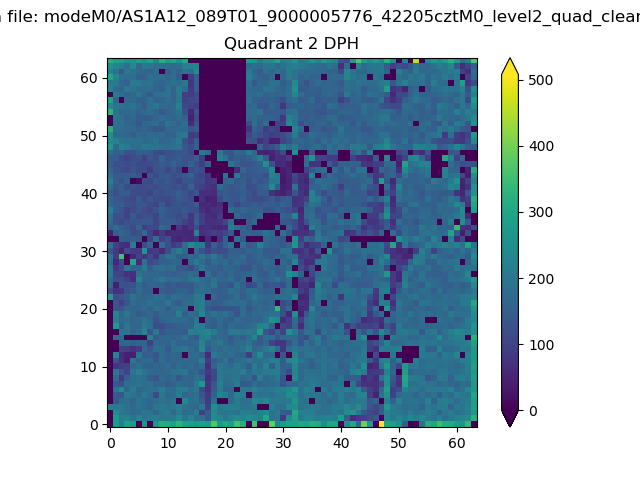 |
Quadrant C |
| Plot type | Count rate plots | Images |
|---|---|---|
| Comparison with Poisson distribution Blue bars denote a histogram of data divided into 1 sec bins. Red curve is a Poisson curve with rate = median count rate of data. |
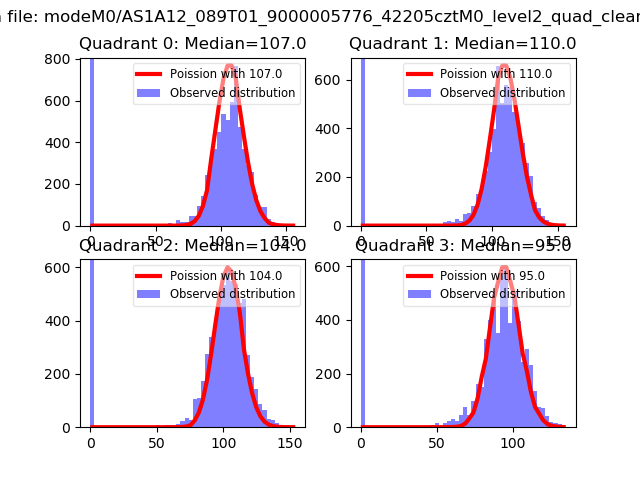 |
 |
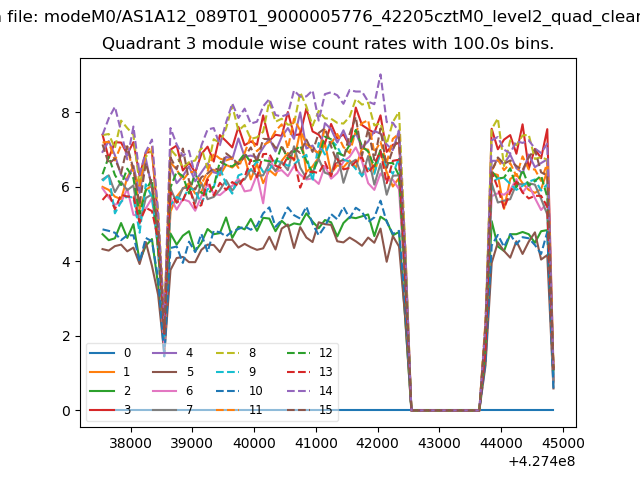
| Quadrant-wise count rates Data is divided into 100 sec bins |
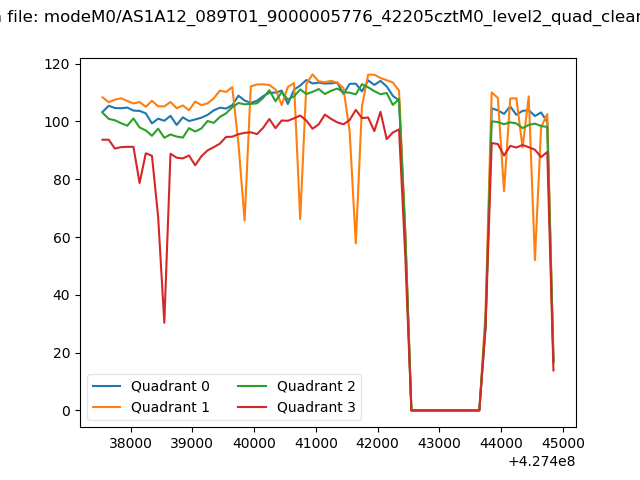 |
|
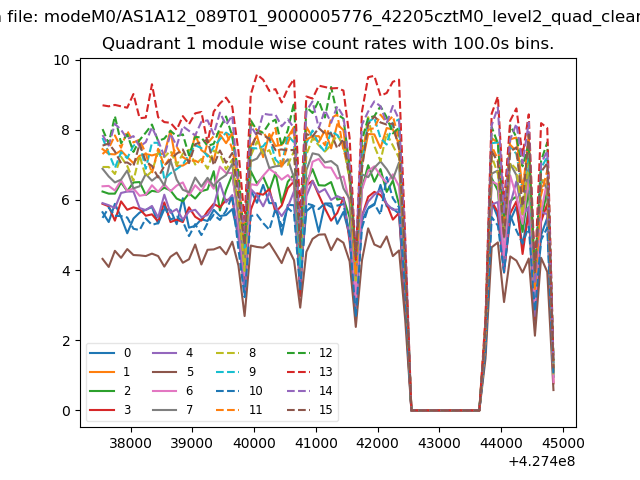
| Module-wise count rates for Quadrant A Data is divided into 100 sec bins |
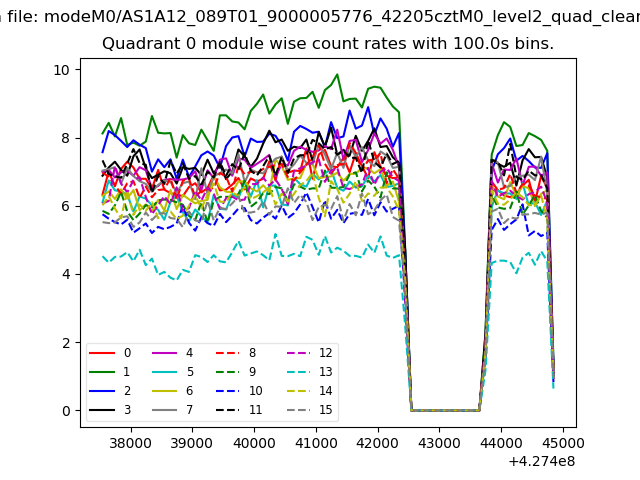 |
 |
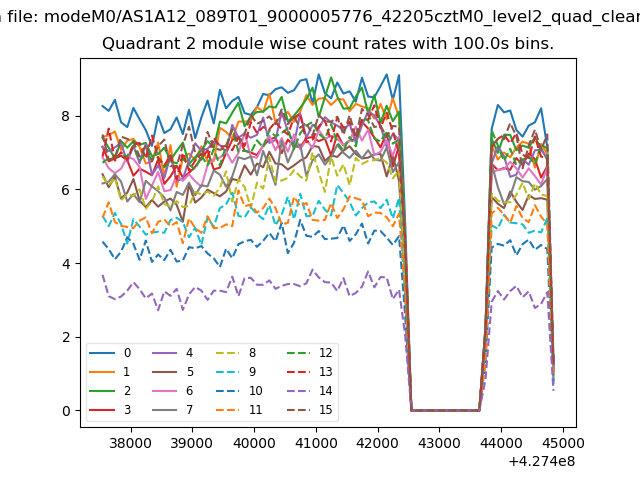
| Module-wise count rates for Quadrant B Data is divided into 100 sec bins |
 |
 |
| Module-wise count rates for Quadrant C Data is divided into 100 sec bins |
 |
 |
| Module-wise count rates for Quadrant D Data is divided into 100 sec bins |
 |
 |
| Parameter | Plot |
|---|---|
| CZT HV Monitor | 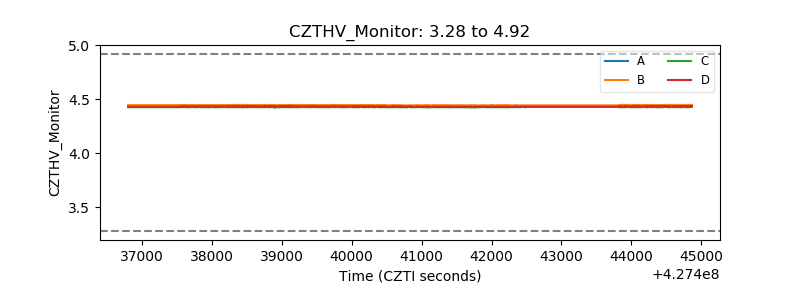 |
| D_VDD |  |
| Temperature 1 | 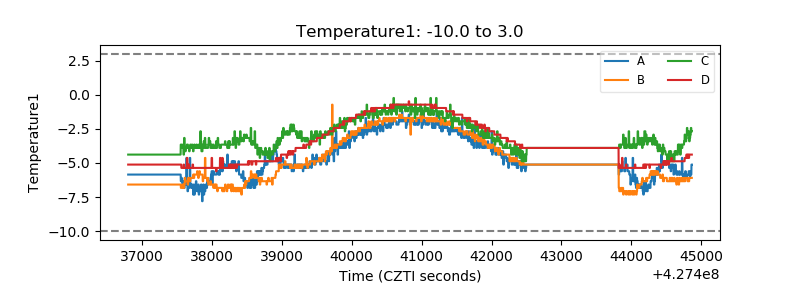 |
| Veto HV Monitor |  |
| Veto LLD | 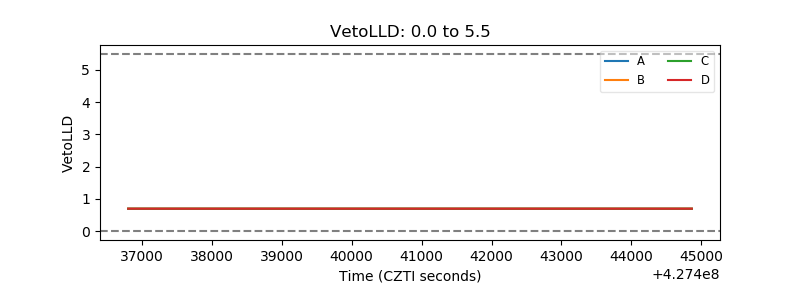 |
| Alpha Counter | 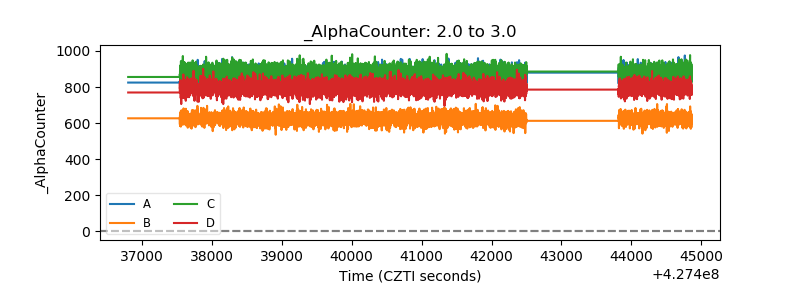 |
| _CPM_Rate | 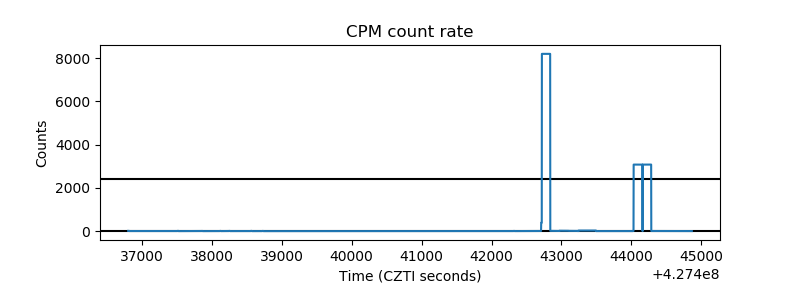 |
| CZT Counter | 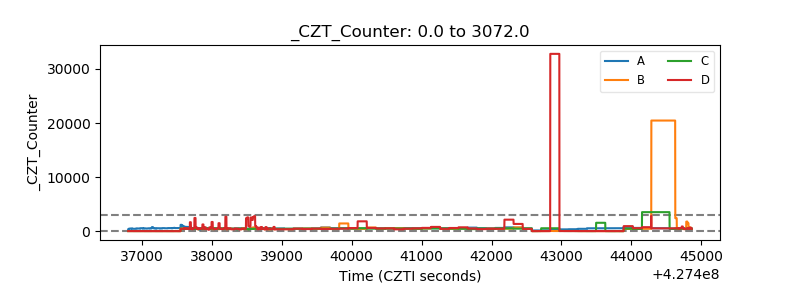 |
| +2.5 Volts monitor | 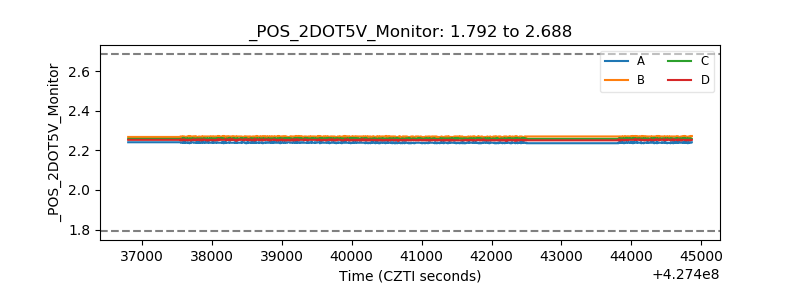 |
| +5 Volts monitor | 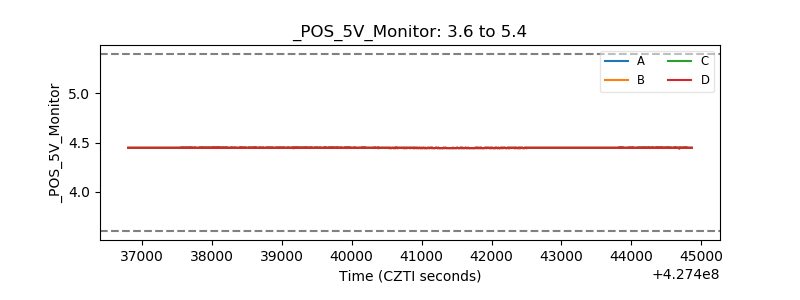 |
| _ROLL_ROT | 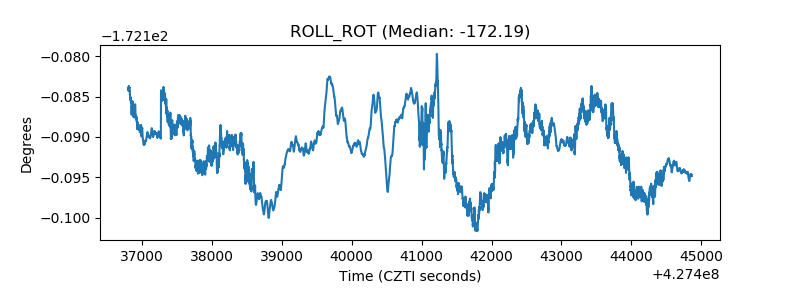 |
| _Roll_DEC | 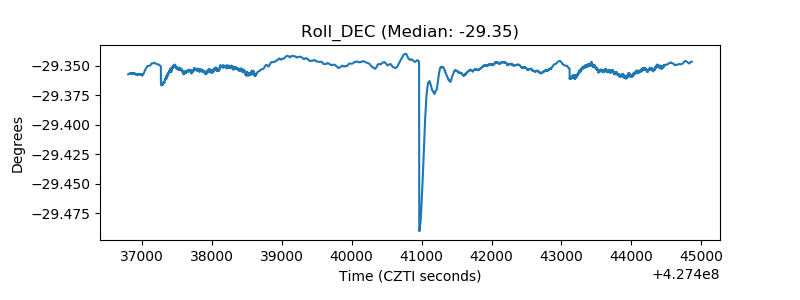 |
| _Roll_RA | 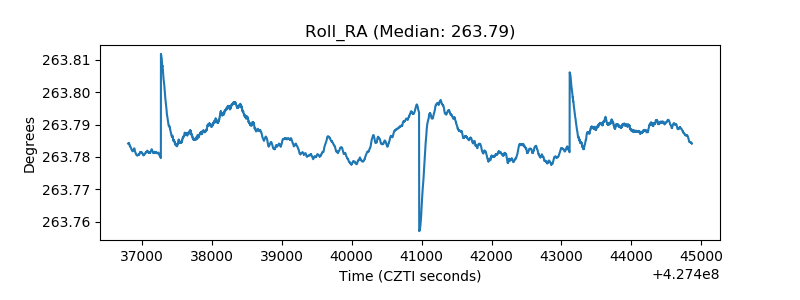 |
| Veto Counter | 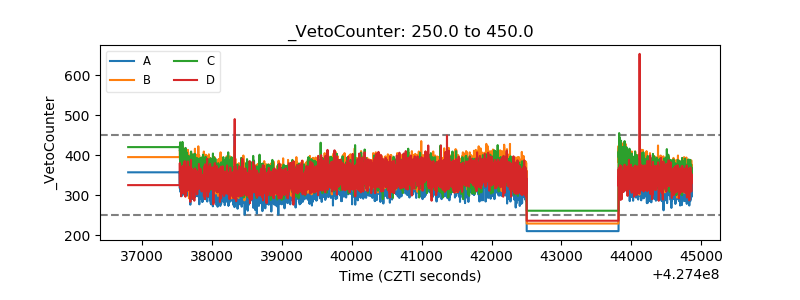 |