| Param | Original file | Final file |
|---|---|---|
| Filename | modeM0/AS1A12_089T01_9000005776_42207cztM0_level2.fits | modeM0/AS1A12_089T01_9000005776_42207cztM0_level2_quad_clean.evt |
| Size (bytes) | 571,340,160 | 139,832,640 |
| Size | 544.9 MB | 133.4 MB |
| Events in quadrant A | 5,083,185 | 933,425 |
| Events in quadrant B | 5,061,532 | 930,557 |
| Events in quadrant C | 4,024,944 | 928,209 |
| Events in quadrant D | 6,294,497 | 829,173 |
| Mode SS | |||
|---|---|---|---|
| Quadrant | BADHDUFLAG | Total packets | Discarded packets |
| A | 0 | 180 | 0 |
| B | 0 | 180 | 0 |
| C | 0 | 180 | 0 |
| D | 0 | 180 | 0 |
| Mode M0 | |||
|---|---|---|---|
| Quadrant | BADHDUFLAG | Total packets | Discarded packets |
| A | 0 | 20125 | 2 |
| B | 0 | 21116 | 2 |
| C | 0 | 17679 | 2 |
| D | 0 | 24742 | 2 |
| Mode M9 | |||
|---|---|---|---|
| Quadrant | BADHDUFLAG | Total packets | Discarded packets |
| A | 0 | 27 | 0 |
| B | 0 | 27 | 0 |
| C | 0 | 27 | 0 |
| D | 0 | 27 | 0 |
| Quadrant | Total seconds | Saturated seconds | Saturation percentage |
|---|---|---|---|
| A | 8826 | 170 | 1.926127% |
| B | 8826 | 449 | 5.087242% |
| C | 8826 | 3 | 0.033990% |
| D | 8826 | 343 | 3.886245% |
Noise dominated data is calculated using 1-second bins in cleaned event files. If a bin has >2000 counts, and if more than 50% of those come from <1% of pixels, then it is considered to be noise-dominated and hence unusable.
| Quadrant | # 1 sec bins | Bins with >0 counts | Bins with >2000 counts | High rate bins dominated by noise | Noise dominated (total time) | Noise dominated (detector-on time) | Marked lightcurve |
|---|---|---|---|---|---|---|---|
| A | 11512 | 8828 | 155 | 155 | 1.35% | 1.76% | 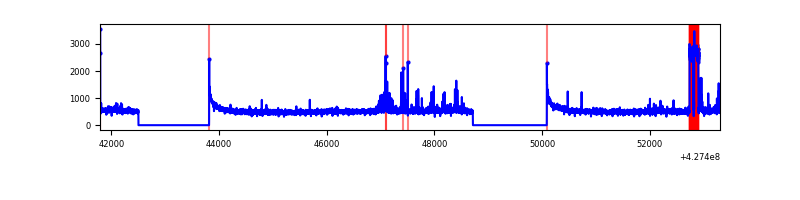 |
| B | 11512 | 8828 | 390 | 390 | 3.39% | 4.42% | 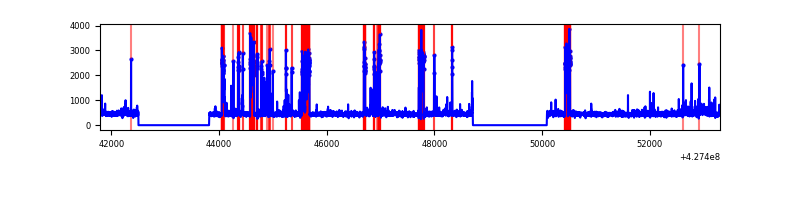 |
| C | 11512 | 8828 | 0 | 0 | 0.00% | 0.00% | 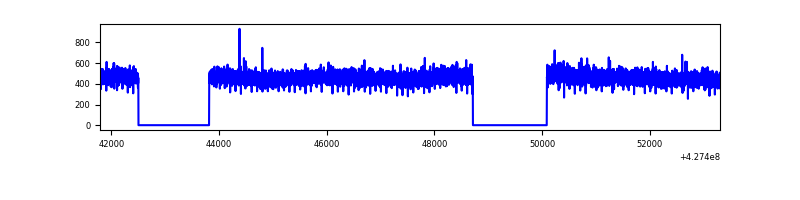 |
| D | 11512 | 8828 | 299 | 299 | 2.60% | 3.39% | 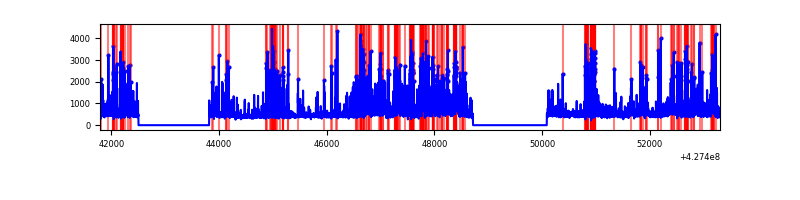 |
Top three noisy pixels from each quadrant. If the there are fewer than three noisy pixels in the level2.evt file, extra rows are filled as -1
| Pixel properties | Quadrant properties | ||||||
|---|---|---|---|---|---|---|---|
| Quadrant | DetID | PixID | Counts | Sigma | Mean | Median | Sigma |
| A | 10 | 83 | 794209 | 4029.74 | 955 | 933 | 196.9 |
| A | 15 | 222 | 374740 | 1898.89 | 955 | 933 | 196.9 |
| A | 13 | 248 | 177402 | 896.44 | 955 | 933 | 196.9 |
| B | 7 | 202 | 988651 | 5393.69 | 940 | 914 | 183.1 |
| B | 3 | 112 | 176097 | 956.61 | 940 | 914 | 183.1 |
| B | 0 | 229 | 121482 | 658.38 | 940 | 914 | 183.1 |
| C | 15 | 214 | 363722 | 1650.39 | 938 | 944 | 219.8 |
| C | 13 | 61 | 6257 | 24.17 | 938 | 944 | 219.8 |
| C | 15 | 159 | 3891 | 13.41 | 938 | 944 | 219.8 |
| D | 1 | 52 | 1515368 | 6694.78 | 924 | 897 | 226.2 |
| D | 2 | 249 | 324511 | 1430.55 | 924 | 897 | 226.2 |
| D | 12 | 6 | 282058 | 1242.88 | 924 | 897 | 226.2 |
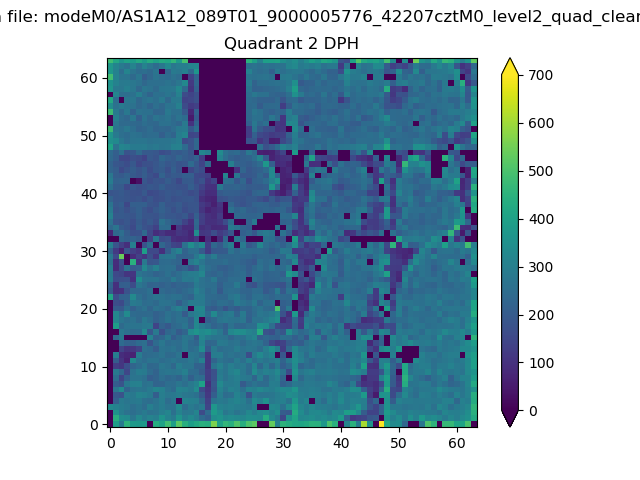
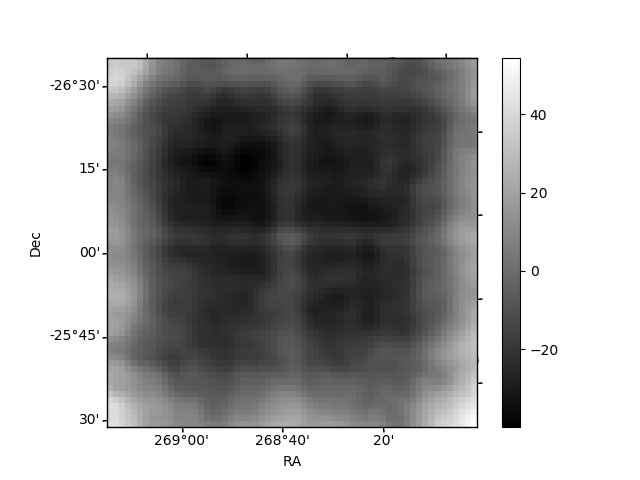
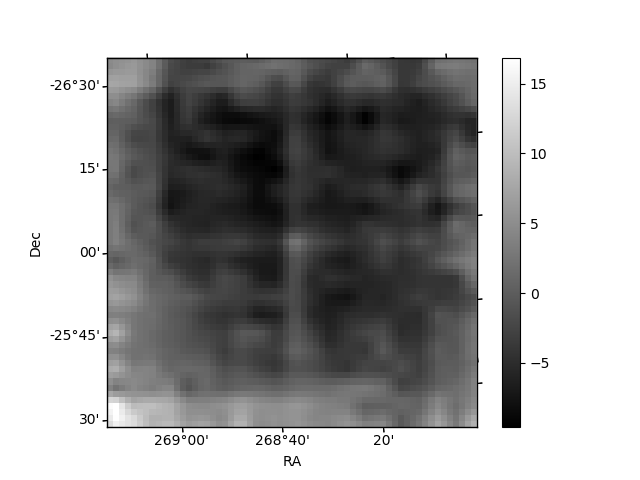
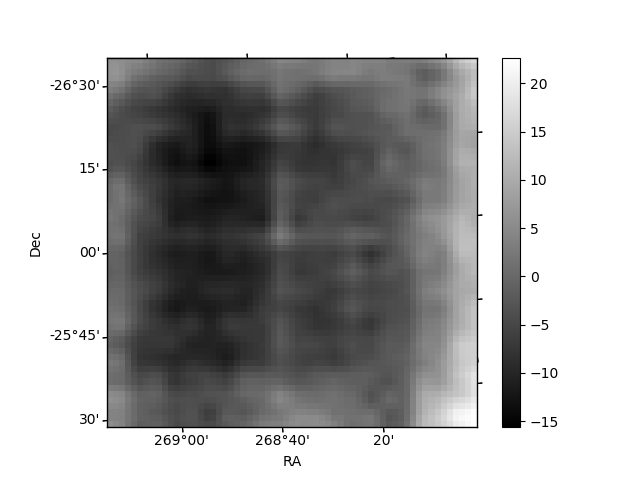
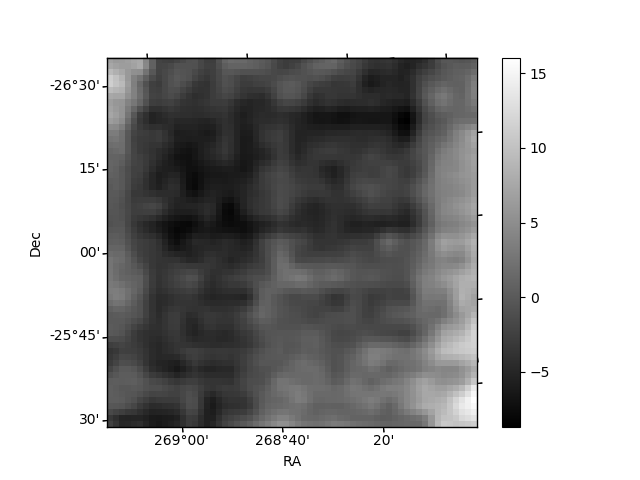
Histogram calculated using DETX and DETY for each event in the final _common_clean file
| Quadrant A | 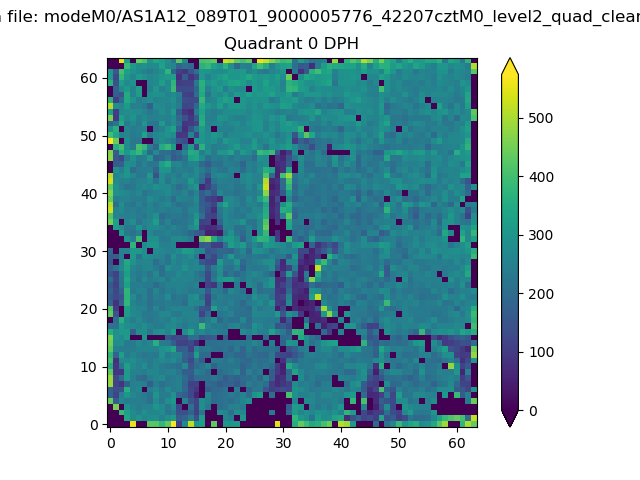 |
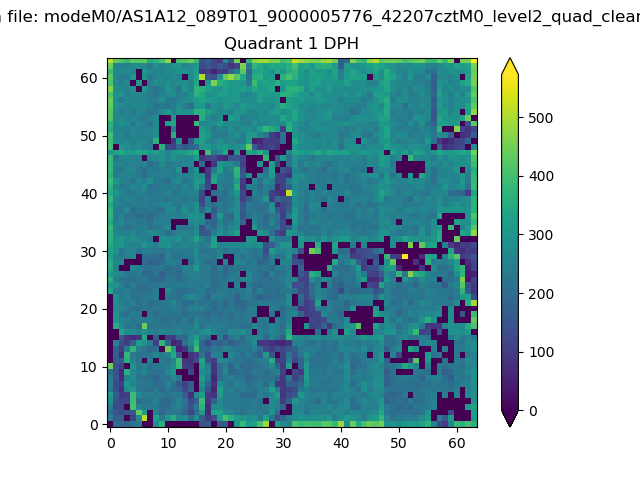 |
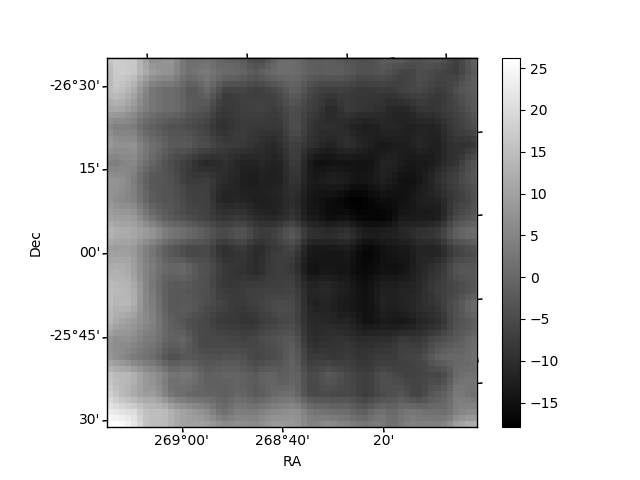
Quadrant B |
|---|---|---|---|
| Quadrant D | 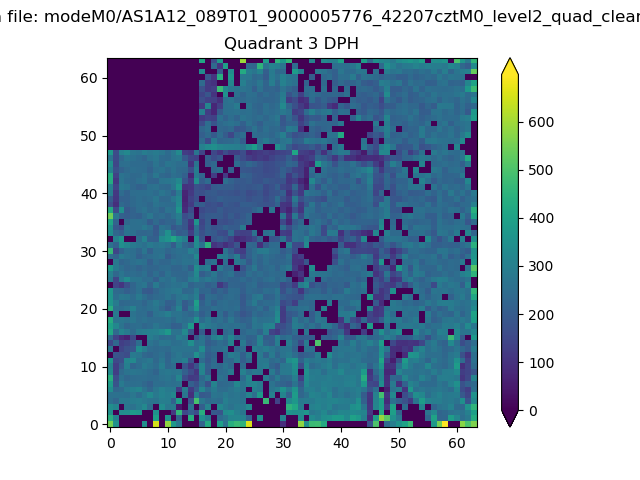 |
 |
Quadrant C |
| Plot type | Count rate plots | Images |
|---|---|---|
| Comparison with Poisson distribution Blue bars denote a histogram of data divided into 1 sec bins. Red curve is a Poisson curve with rate = median count rate of data. |
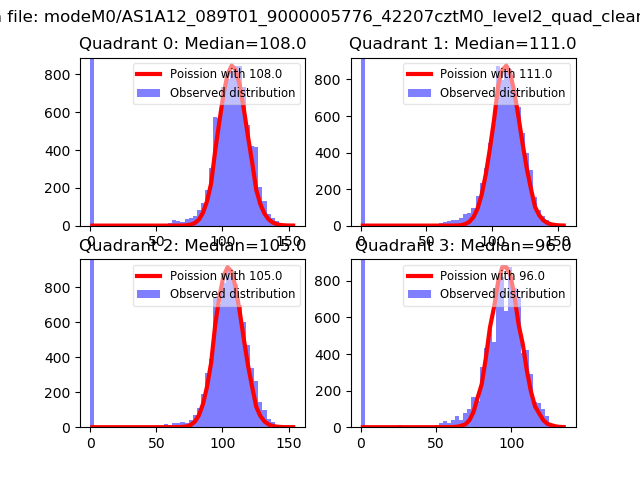 |
 |
| Quadrant-wise count rates Data is divided into 100 sec bins |
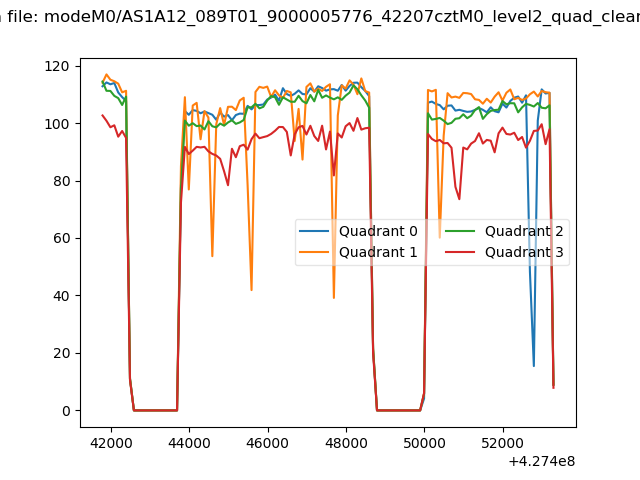 |
|
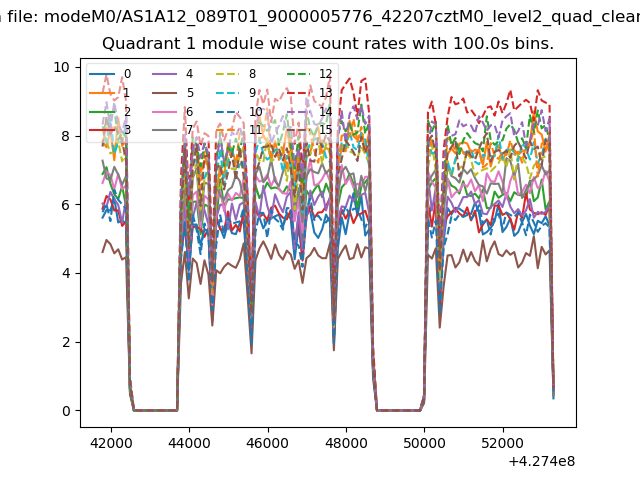
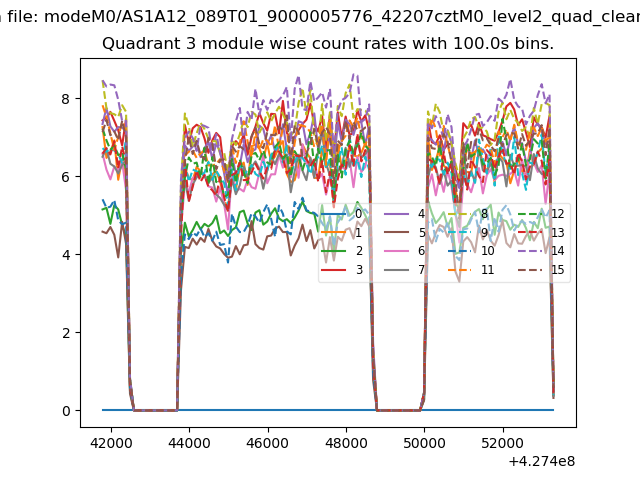
| Module-wise count rates for Quadrant A Data is divided into 100 sec bins |
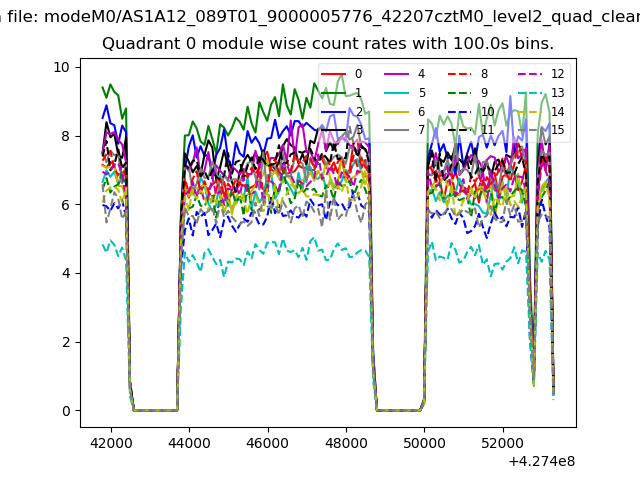 |
 |
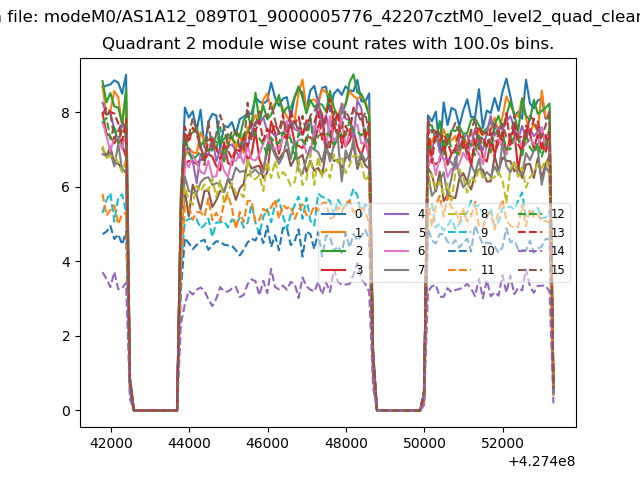
| Module-wise count rates for Quadrant B Data is divided into 100 sec bins |
 |
 |
| Module-wise count rates for Quadrant C Data is divided into 100 sec bins |
 |
 |
| Module-wise count rates for Quadrant D Data is divided into 100 sec bins |
 |
 |
| Parameter | Plot |
|---|---|
| CZT HV Monitor |  |
| D_VDD | 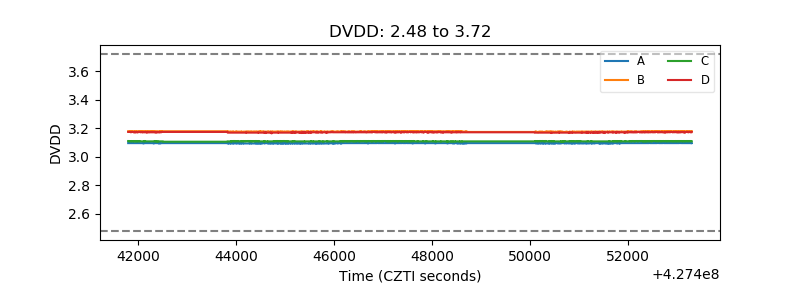 |
| Temperature 1 | 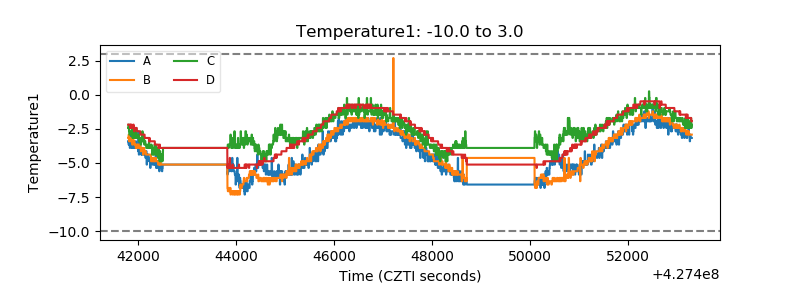 |
| Veto HV Monitor | 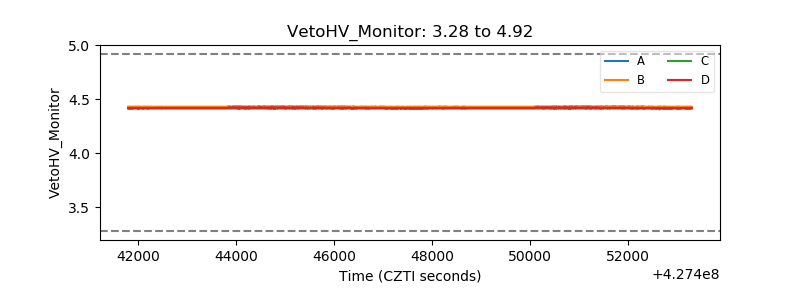 |
| Veto LLD | 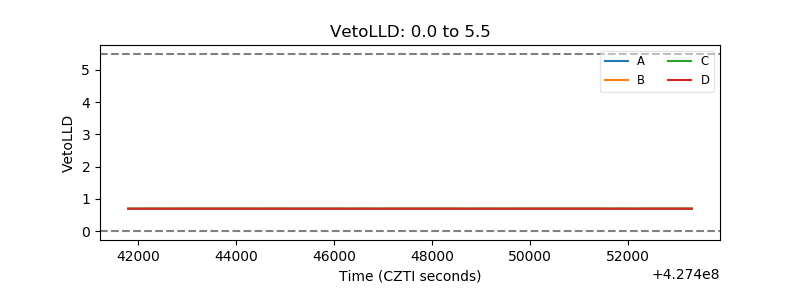 |
| Alpha Counter | 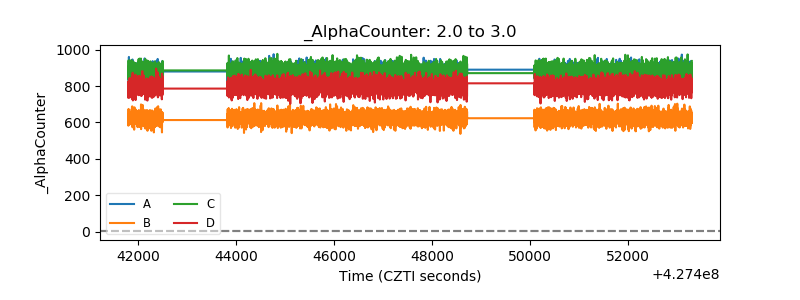 |
| _CPM_Rate | 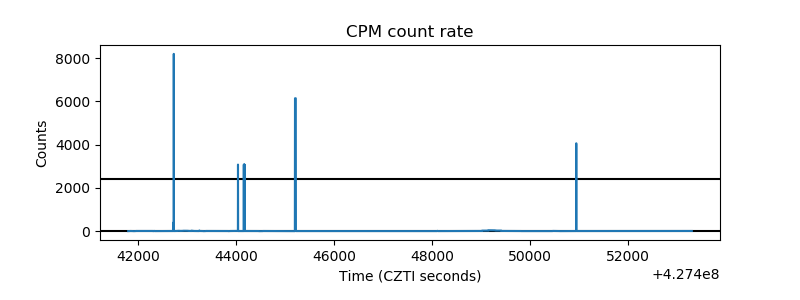 |
| CZT Counter | 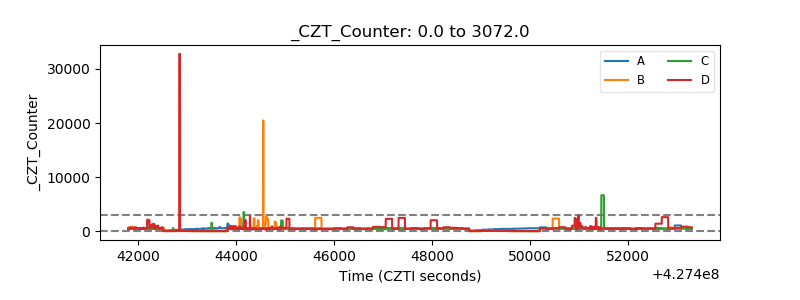 |
| +2.5 Volts monitor | 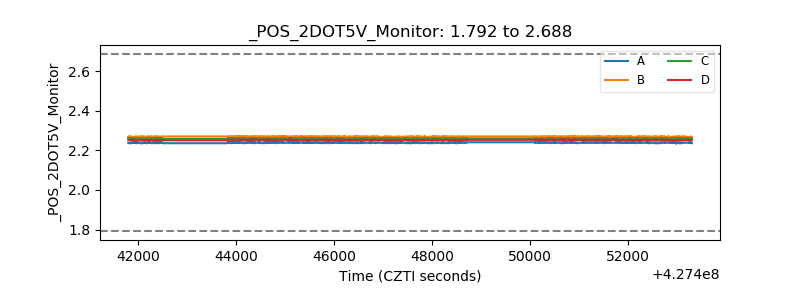 |
| +5 Volts monitor | 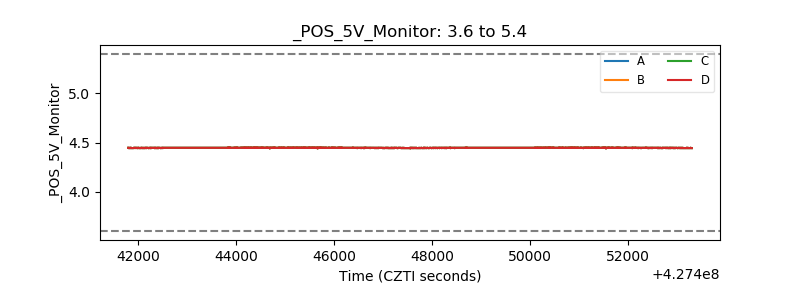 |
| _ROLL_ROT | 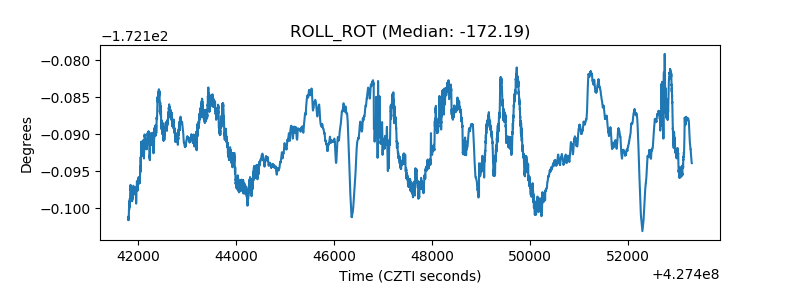 |
| _Roll_DEC | 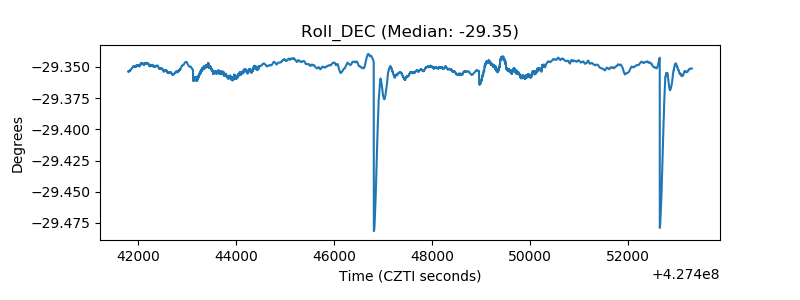 |
| _Roll_RA | 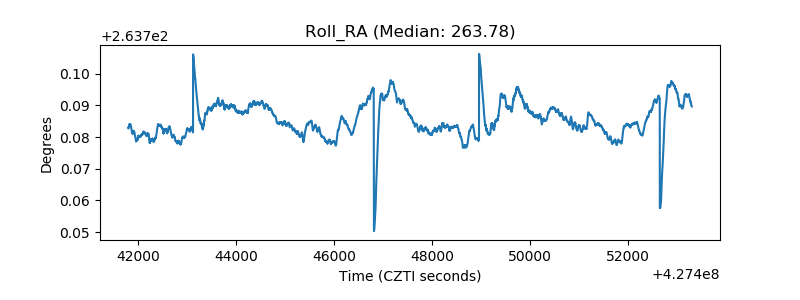 |
| Veto Counter | 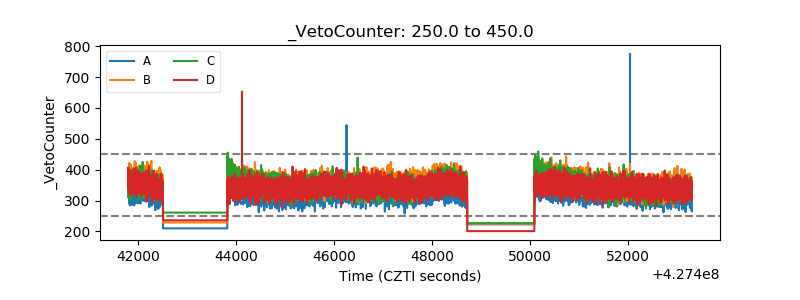 |