| Param | Original file | Final file |
|---|---|---|
| Filename | modeM0/AS1A12_088T51_9000005780_42213cztM0_level2.fits | modeM0/AS1A12_088T51_9000005780_42213cztM0_level2_quad_clean.evt |
| Size (bytes) | 341,856,000 | 93,692,160 |
| Size | 326.0 MB | 89.4 MB |
| Events in quadrant A | 3,353,024 | 646,075 |
| Events in quadrant B | 2,646,969 | 657,923 |
| Events in quadrant C | 2,496,143 | 619,159 |
| Events in quadrant D | 3,755,472 | 551,513 |
| Mode M9 | |||
|---|---|---|---|
| Quadrant | BADHDUFLAG | Total packets | Discarded packets |
| A | 0 | 24 | 0 |
| B | 0 | 25 | 0 |
| C | 0 | 25 | 0 |
| D | 0 | 25 | 0 |
| Mode M0 | |||
|---|---|---|---|
| Quadrant | BADHDUFLAG | Total packets | Discarded packets |
| A | 0 | 13135 | 2 |
| B | 0 | 11248 | 2 |
| C | 0 | 10513 | 2 |
| D | 0 | 14719 | 2 |
| Mode SS | |||
|---|---|---|---|
| Quadrant | BADHDUFLAG | Total packets | Discarded packets |
| A | 0 | 106 | 0 |
| B | 0 | 106 | 0 |
| C | 0 | 106 | 0 |
| D | 0 | 106 | 0 |
| Quadrant | Total seconds | Saturated seconds | Saturation percentage |
|---|---|---|---|
| A | 5173 | 89 | 1.720472% |
| B | 5173 | 53 | 1.024551% |
| C | 5173 | 3 | 0.057993% |
| D | 5173 | 263 | 5.084090% |
Noise dominated data is calculated using 1-second bins in cleaned event files. If a bin has >2000 counts, and if more than 50% of those come from <1% of pixels, then it is considered to be noise-dominated and hence unusable.
| Quadrant | # 1 sec bins | Bins with >0 counts | Bins with >2000 counts | High rate bins dominated by noise | Noise dominated (total time) | Noise dominated (detector-on time) | Marked lightcurve |
|---|---|---|---|---|---|---|---|
| A | 7237 | 5174 | 62 | 62 | 0.86% | 1.20% | 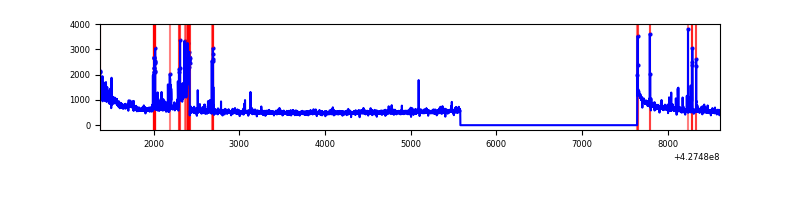 |
| B | 7237 | 5174 | 41 | 41 | 0.57% | 0.79% | 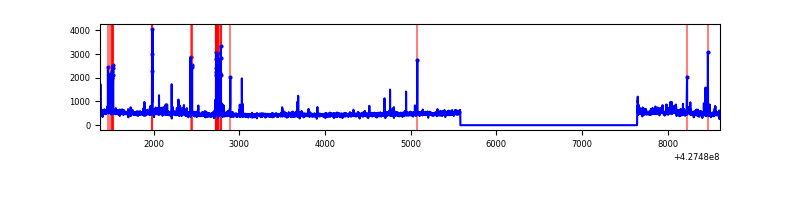 |
| C | 7237 | 5174 | 0 | 0 | 0.00% | 0.00% | 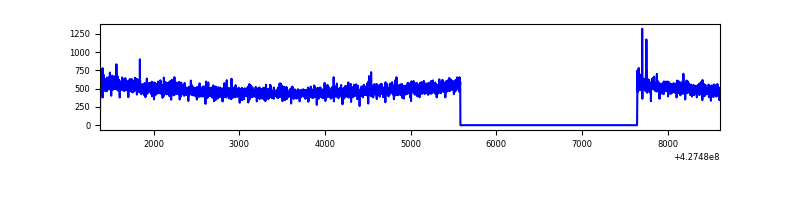 |
| D | 7237 | 5174 | 233 | 233 | 3.22% | 4.50% |  |
Top three noisy pixels from each quadrant. If the there are fewer than three noisy pixels in the level2.evt file, extra rows are filled as -1
| Pixel properties | Quadrant properties | ||||||
|---|---|---|---|---|---|---|---|
| Quadrant | DetID | PixID | Counts | Sigma | Mean | Median | Sigma |
| A | 10 | 83 | 591436 | 4792.69 | 605 | 595 | 123.3 |
| A | 15 | 223 | 313188 | 2535.64 | 605 | 595 | 123.3 |
| A | 15 | 222 | 83607 | 673.36 | 605 | 595 | 123.3 |
| B | 0 | 229 | 170619 | 1472.72 | 601 | 585 | 115.5 |
| B | 3 | 112 | 76089 | 653.97 | 601 | 585 | 115.5 |
| B | 5 | 255 | 17483 | 146.36 | 601 | 585 | 115.5 |
| C | 15 | 214 | 219317 | 1629.42 | 579 | 583 | 134.2 |
| C | 7 | 220 | 8959 | 62.4 | 579 | 583 | 134.2 |
| C | 12 | 249 | 6062 | 40.81 | 579 | 583 | 134.2 |
| D | 1 | 52 | 617347 | 4370.13 | 571 | 555 | 141.1 |
| D | 1 | 47 | 335896 | 2375.98 | 571 | 555 | 141.1 |
| D | 10 | 118 | 246284 | 1741.05 | 571 | 555 | 141.1 |
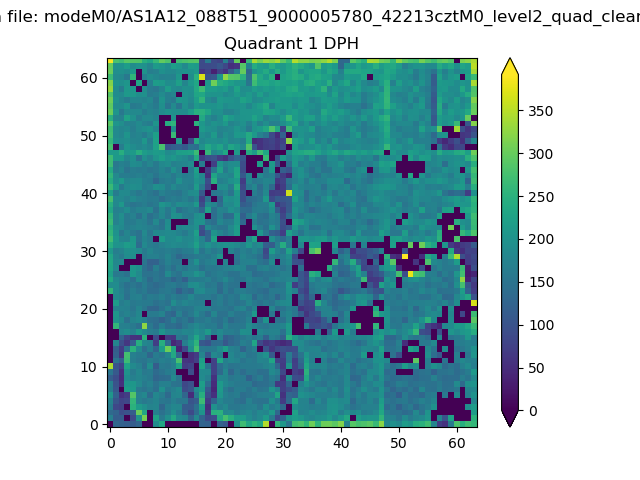
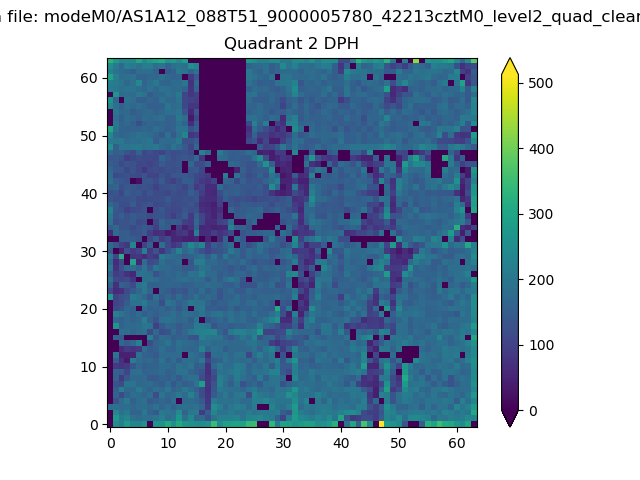
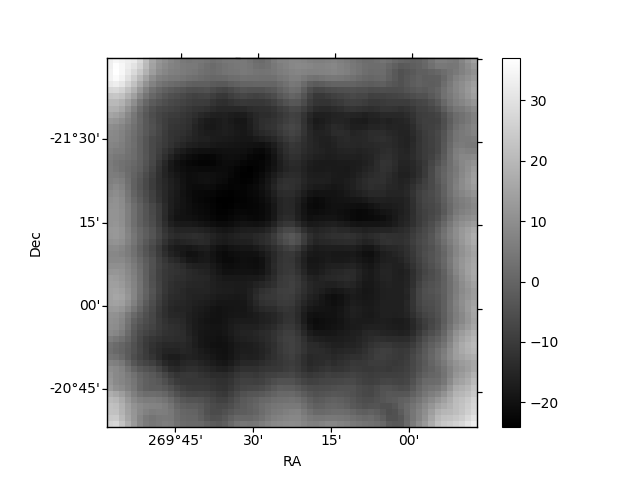
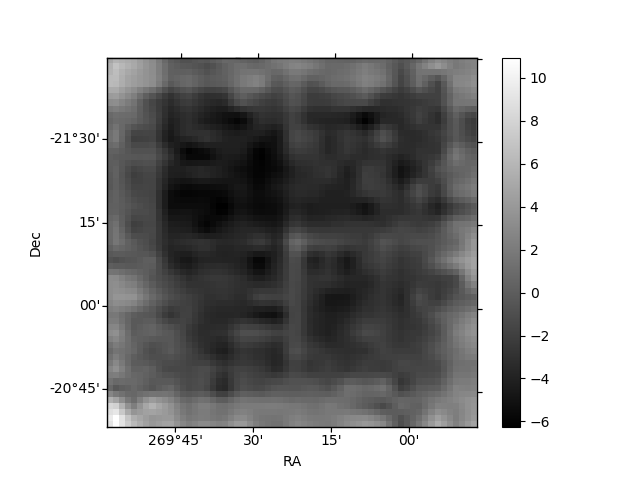
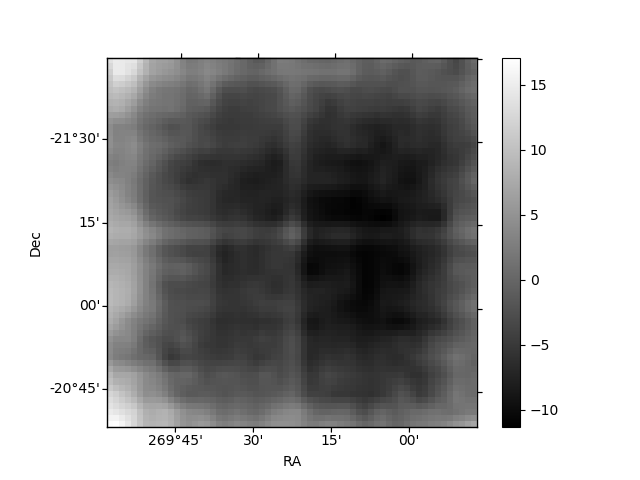
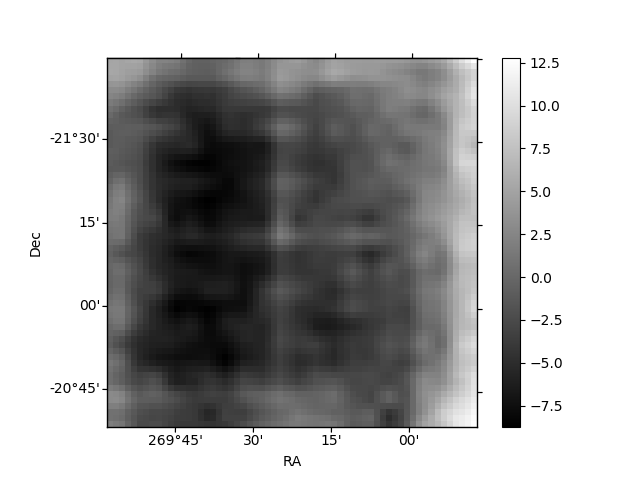
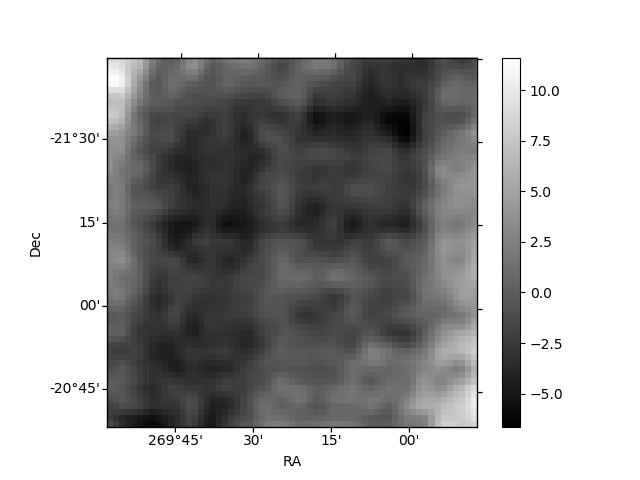
Histogram calculated using DETX and DETY for each event in the final _common_clean file
| Quadrant A | 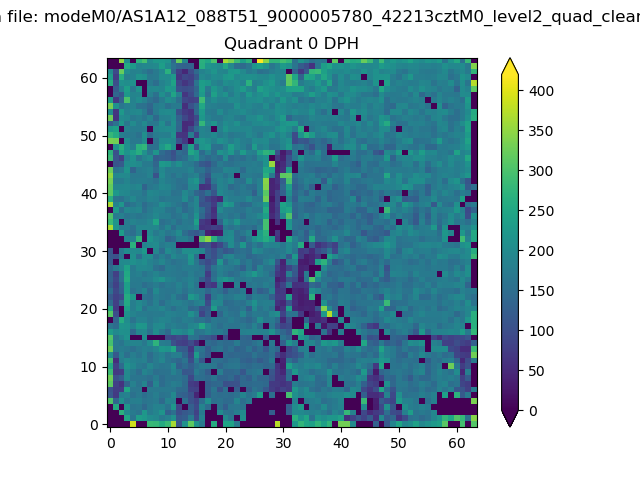 |
 |
Quadrant B |
|---|---|---|---|
| Quadrant D | 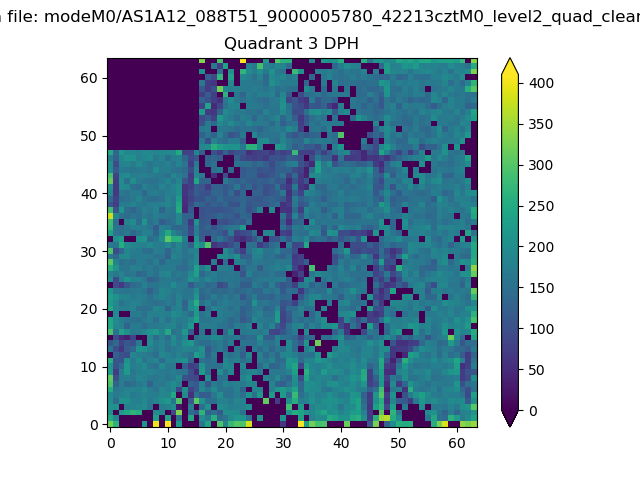 |
 |
Quadrant C |
| Plot type | Count rate plots | Images |
|---|---|---|
| Comparison with Poisson distribution Blue bars denote a histogram of data divided into 1 sec bins. Red curve is a Poisson curve with rate = median count rate of data. |
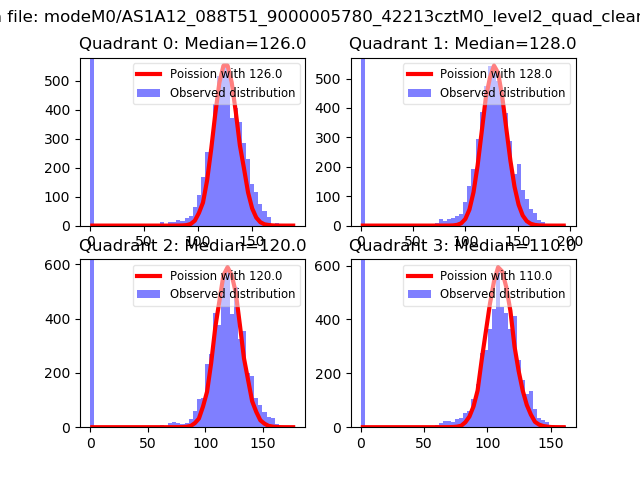 |
 |
| Quadrant-wise count rates Data is divided into 100 sec bins |
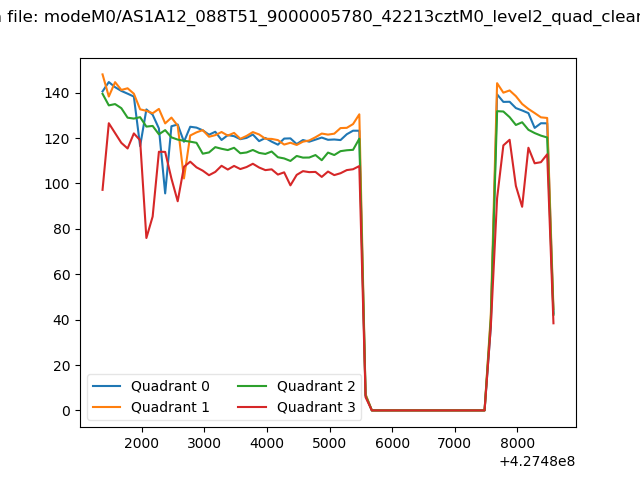 |
|
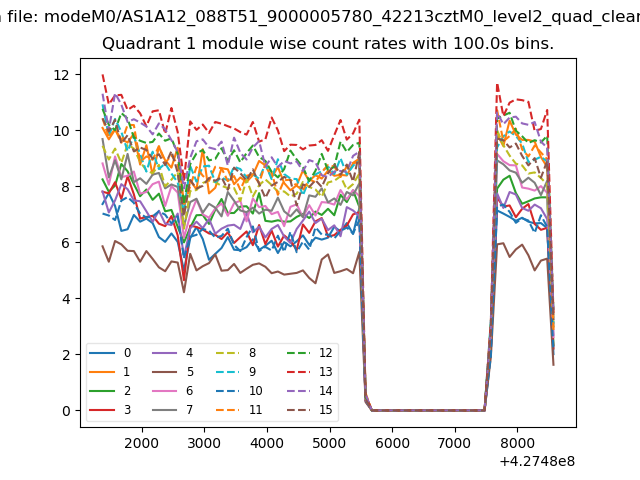
| Module-wise count rates for Quadrant A Data is divided into 100 sec bins |
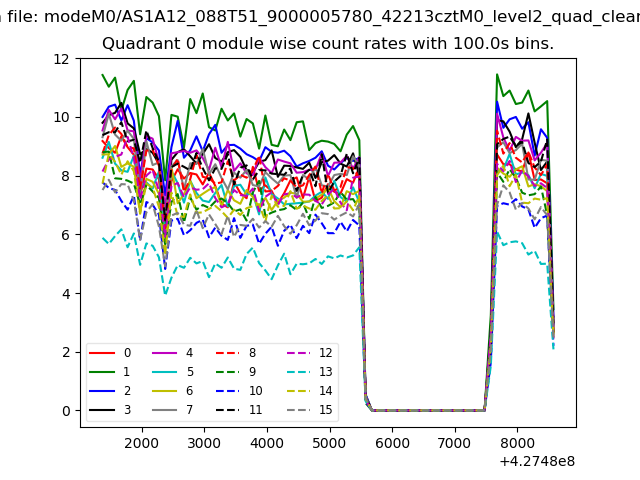 |
 |
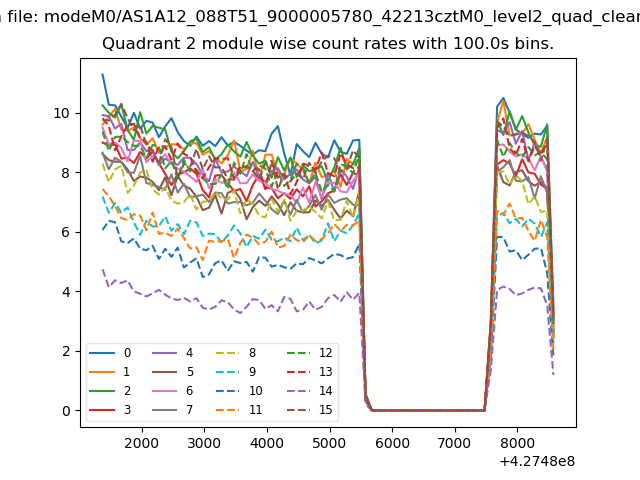
| Module-wise count rates for Quadrant B Data is divided into 100 sec bins |
 |
 |
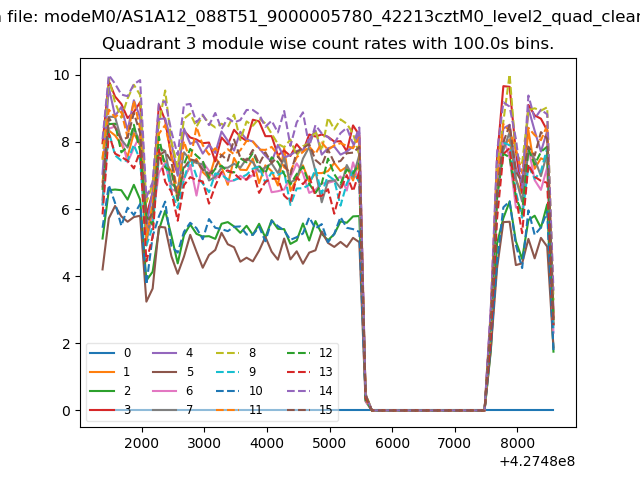
| Module-wise count rates for Quadrant C Data is divided into 100 sec bins |
 |
 |
| Module-wise count rates for Quadrant D Data is divided into 100 sec bins |
 |
 |
| Parameter | Plot |
|---|---|
| CZT HV Monitor |  |
| D_VDD | 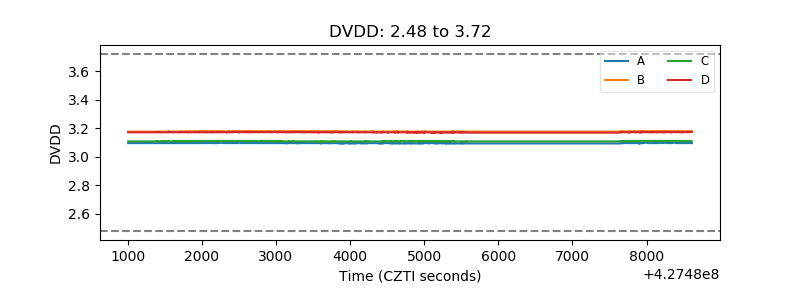 |
| Temperature 1 | 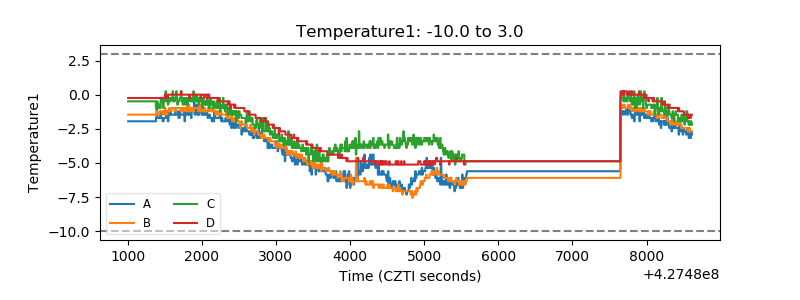 |
| Veto HV Monitor | 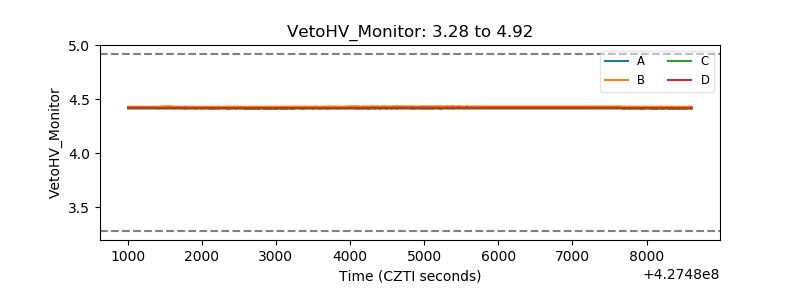 |
| Veto LLD | 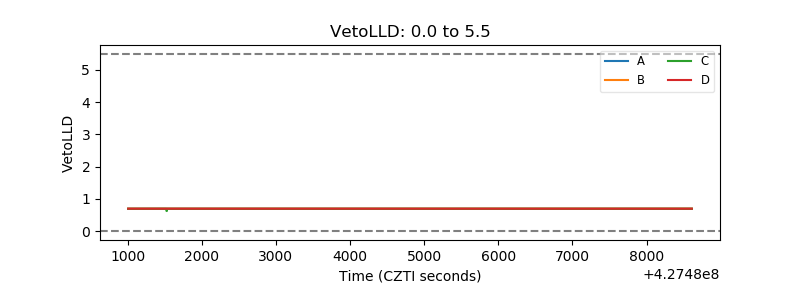 |
| Alpha Counter |  |
| _CPM_Rate |  |
| CZT Counter | 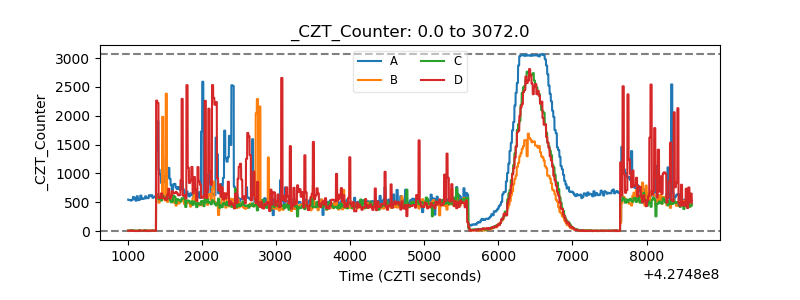 |
| +2.5 Volts monitor | 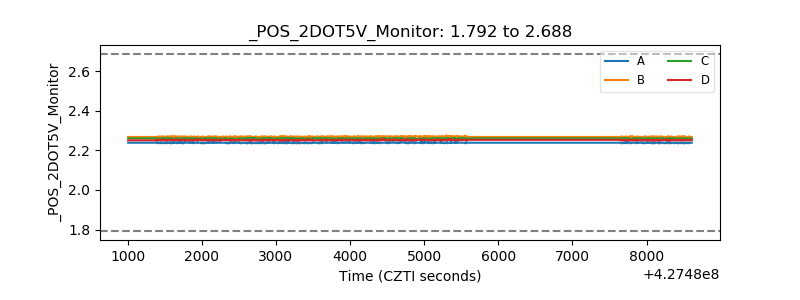 |
| +5 Volts monitor | 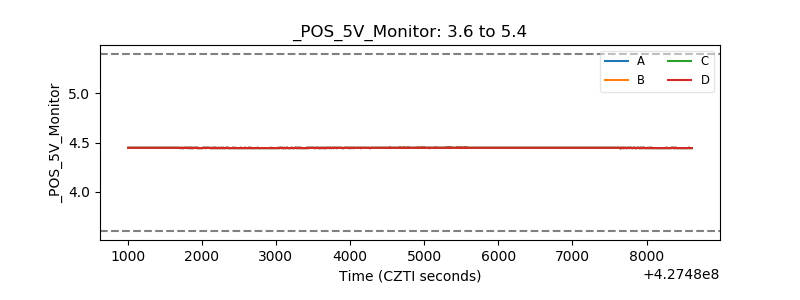 |
| _ROLL_ROT | 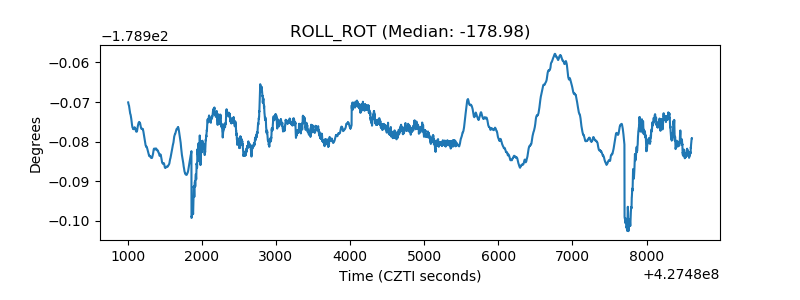 |
| _Roll_DEC | 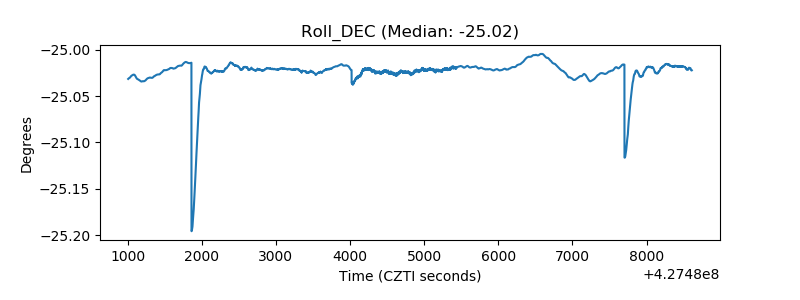 |
| _Roll_RA | 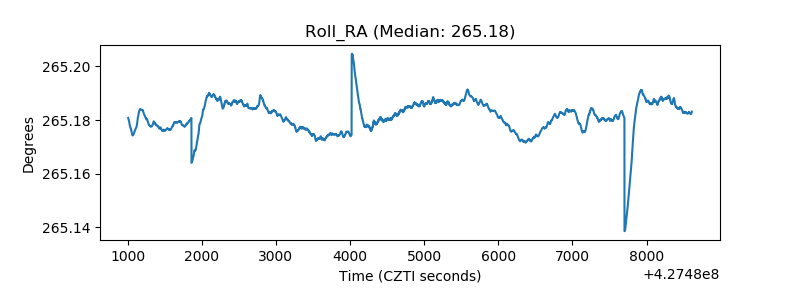 |
| Veto Counter | 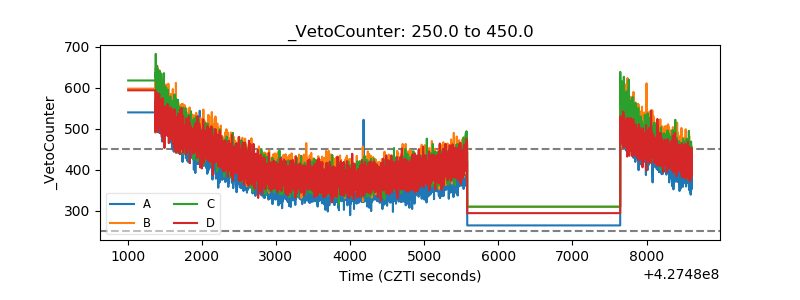 |