| Param | Original file | Final file |
|---|---|---|
| Filename | modeM0/AS1A12_088T51_9000005780_42214cztM0_level2.fits | modeM0/AS1A12_088T51_9000005780_42214cztM0_level2_quad_clean.evt |
| Size (bytes) | 315,731,520 | 89,213,760 |
| Size | 301.1 MB | 85.1 MB |
| Events in quadrant A | 3,132,207 | 604,644 |
| Events in quadrant B | 2,506,833 | 625,917 |
| Events in quadrant C | 2,388,946 | 587,955 |
| Events in quadrant D | 3,266,768 | 530,461 |
| Mode M9 | |||
|---|---|---|---|
| Quadrant | BADHDUFLAG | Total packets | Discarded packets |
| A | 0 | 33 | 0 |
| B | 0 | 34 | 0 |
| C | 0 | 34 | 0 |
| D | 0 | 34 | 0 |
| Mode M0 | |||
|---|---|---|---|
| Quadrant | BADHDUFLAG | Total packets | Discarded packets |
| A | 0 | 12297 | 2 |
| B | 0 | 10864 | 2 |
| C | 0 | 10220 | 2 |
| D | 0 | 13164 | 2 |
| Mode SS | |||
|---|---|---|---|
| Quadrant | BADHDUFLAG | Total packets | Discarded packets |
| A | 0 | 100 | 0 |
| B | 0 | 100 | 0 |
| C | 0 | 100 | 0 |
| D | 0 | 100 | 0 |
| Quadrant | Total seconds | Saturated seconds | Saturation percentage |
|---|---|---|---|
| A | 5038 | 111 | 2.203255% |
| B | 5038 | 23 | 0.456530% |
| C | 5038 | 6 | 0.119095% |
| D | 5038 | 147 | 2.917825% |
Noise dominated data is calculated using 1-second bins in cleaned event files. If a bin has >2000 counts, and if more than 50% of those come from <1% of pixels, then it is considered to be noise-dominated and hence unusable.
| Quadrant | # 1 sec bins | Bins with >0 counts | Bins with >2000 counts | High rate bins dominated by noise | Noise dominated (total time) | Noise dominated (detector-on time) | Marked lightcurve |
|---|---|---|---|---|---|---|---|
| A | 7161 | 5039 | 103 | 103 | 1.44% | 2.04% | 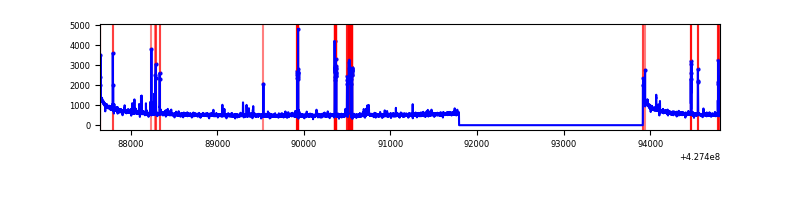 |
| B | 7161 | 5039 | 8 | 8 | 0.11% | 0.16% | 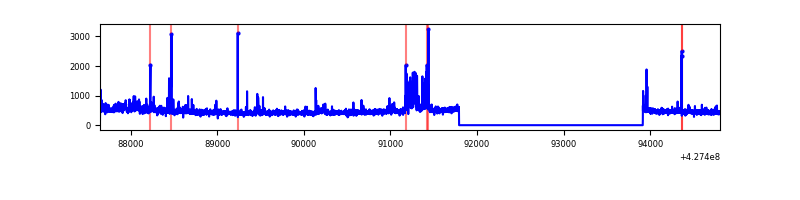 |
| C | 7161 | 5039 | 1 | 1 | 0.01% | 0.02% | 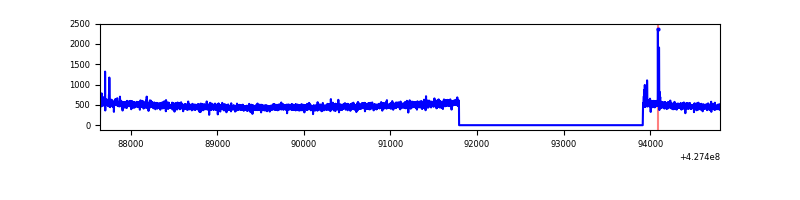 |
| D | 7161 | 5039 | 137 | 137 | 1.91% | 2.72% |  |
Top three noisy pixels from each quadrant. If the there are fewer than three noisy pixels in the level2.evt file, extra rows are filled as -1
| Pixel properties | Quadrant properties | ||||||
|---|---|---|---|---|---|---|---|
| Quadrant | DetID | PixID | Counts | Sigma | Mean | Median | Sigma |
| A | 10 | 83 | 578952 | 4911.42 | 570 | 561 | 117.8 |
| A | 15 | 222 | 304906 | 2584.35 | 570 | 561 | 117.8 |
| A | 13 | 6 | 13060 | 106.14 | 570 | 561 | 117.8 |
| B | 5 | 255 | 137412 | 1235.13 | 573 | 559 | 110.8 |
| B | 0 | 229 | 70574 | 631.9 | 573 | 559 | 110.8 |
| B | 3 | 112 | 36137 | 321.1 | 573 | 559 | 110.8 |
| C | 15 | 214 | 210338 | 1635.35 | 551 | 556 | 128.3 |
| C | 15 | 159 | 16940 | 127.72 | 551 | 556 | 128.3 |
| C | 12 | 249 | 5924 | 41.85 | 551 | 556 | 128.3 |
| D | 1 | 52 | 526006 | 3947.47 | 546 | 533 | 133.1 |
| D | 1 | 47 | 221882 | 1662.82 | 546 | 533 | 133.1 |
| D | 12 | 218 | 89942 | 671.66 | 546 | 533 | 133.1 |
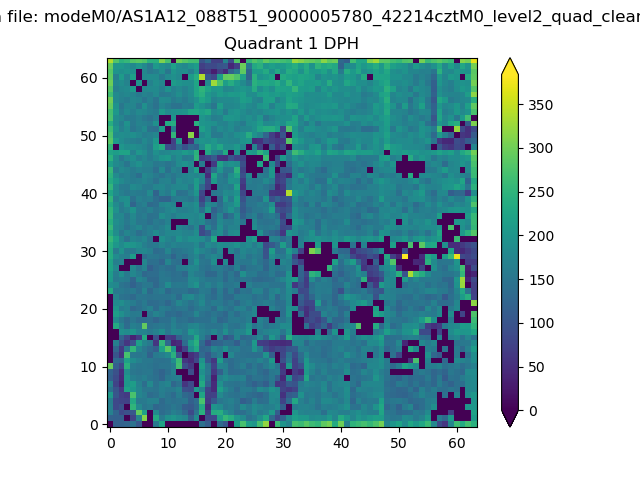
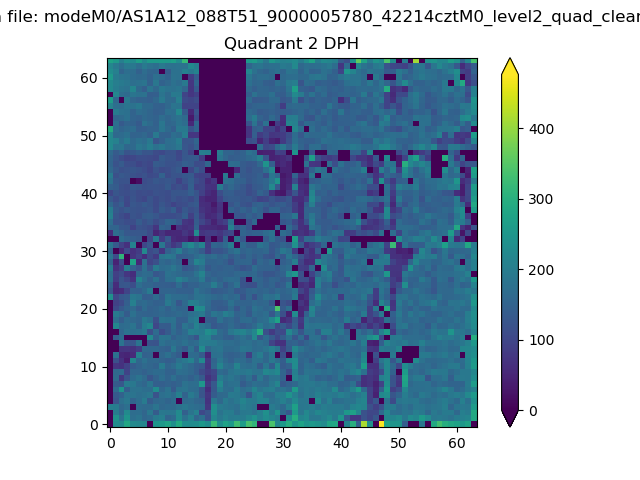
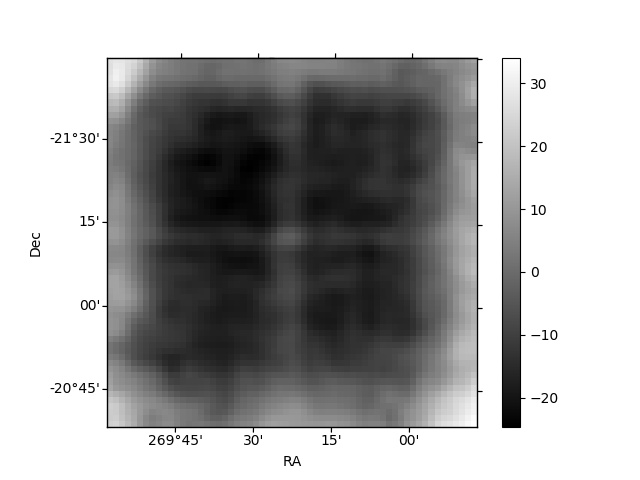
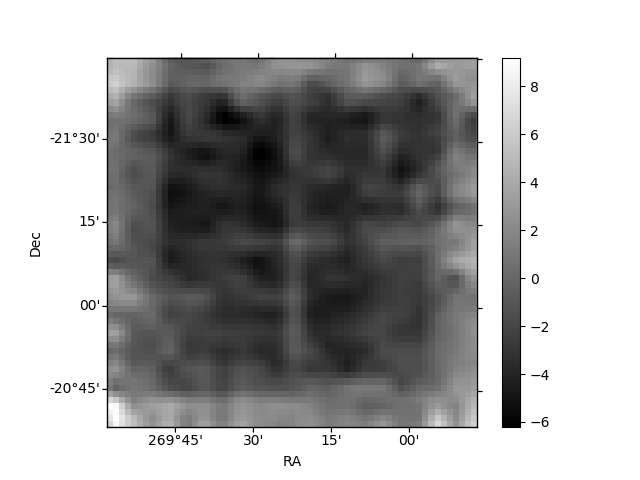
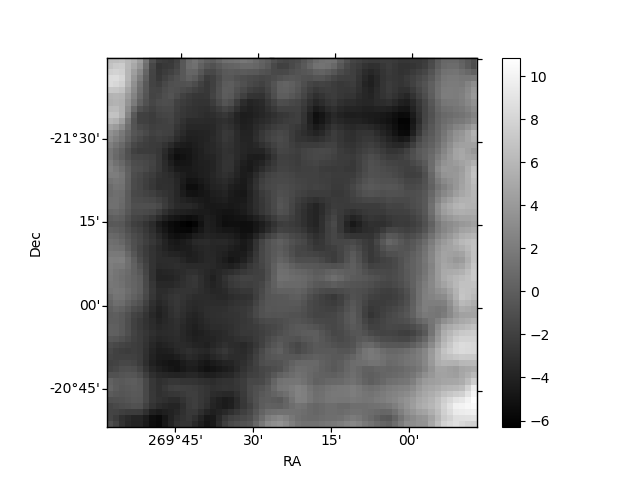
Histogram calculated using DETX and DETY for each event in the final _common_clean file
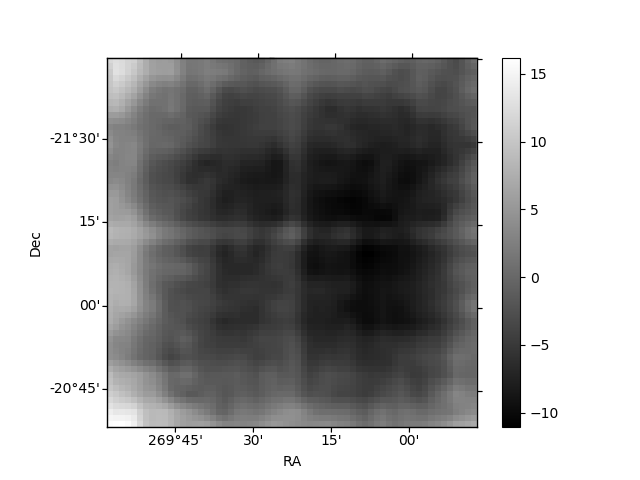
| Quadrant A | 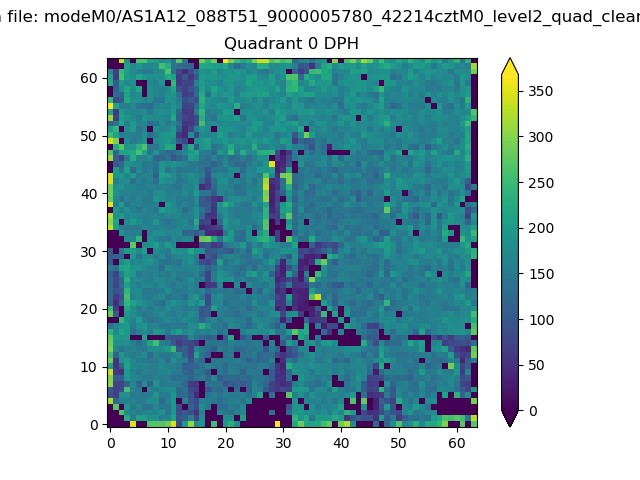 |
 |
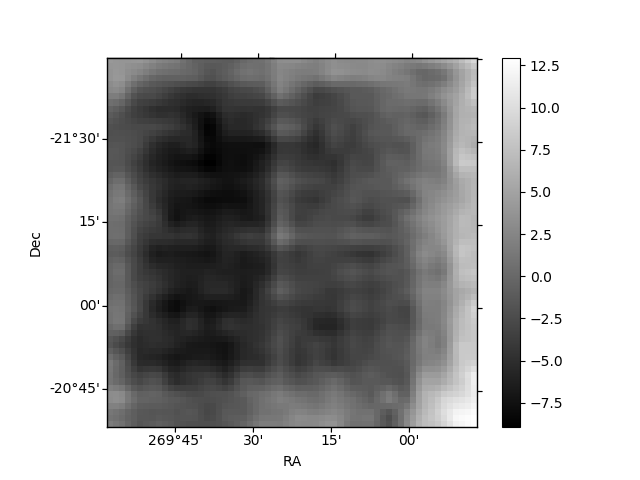
Quadrant B |
|---|---|---|---|
| Quadrant D | 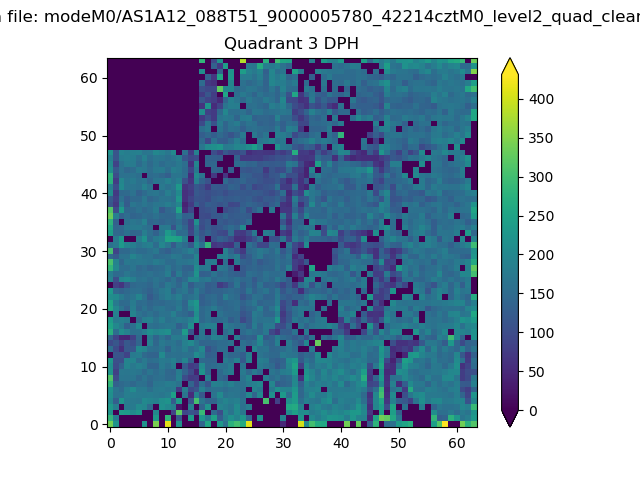 |
 |
Quadrant C |
| Plot type | Count rate plots | Images |
|---|---|---|
| Comparison with Poisson distribution Blue bars denote a histogram of data divided into 1 sec bins. Red curve is a Poisson curve with rate = median count rate of data. |
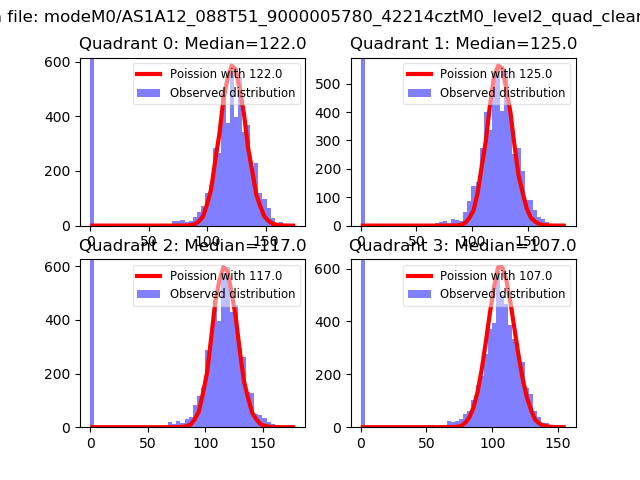 |
 |
| Quadrant-wise count rates Data is divided into 100 sec bins |
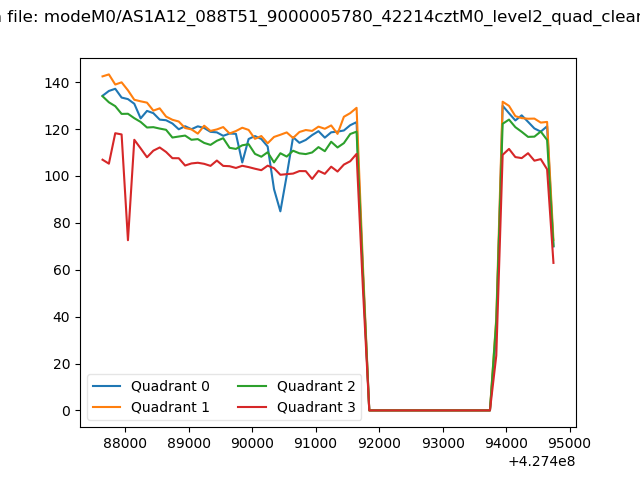 |
|
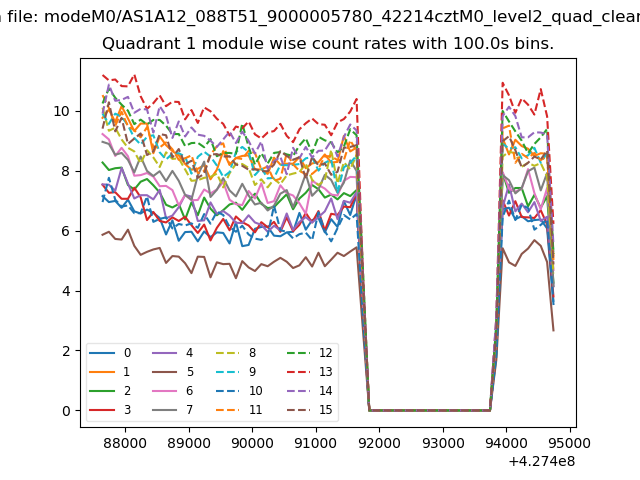
| Module-wise count rates for Quadrant A Data is divided into 100 sec bins |
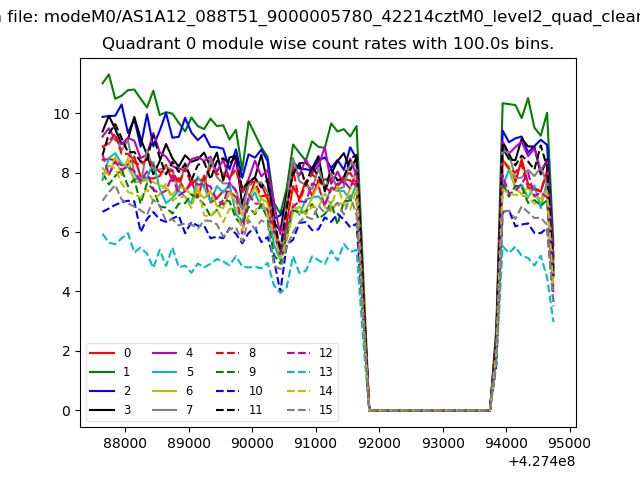 |
 |
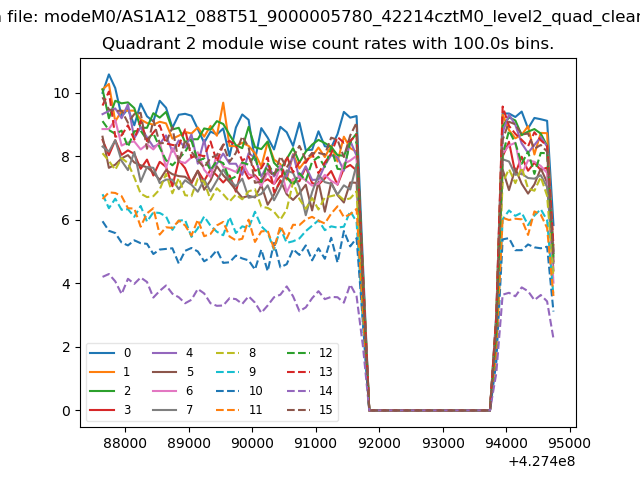
| Module-wise count rates for Quadrant B Data is divided into 100 sec bins |
 |
 |
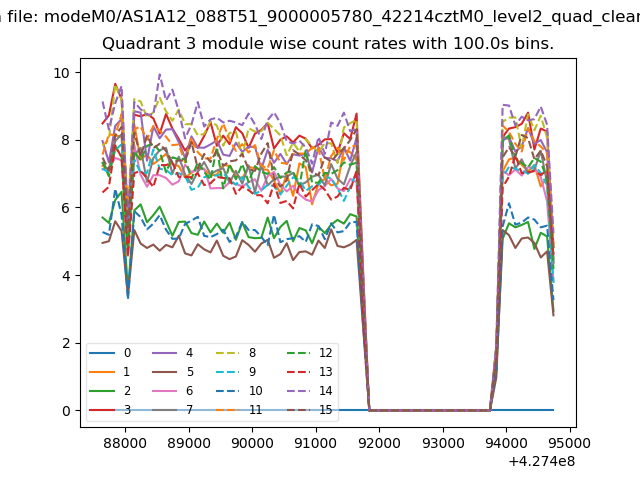
| Module-wise count rates for Quadrant C Data is divided into 100 sec bins |
 |
 |
| Module-wise count rates for Quadrant D Data is divided into 100 sec bins |
 |
 |
| Parameter | Plot |
|---|---|
| CZT HV Monitor | 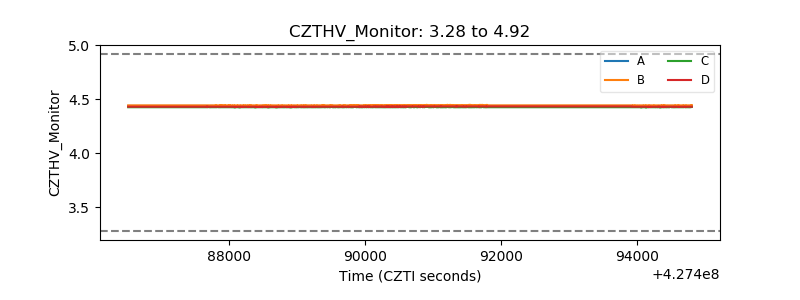 |
| D_VDD | 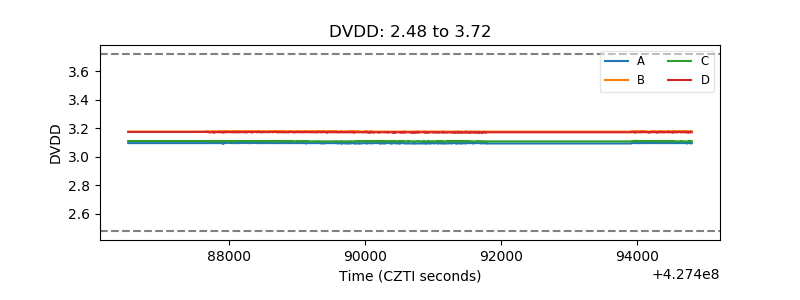 |
| Temperature 1 | 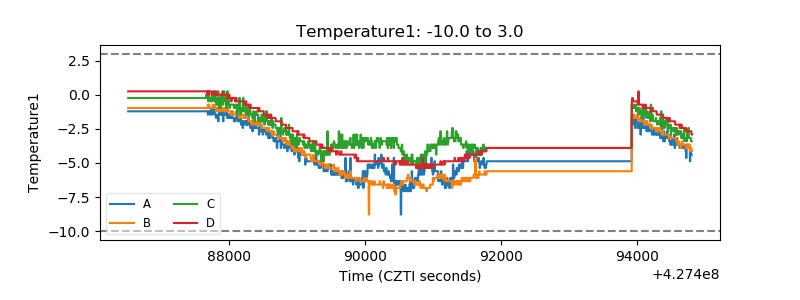 |
| Veto HV Monitor | 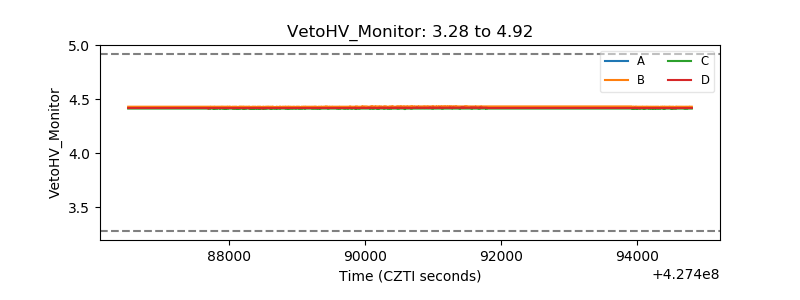 |
| Veto LLD | 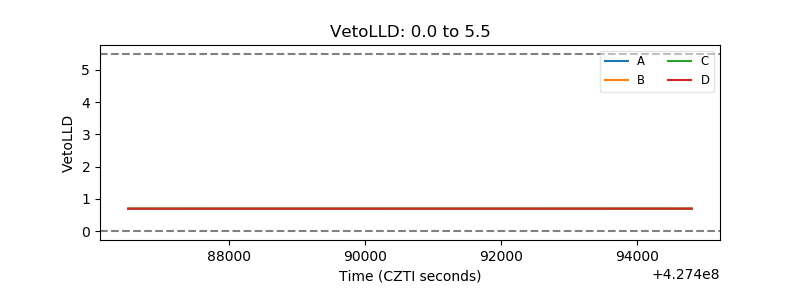 |
| Alpha Counter |  |
| _CPM_Rate |  |
| CZT Counter | 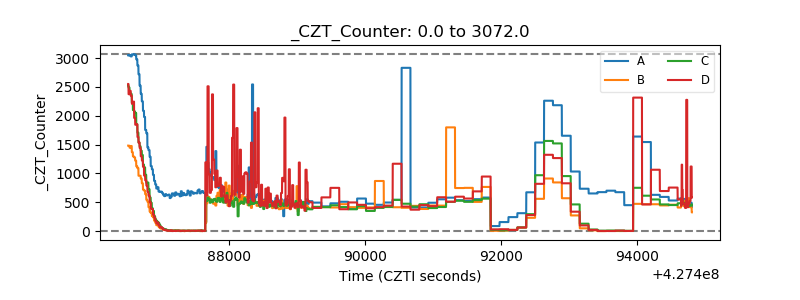 |
| +2.5 Volts monitor | 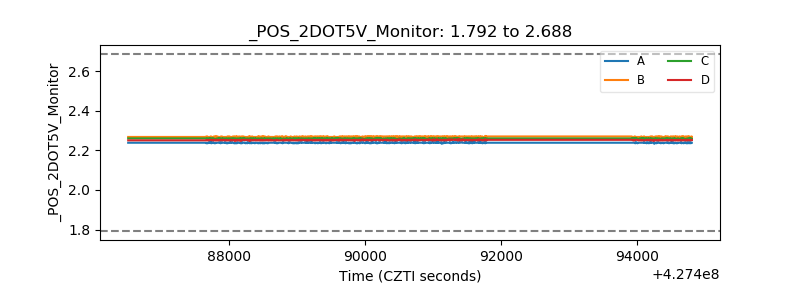 |
| +5 Volts monitor | 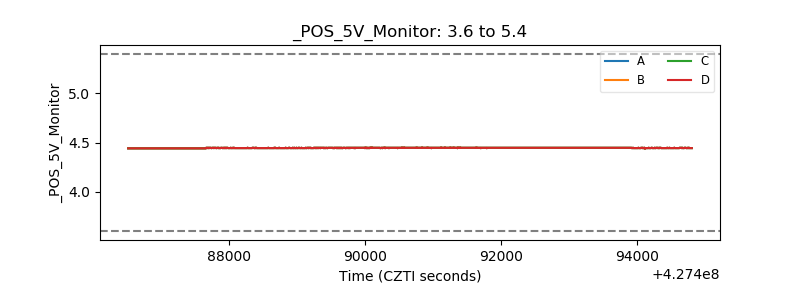 |
| _ROLL_ROT | 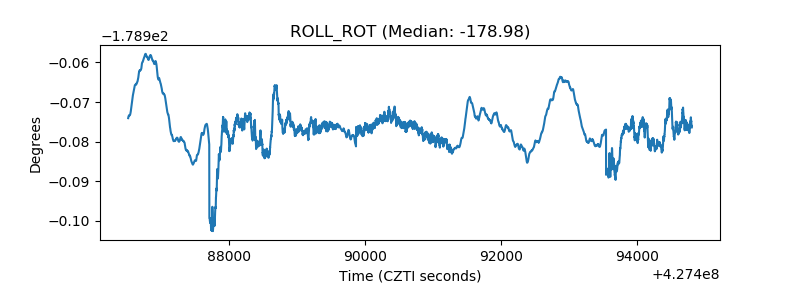 |
| _Roll_DEC | 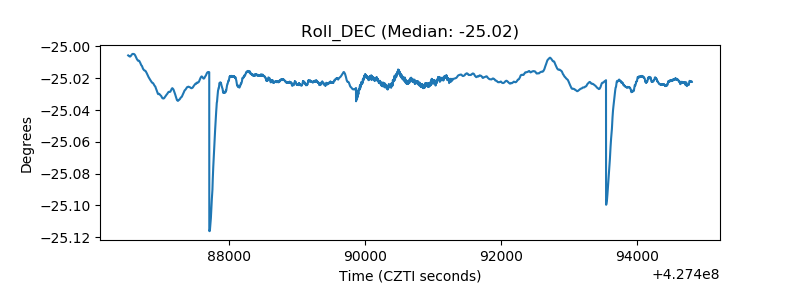 |
| _Roll_RA | 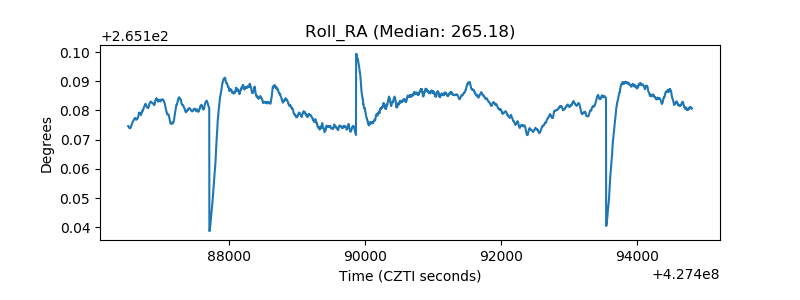 |
| Veto Counter | 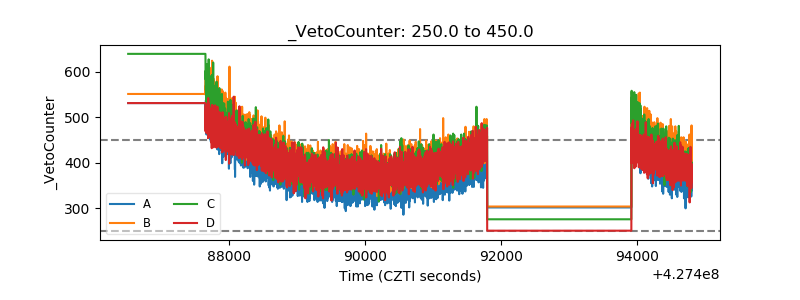 |