| Param | Original file | Final file |
|---|---|---|
| Filename | modeM0/AS1A12_088T51_9000005780_42215cztM0_level2.fits | modeM0/AS1A12_088T51_9000005780_42215cztM0_level2_quad_clean.evt |
| Size (bytes) | 310,389,120 | 84,274,560 |
| Size | 296.0 MB | 80.4 MB |
| Events in quadrant A | 3,068,483 | 567,053 |
| Events in quadrant B | 2,793,215 | 581,332 |
| Events in quadrant C | 2,342,995 | 554,478 |
| Events in quadrant D | 2,897,685 | 500,925 |
| Mode M9 | |||
|---|---|---|---|
| Quadrant | BADHDUFLAG | Total packets | Discarded packets |
| A | 0 | 29 | 0 |
| B | 0 | 30 | 0 |
| C | 0 | 30 | 0 |
| D | 0 | 30 | 0 |
| Mode M0 | |||
|---|---|---|---|
| Quadrant | BADHDUFLAG | Total packets | Discarded packets |
| A | 0 | 12203 | 2 |
| B | 0 | 11753 | 5 |
| C | 0 | 10171 | 2 |
| D | 0 | 12094 | 2 |
| Mode SS | |||
|---|---|---|---|
| Quadrant | BADHDUFLAG | Total packets | Discarded packets |
| A | 0 | 100 | 0 |
| B | 0 | 100 | 0 |
| C | 0 | 100 | 0 |
| D | 0 | 100 | 0 |
| Quadrant | Total seconds | Saturated seconds | Saturation percentage |
|---|---|---|---|
| A | 4966 | 86 | 1.731776% |
| B | 4965 | 141 | 2.839879% |
| C | 4965 | 12 | 0.241692% |
| D | 4965 | 118 | 2.376636% |
Noise dominated data is calculated using 1-second bins in cleaned event files. If a bin has >2000 counts, and if more than 50% of those come from <1% of pixels, then it is considered to be noise-dominated and hence unusable.
| Quadrant | # 1 sec bins | Bins with >0 counts | Bins with >2000 counts | High rate bins dominated by noise | Noise dominated (total time) | Noise dominated (detector-on time) | Marked lightcurve |
|---|---|---|---|---|---|---|---|
| A | 7088 | 4966 | 69 | 69 | 0.97% | 1.39% |  |
| B | 7088 | 4966 | 100 | 100 | 1.41% | 2.01% | 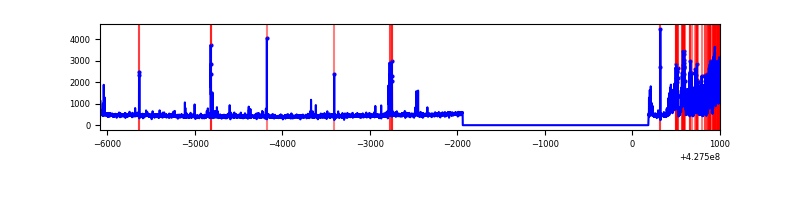 |
| C | 7088 | 4966 | 7 | 7 | 0.10% | 0.14% | 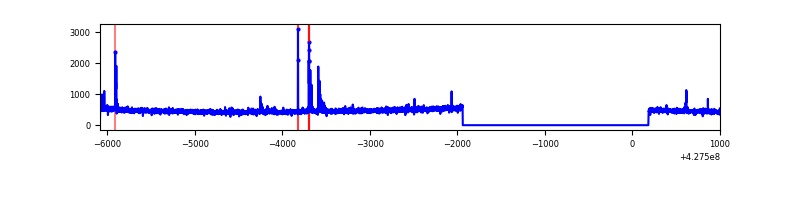 |
| D | 7088 | 4966 | 112 | 112 | 1.58% | 2.26% | 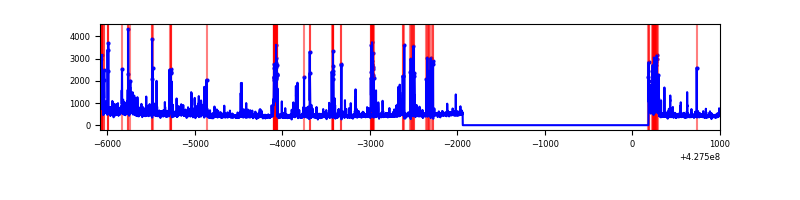 |
Top three noisy pixels from each quadrant. If the there are fewer than three noisy pixels in the level2.evt file, extra rows are filled as -1
| Pixel properties | Quadrant properties | ||||||
|---|---|---|---|---|---|---|---|
| Quadrant | DetID | PixID | Counts | Sigma | Mean | Median | Sigma |
| A | 10 | 83 | 547772 | 4852.15 | 545 | 534 | 112.8 |
| A | 15 | 222 | 218225 | 1930.18 | 545 | 534 | 112.8 |
| A | 15 | 223 | 161040 | 1423.14 | 545 | 534 | 112.8 |
| B | 5 | 255 | 539775 | 5039.66 | 545 | 531 | 107.0 |
| B | 3 | 112 | 73058 | 677.82 | 545 | 531 | 107.0 |
| B | 0 | 229 | 29586 | 271.54 | 545 | 531 | 107.0 |
| C | 15 | 214 | 207822 | 1670.3 | 529 | 532 | 124.1 |
| C | 15 | 159 | 66849 | 534.37 | 529 | 532 | 124.1 |
| C | 13 | 61 | 3629 | 24.96 | 529 | 532 | 124.1 |
| D | 1 | 52 | 352155 | 2742.43 | 522 | 507 | 128.2 |
| D | 12 | 6 | 217833 | 1694.88 | 522 | 507 | 128.2 |
| D | 1 | 47 | 105881 | 821.79 | 522 | 507 | 128.2 |
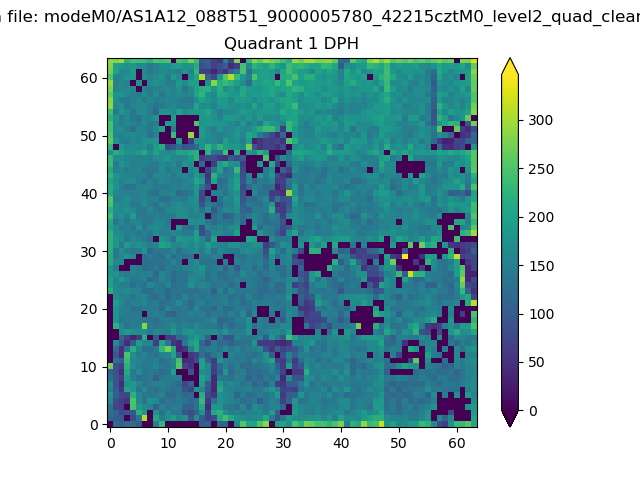
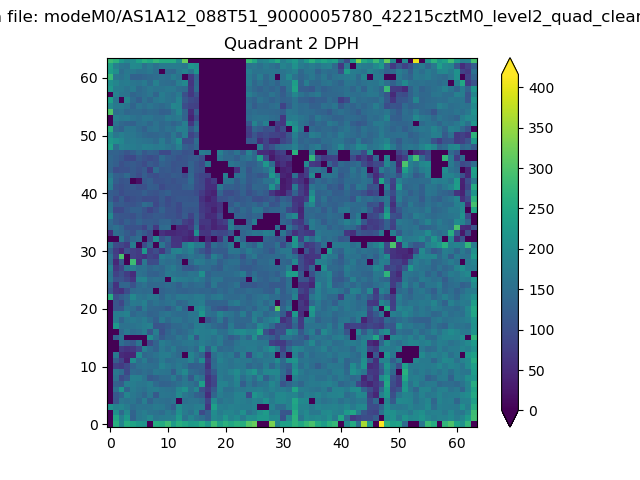
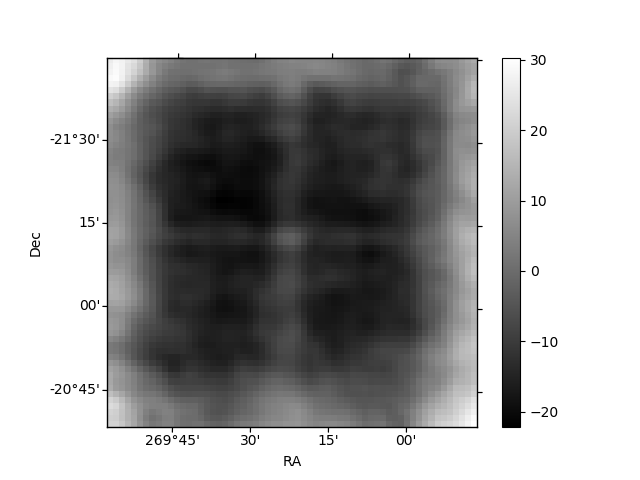
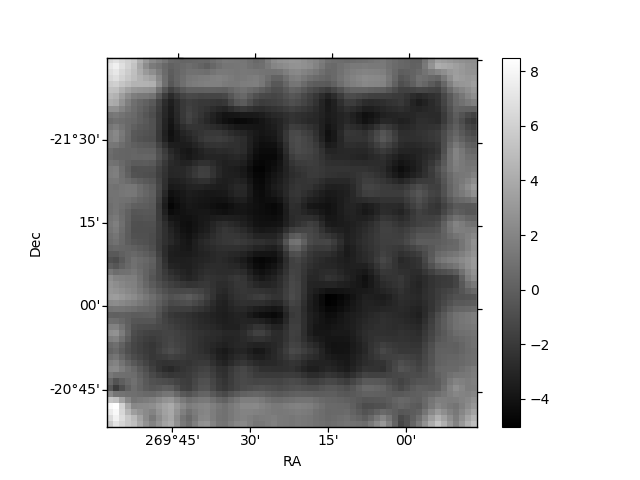
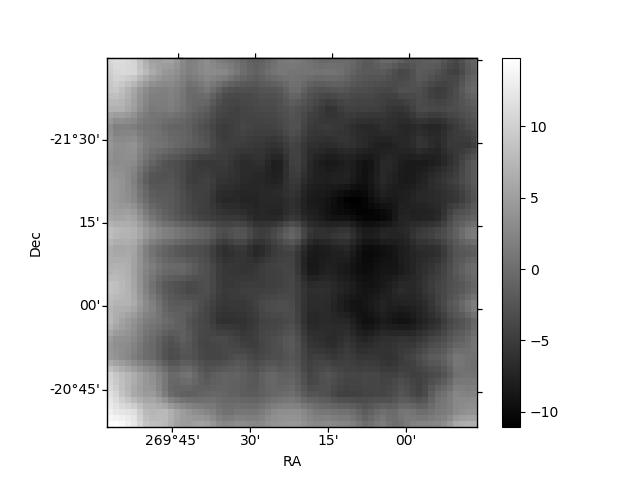
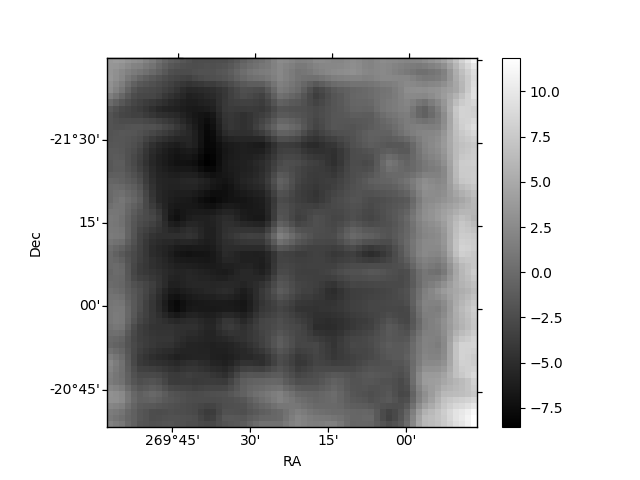
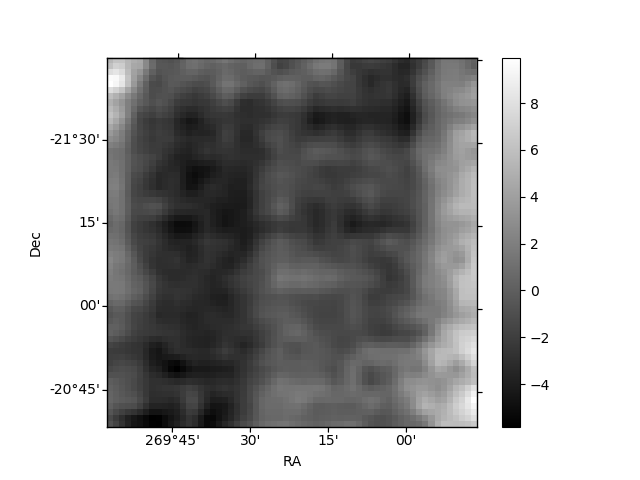
Histogram calculated using DETX and DETY for each event in the final _common_clean file
| Quadrant A | 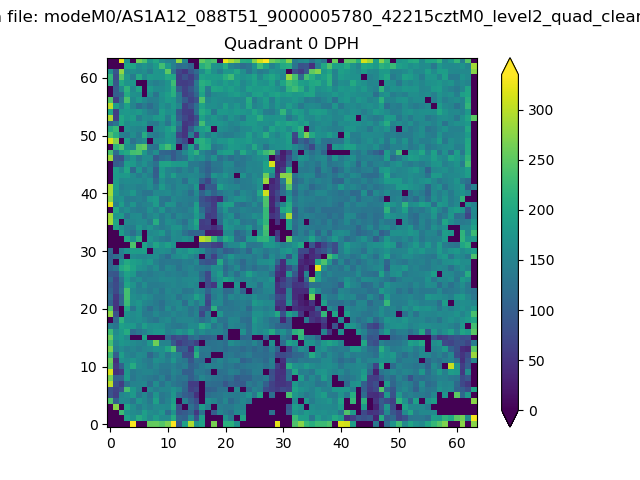 |
 |
Quadrant B |
|---|---|---|---|
| Quadrant D | 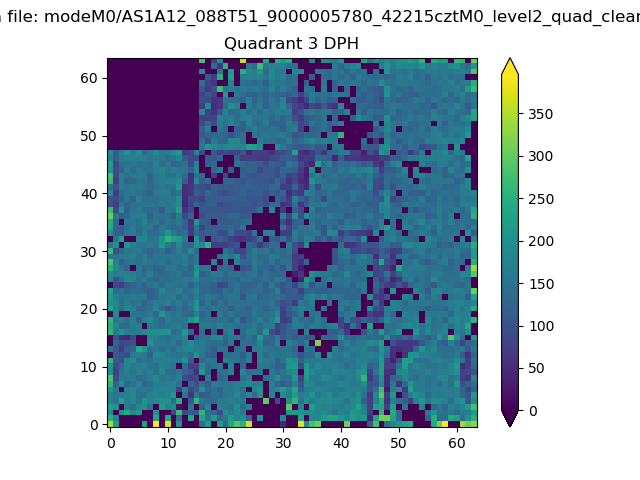 |
 |
Quadrant C |
| Plot type | Count rate plots | Images |
|---|---|---|
| Comparison with Poisson distribution Blue bars denote a histogram of data divided into 1 sec bins. Red curve is a Poisson curve with rate = median count rate of data. |
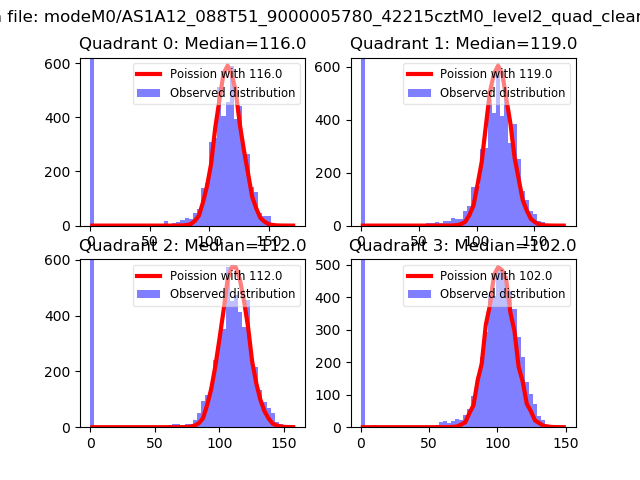 |
 |
| Quadrant-wise count rates Data is divided into 100 sec bins |
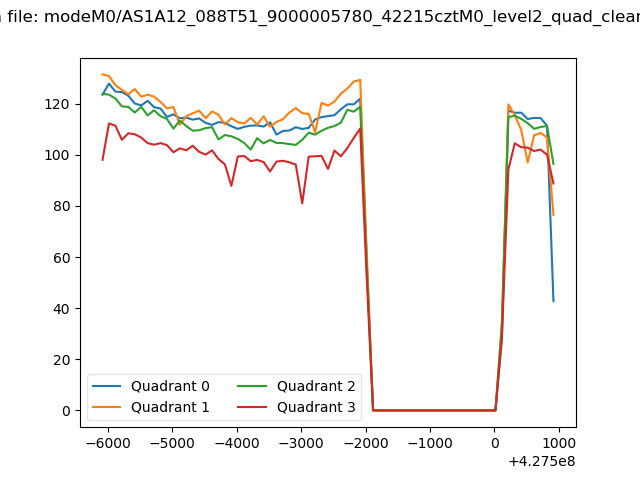 |
|
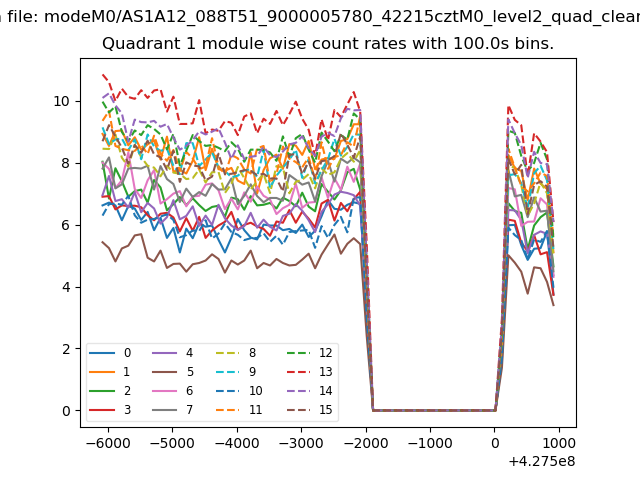
| Module-wise count rates for Quadrant A Data is divided into 100 sec bins |
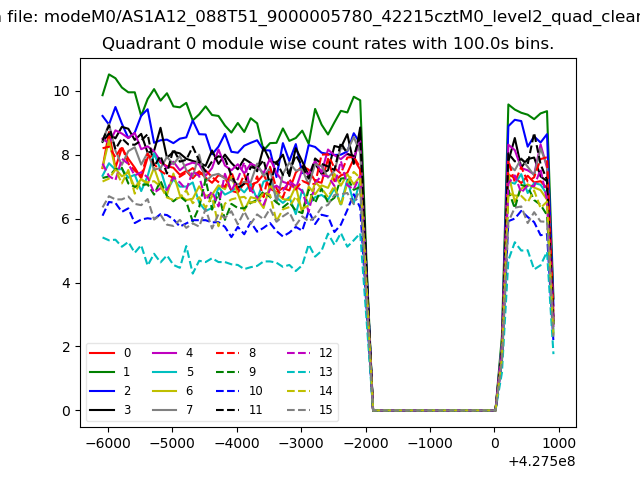 |
 |
| Module-wise count rates for Quadrant B Data is divided into 100 sec bins |
 |
 |
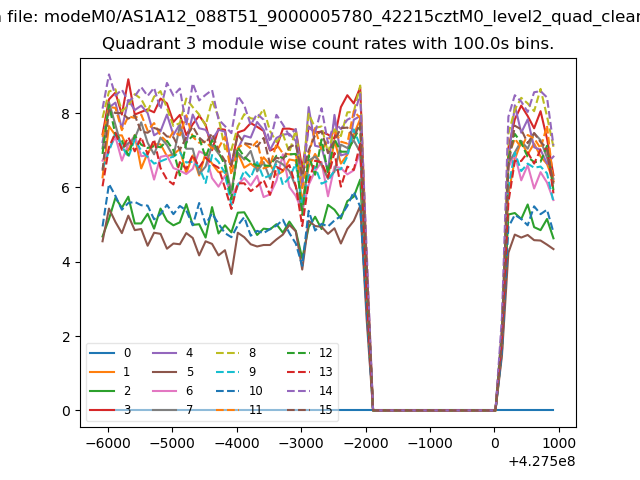
| Module-wise count rates for Quadrant C Data is divided into 100 sec bins |
 |
 |
| Module-wise count rates for Quadrant D Data is divided into 100 sec bins |
 |
 |
| Parameter | Plot |
|---|---|
| CZT HV Monitor | 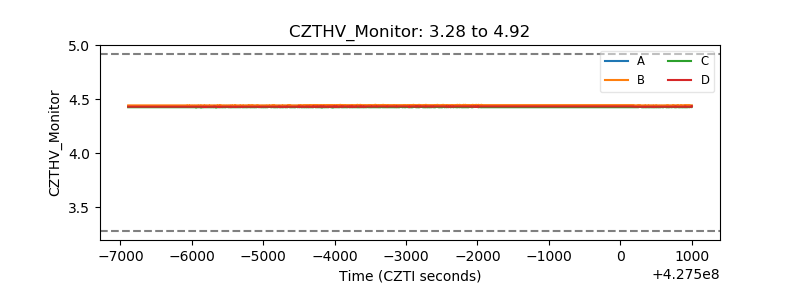 |
| D_VDD | 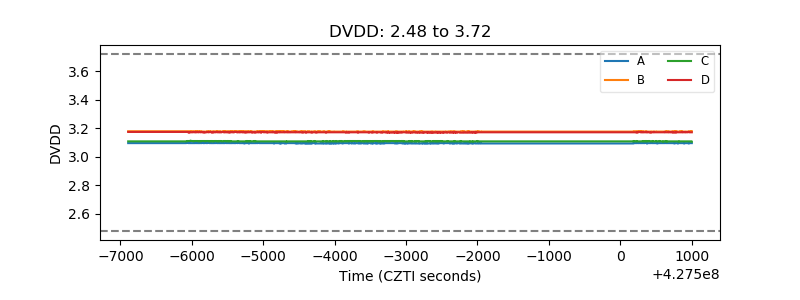 |
| Temperature 1 | 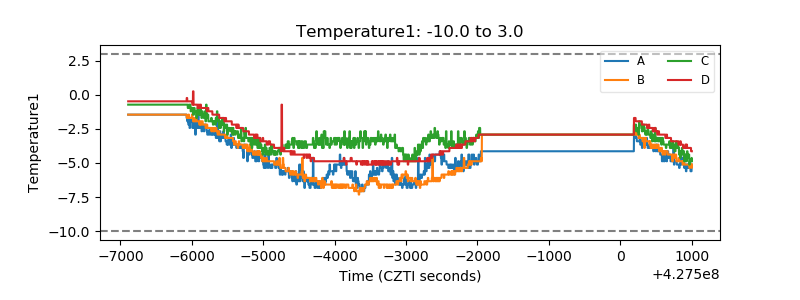 |
| Veto HV Monitor | 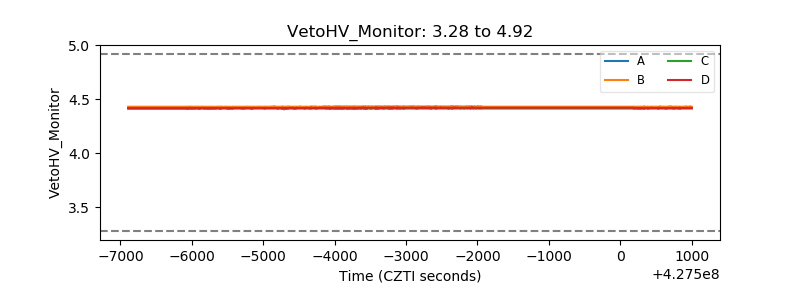 |
| Veto LLD | 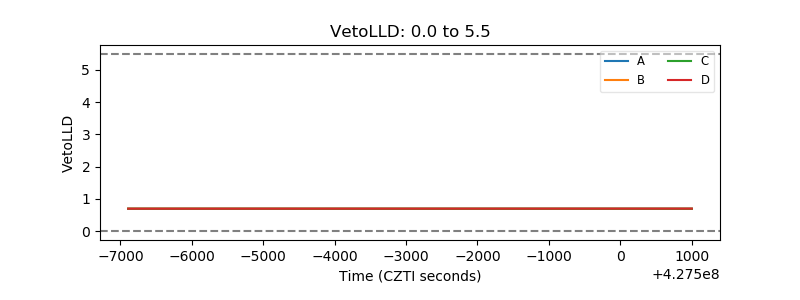 |
| Alpha Counter | 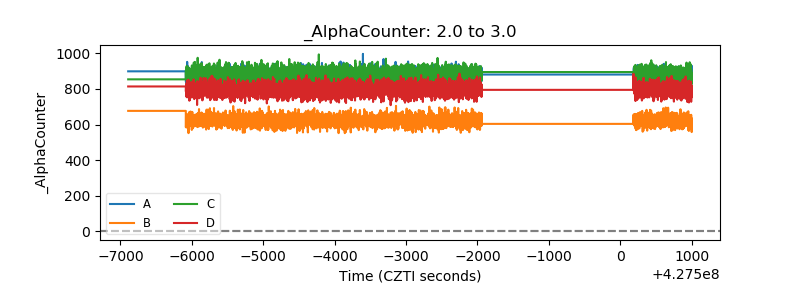 |
| _CPM_Rate |  |
| CZT Counter | 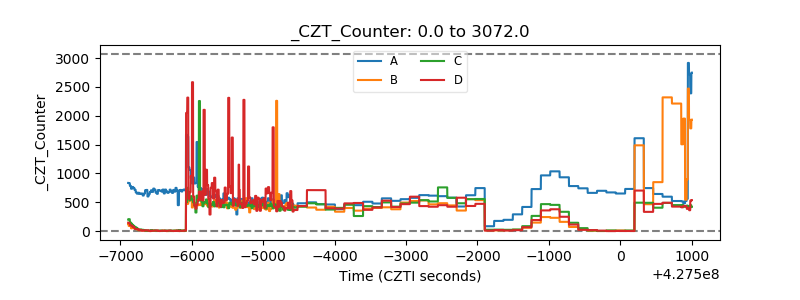 |
| +2.5 Volts monitor |  |
| +5 Volts monitor |  |
| _ROLL_ROT | 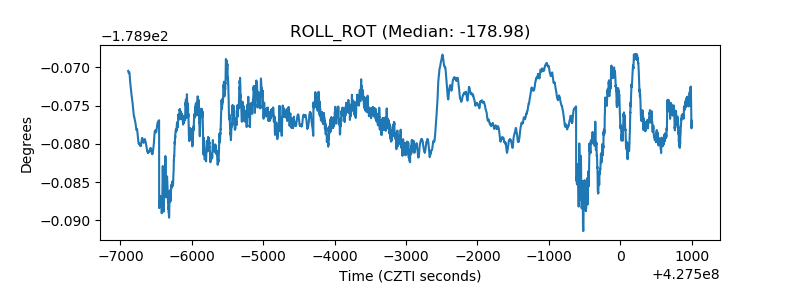 |
| _Roll_DEC | 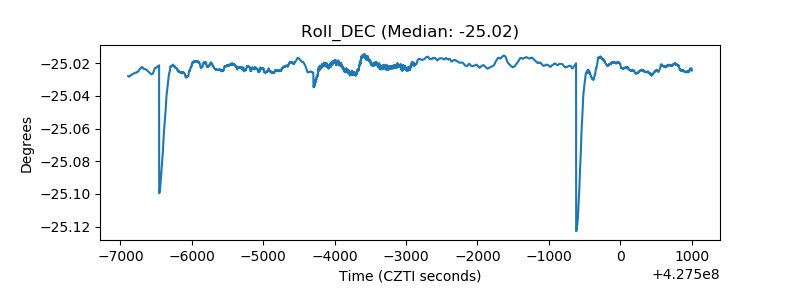 |
| _Roll_RA | 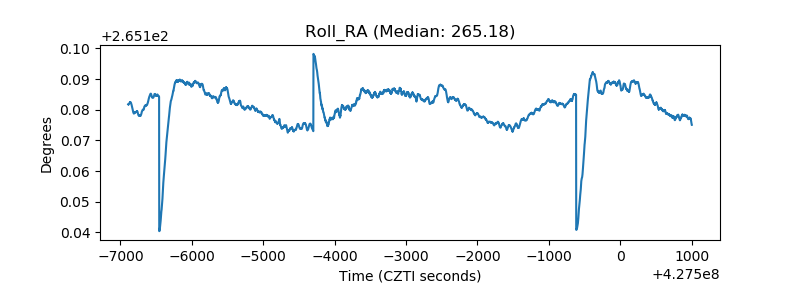 |
| Veto Counter | 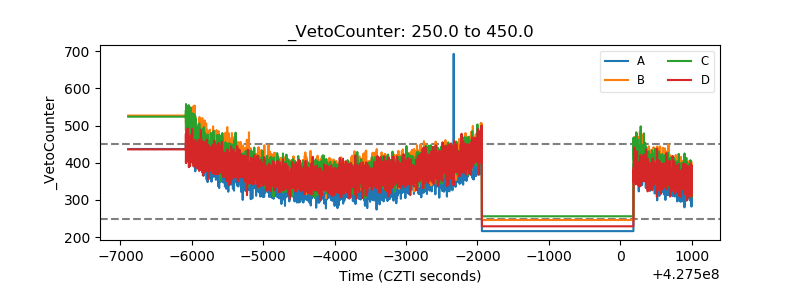 |