| Param | Original file | Final file |
|---|---|---|
| Filename | modeM0/AS1A12_088T51_9000005780_42217cztM0_level2.fits | modeM0/AS1A12_088T51_9000005780_42217cztM0_level2_quad_clean.evt |
| Size (bytes) | 310,947,840 | 89,248,320 |
| Size | 296.5 MB | 85.1 MB |
| Events in quadrant A | 3,214,790 | 592,677 |
| Events in quadrant B | 2,502,729 | 613,330 |
| Events in quadrant C | 2,545,607 | 581,159 |
| Events in quadrant D | 2,819,773 | 531,557 |
| Mode M9 | |||
|---|---|---|---|
| Quadrant | BADHDUFLAG | Total packets | Discarded packets |
| A | 0 | 26 | 0 |
| B | 0 | 27 | 0 |
| C | 0 | 27 | 0 |
| D | 0 | 27 | 0 |
| Mode M0 | |||
|---|---|---|---|
| Quadrant | BADHDUFLAG | Total packets | Discarded packets |
| A | 0 | 12858 | 2 |
| B | 0 | 11374 | 2 |
| C | 0 | 11091 | 2 |
| D | 0 | 12383 | 2 |
| Mode SS | |||
|---|---|---|---|
| Quadrant | BADHDUFLAG | Total packets | Discarded packets |
| A | 0 | 112 | 0 |
| B | 0 | 112 | 0 |
| C | 0 | 112 | 0 |
| D | 0 | 112 | 0 |
| Quadrant | Total seconds | Saturated seconds | Saturation percentage |
|---|---|---|---|
| A | 5480 | 79 | 1.441606% |
| B | 5480 | 46 | 0.839416% |
| C | 5480 | 7 | 0.127737% |
| D | 5480 | 73 | 1.332117% |
Noise dominated data is calculated using 1-second bins in cleaned event files. If a bin has >2000 counts, and if more than 50% of those come from <1% of pixels, then it is considered to be noise-dominated and hence unusable.
| Quadrant | # 1 sec bins | Bins with >0 counts | Bins with >2000 counts | High rate bins dominated by noise | Noise dominated (total time) | Noise dominated (detector-on time) | Marked lightcurve |
|---|---|---|---|---|---|---|---|
| A | 7123 | 5481 | 66 | 66 | 0.93% | 1.20% | 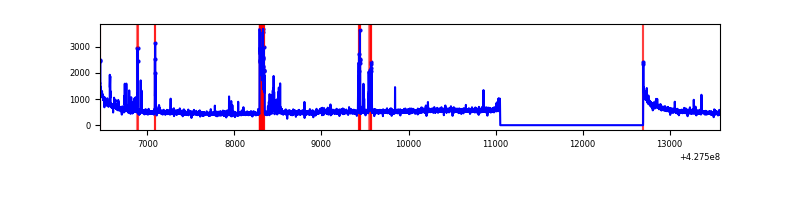 |
| B | 7123 | 5481 | 35 | 35 | 0.49% | 0.64% | 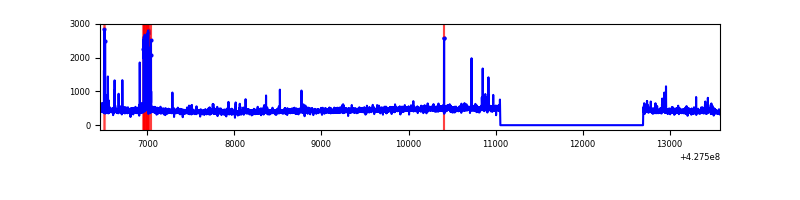 |
| C | 7123 | 5481 | 2 | 2 | 0.03% | 0.04% | 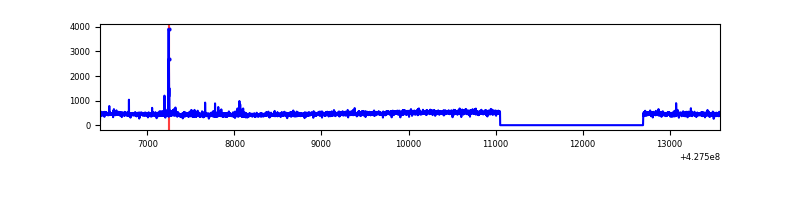 |
| D | 7123 | 5481 | 64 | 64 | 0.90% | 1.17% | 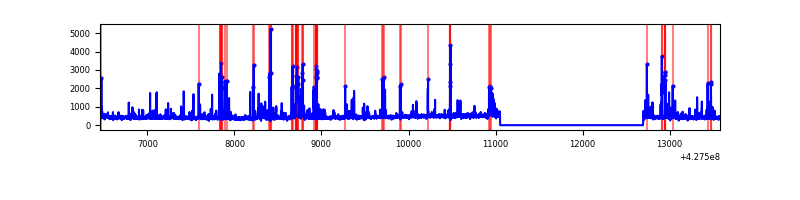 |
Top three noisy pixels from each quadrant. If the there are fewer than three noisy pixels in the level2.evt file, extra rows are filled as -1
| Pixel properties | Quadrant properties | ||||||
|---|---|---|---|---|---|---|---|
| Quadrant | DetID | PixID | Counts | Sigma | Mean | Median | Sigma |
| A | 10 | 83 | 545584 | 4419.65 | 593 | 580 | 123.3 |
| A | 9 | 143 | 197015 | 1592.97 | 593 | 580 | 123.3 |
| A | 13 | 248 | 86774 | 698.98 | 593 | 580 | 123.3 |
| B | 0 | 229 | 108408 | 932.27 | 593 | 577 | 115.7 |
| B | 3 | 112 | 43129 | 367.89 | 593 | 577 | 115.7 |
| B | 12 | 111 | 15021 | 124.88 | 593 | 577 | 115.7 |
| C | 15 | 214 | 226981 | 1656.37 | 581 | 586 | 136.7 |
| C | 15 | 159 | 42318 | 305.32 | 581 | 586 | 136.7 |
| C | 7 | 220 | 6946 | 46.53 | 581 | 586 | 136.7 |
| D | 12 | 6 | 240208 | 1685.94 | 575 | 559 | 142.1 |
| D | 1 | 52 | 108822 | 761.64 | 575 | 559 | 142.1 |
| D | 2 | 249 | 93456 | 653.54 | 575 | 559 | 142.1 |
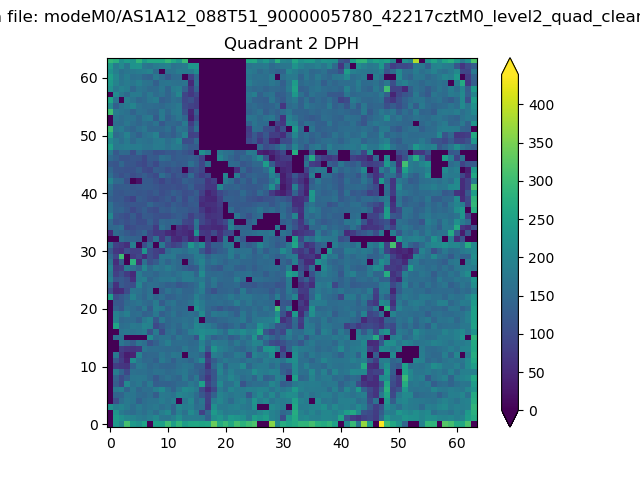
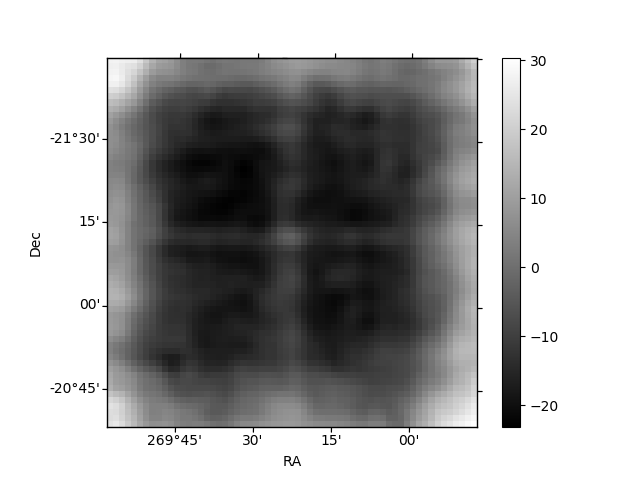
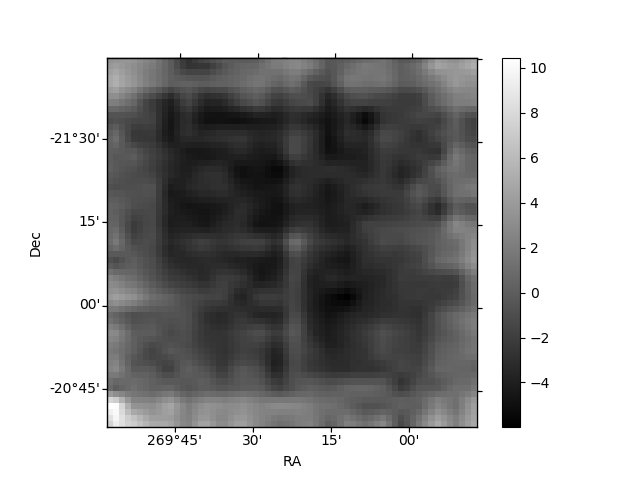
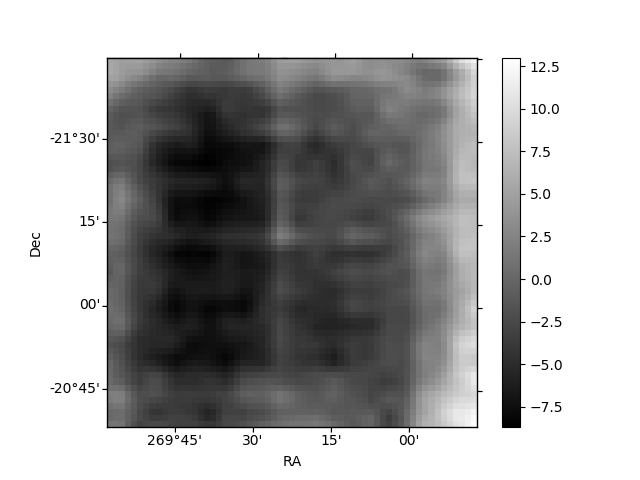
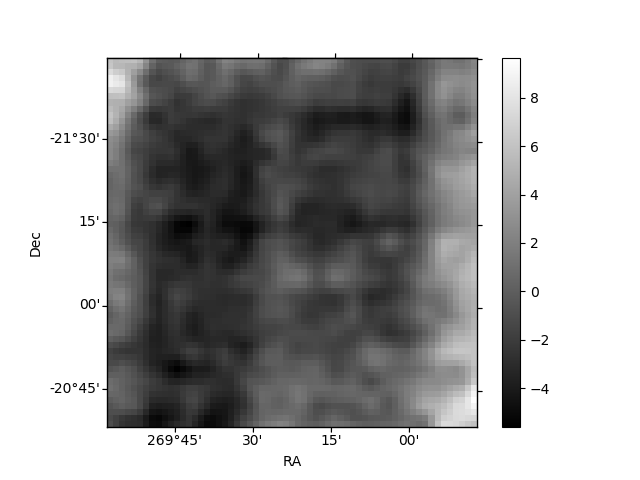
Histogram calculated using DETX and DETY for each event in the final _common_clean file
| Quadrant A | 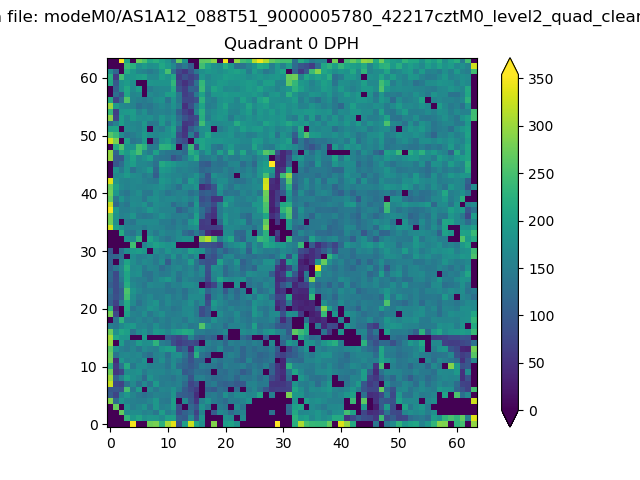 |
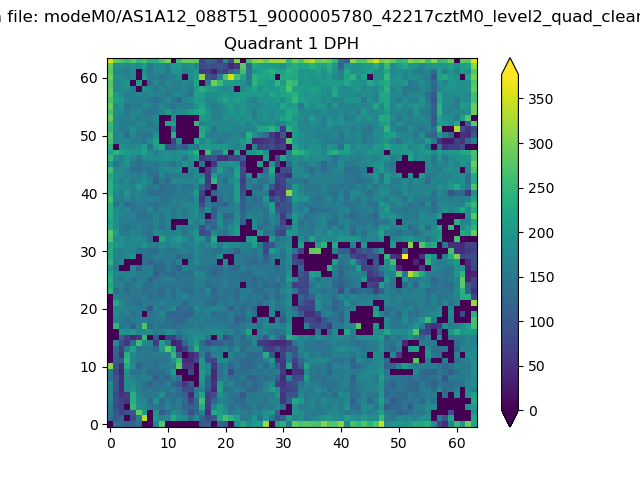 |
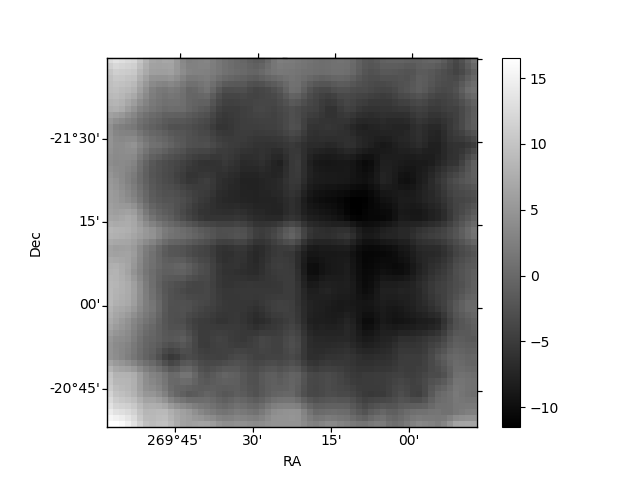
Quadrant B |
|---|---|---|---|
| Quadrant D | 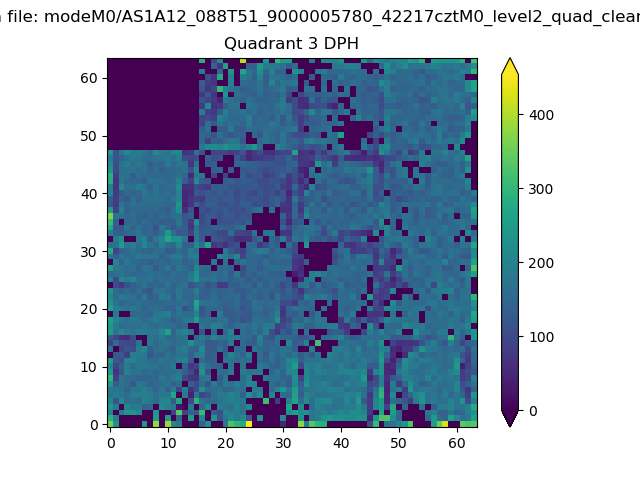 |
 |
Quadrant C |
| Plot type | Count rate plots | Images |
|---|---|---|
| Comparison with Poisson distribution Blue bars denote a histogram of data divided into 1 sec bins. Red curve is a Poisson curve with rate = median count rate of data. |
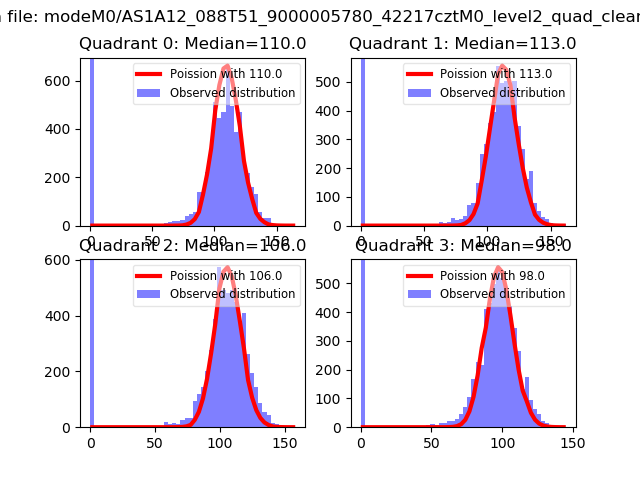 |
 |
| Quadrant-wise count rates Data is divided into 100 sec bins |
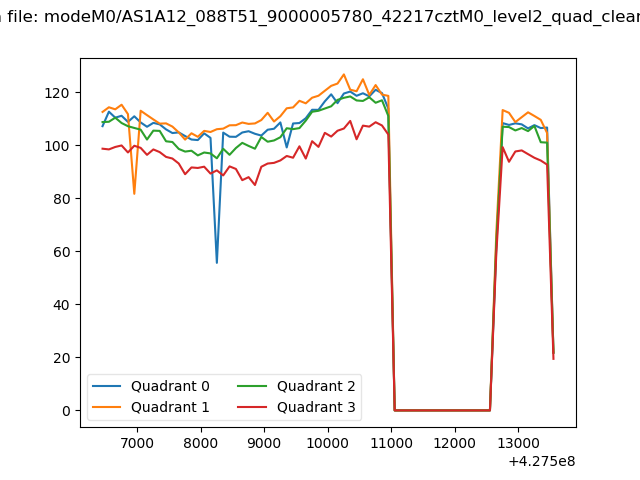 |
|
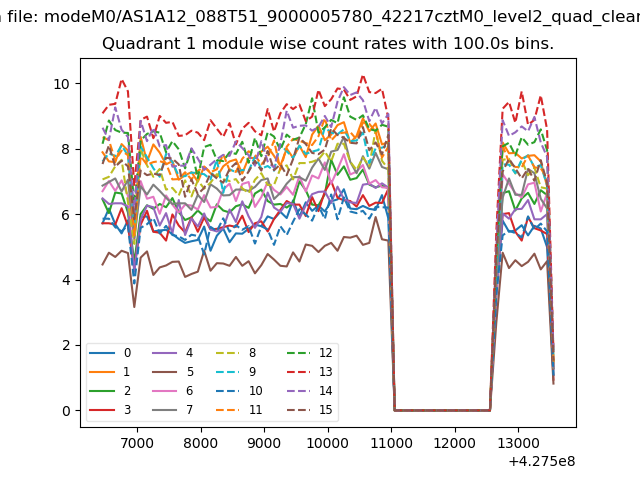
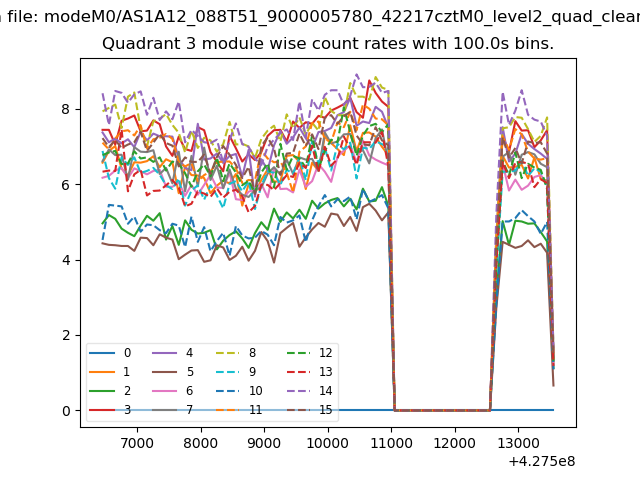
| Module-wise count rates for Quadrant A Data is divided into 100 sec bins |
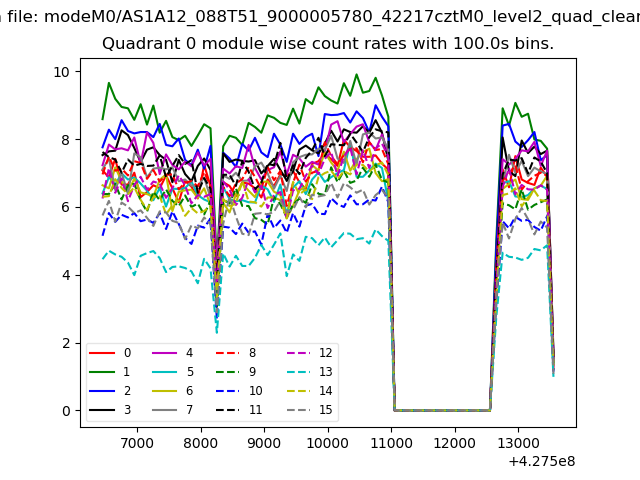 |
 |
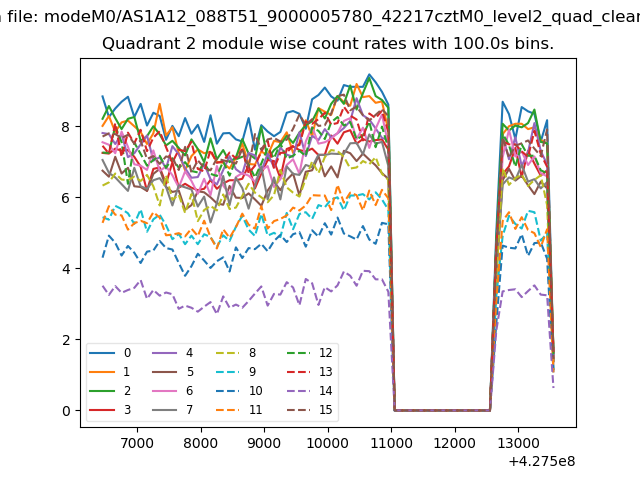
| Module-wise count rates for Quadrant B Data is divided into 100 sec bins |
 |
 |
| Module-wise count rates for Quadrant C Data is divided into 100 sec bins |
 |
 |
| Module-wise count rates for Quadrant D Data is divided into 100 sec bins |
 |
 |
| Parameter | Plot |
|---|---|
| CZT HV Monitor |  |
| D_VDD | 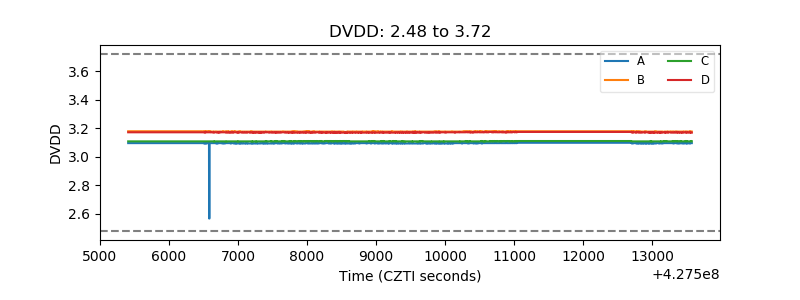 |
| Temperature 1 | 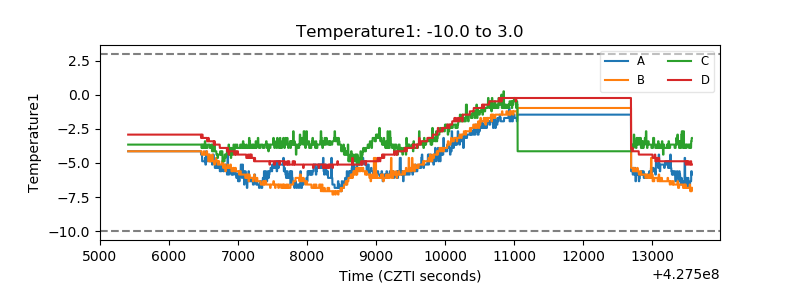 |
| Veto HV Monitor | 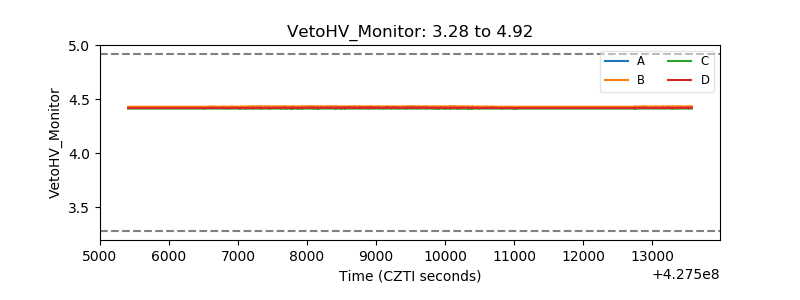 |
| Veto LLD | 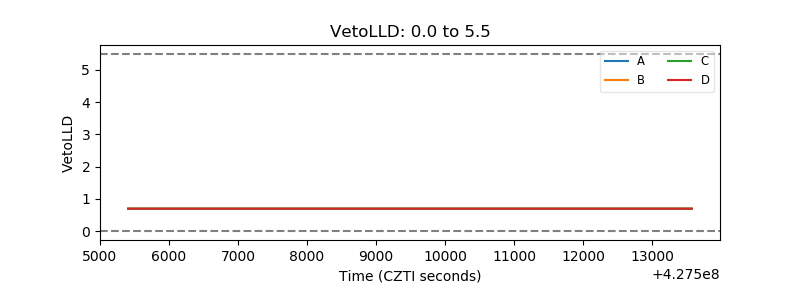 |
| Alpha Counter | 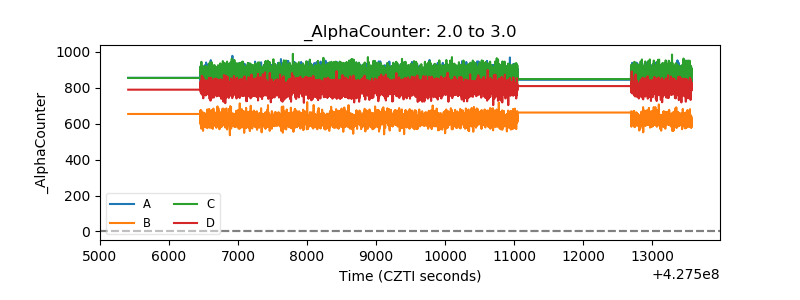 |
| _CPM_Rate |  |
| CZT Counter | 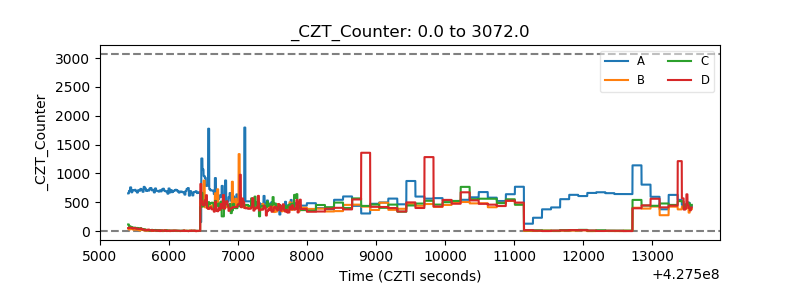 |
| +2.5 Volts monitor |  |
| +5 Volts monitor |  |
| _ROLL_ROT | 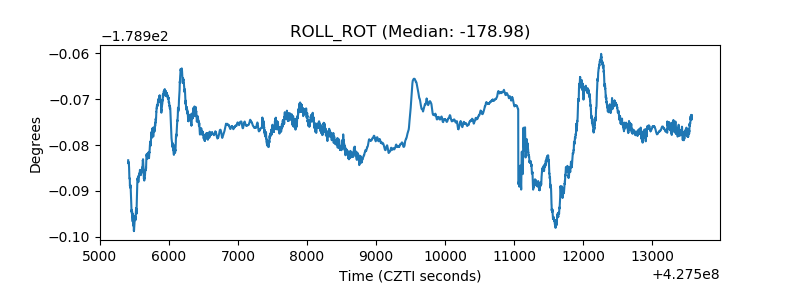 |
| _Roll_DEC | 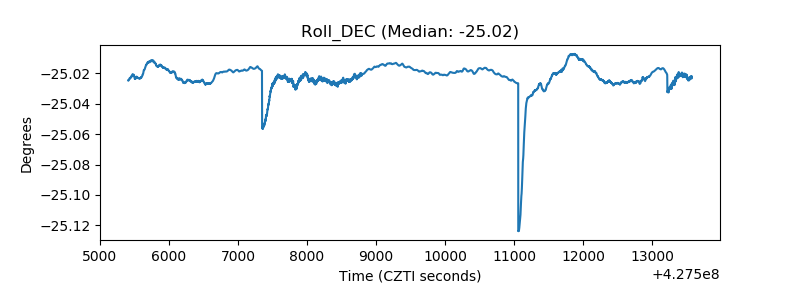 |
| _Roll_RA | 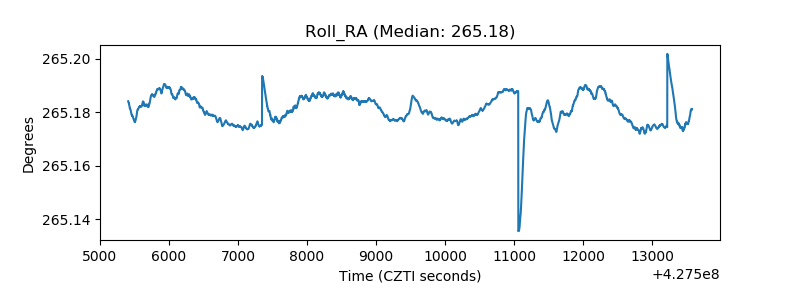 |
| Veto Counter | 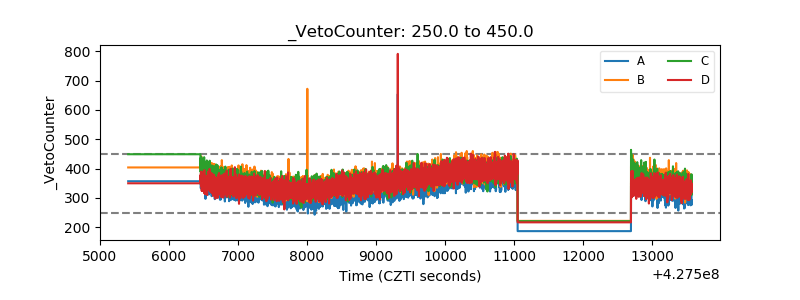 |