| Param | Original file | Final file |
|---|---|---|
| Filename | modeM0/AS1A12_088T51_9000005780_42218cztM0_level2.fits | modeM0/AS1A12_088T51_9000005780_42218cztM0_level2_quad_clean.evt |
| Size (bytes) | 565,623,360 | 155,796,480 |
| Size | 539.4 MB | 148.6 MB |
| Events in quadrant A | 5,297,487 | 1,040,835 |
| Events in quadrant B | 4,345,139 | 1,073,638 |
| Events in quadrant C | 4,503,507 | 1,014,845 |
| Events in quadrant D | 6,038,025 | 915,375 |
| Mode M9 | |||
|---|---|---|---|
| Quadrant | BADHDUFLAG | Total packets | Discarded packets |
| A | 0 | 30 | 0 |
| B | 0 | 30 | 0 |
| C | 0 | 30 | 0 |
| D | 0 | 30 | 0 |
| Mode M0 | |||
|---|---|---|---|
| Quadrant | BADHDUFLAG | Total packets | Discarded packets |
| A | 0 | 21483 | 2 |
| B | 0 | 19883 | 2 |
| C | 0 | 19565 | 2 |
| D | 0 | 24843 | 2 |
| Mode SS | |||
|---|---|---|---|
| Quadrant | BADHDUFLAG | Total packets | Discarded packets |
| A | 0 | 198 | 0 |
| B | 0 | 198 | 0 |
| C | 0 | 198 | 0 |
| D | 0 | 198 | 0 |
| Quadrant | Total seconds | Saturated seconds | Saturation percentage |
|---|---|---|---|
| A | 9703 | 79 | 0.814181% |
| B | 9704 | 32 | 0.329761% |
| C | 9704 | 7 | 0.072135% |
| D | 9704 | 299 | 3.081204% |
Noise dominated data is calculated using 1-second bins in cleaned event files. If a bin has >2000 counts, and if more than 50% of those come from <1% of pixels, then it is considered to be noise-dominated and hence unusable.
| Quadrant | # 1 sec bins | Bins with >0 counts | Bins with >2000 counts | High rate bins dominated by noise | Noise dominated (total time) | Noise dominated (detector-on time) | Marked lightcurve |
|---|---|---|---|---|---|---|---|
| A | 12718 | 9705 | 62 | 62 | 0.49% | 0.64% | 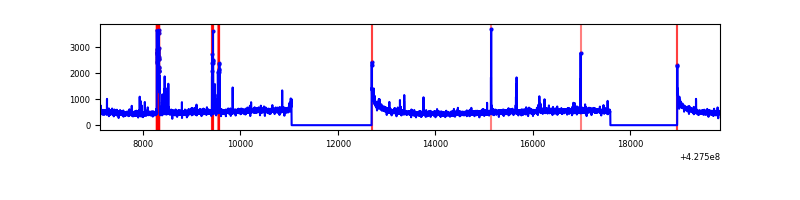 |
| B | 12719 | 9706 | 12 | 12 | 0.09% | 0.12% | 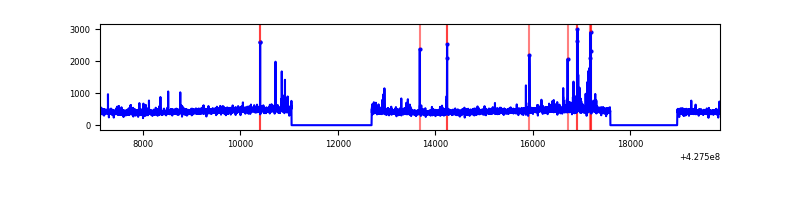 |
| C | 12719 | 9706 | 2 | 2 | 0.02% | 0.02% | 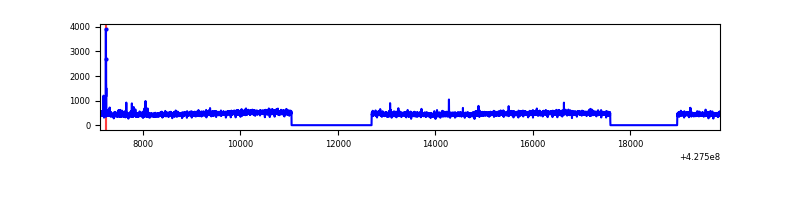 |
| D | 12719 | 9706 | 279 | 279 | 2.19% | 2.87% | 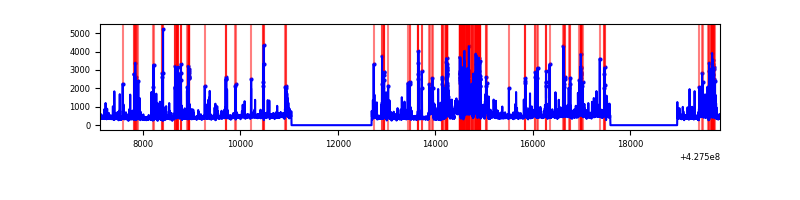 |
Top three noisy pixels from each quadrant. If the there are fewer than three noisy pixels in the level2.evt file, extra rows are filled as -1
| Pixel properties | Quadrant properties | ||||||
|---|---|---|---|---|---|---|---|
| Quadrant | DetID | PixID | Counts | Sigma | Mean | Median | Sigma |
| A | 10 | 83 | 824302 | 3755.83 | 1062 | 1038 | 219.2 |
| A | 9 | 143 | 197201 | 894.92 | 1062 | 1038 | 219.2 |
| A | 13 | 248 | 58361 | 261.51 | 1062 | 1038 | 219.2 |
| B | 3 | 112 | 55238 | 264.89 | 1058 | 1031 | 204.6 |
| B | 15 | 85 | 51876 | 248.47 | 1058 | 1031 | 204.6 |
| B | 7 | 202 | 37120 | 176.36 | 1058 | 1031 | 204.6 |
| C | 15 | 214 | 395575 | 1633.26 | 1036 | 1044 | 241.6 |
| C | 15 | 159 | 44344 | 179.25 | 1036 | 1044 | 241.6 |
| C | 3 | 233 | 13272 | 50.62 | 1036 | 1044 | 241.6 |
| D | 12 | 6 | 962792 | 3853.87 | 1019 | 991 | 249.6 |
| D | 1 | 52 | 550420 | 2201.52 | 1019 | 991 | 249.6 |
| D | 2 | 249 | 213059 | 849.74 | 1019 | 991 | 249.6 |
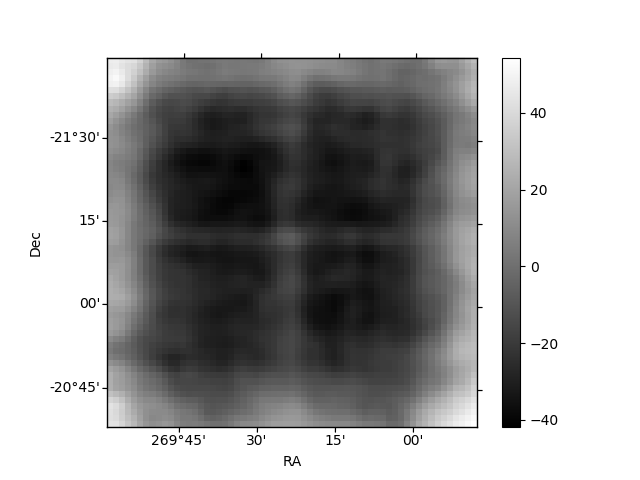
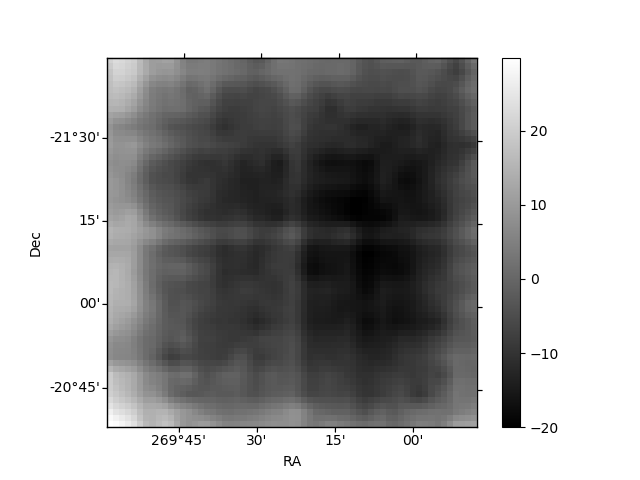
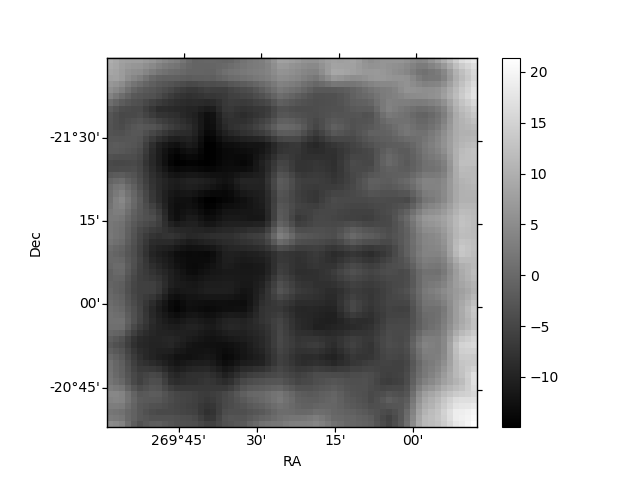
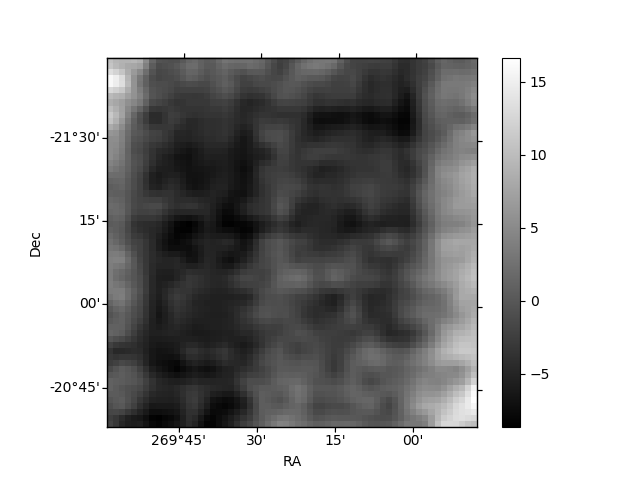
Histogram calculated using DETX and DETY for each event in the final _common_clean file
| Quadrant A | 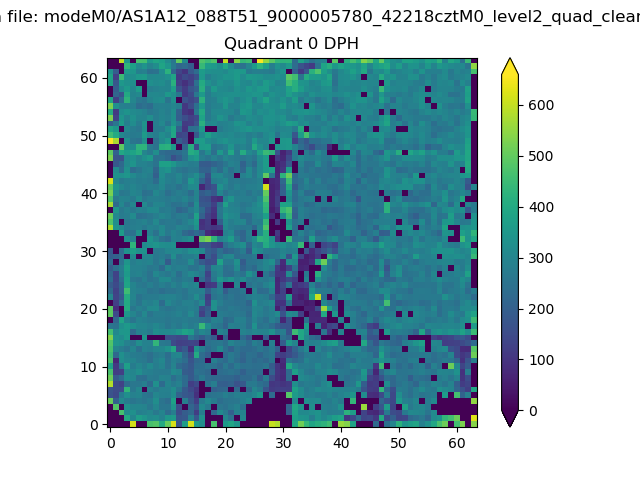 |
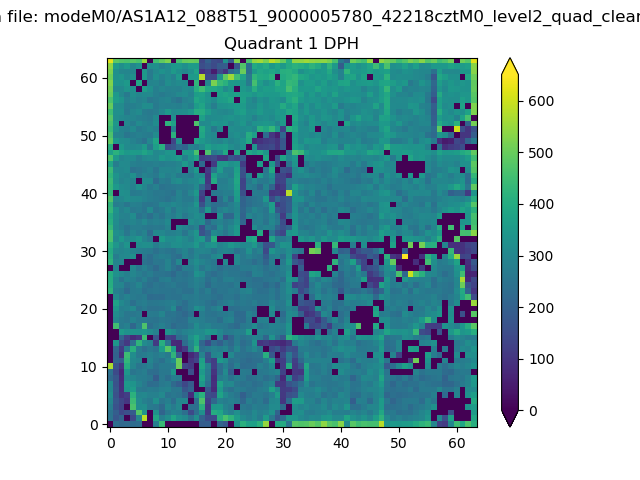 |
Quadrant B |
|---|---|---|---|
| Quadrant D | 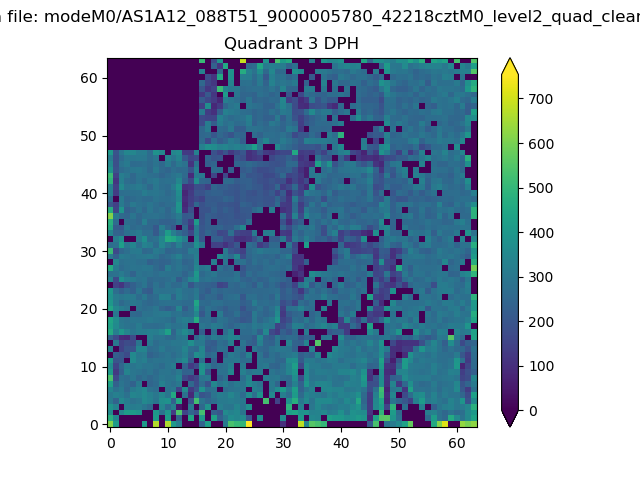 |
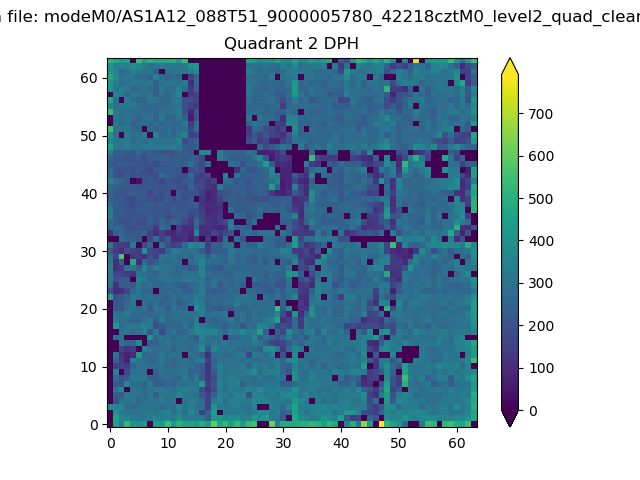 |
Quadrant C |
| Plot type | Count rate plots | Images |
|---|---|---|
| Comparison with Poisson distribution Blue bars denote a histogram of data divided into 1 sec bins. Red curve is a Poisson curve with rate = median count rate of data. |
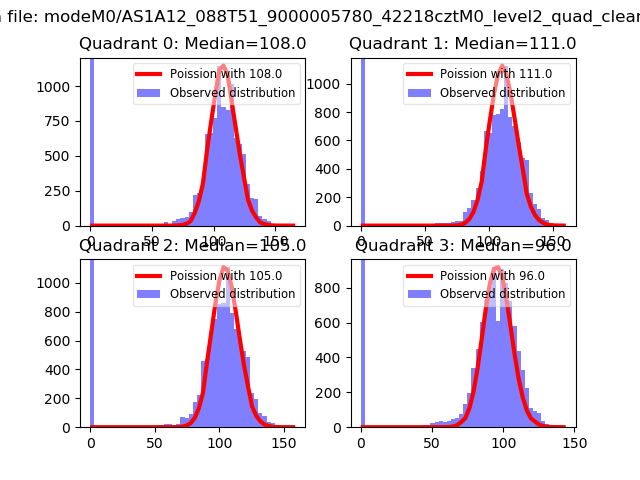 |
 |
| Quadrant-wise count rates Data is divided into 100 sec bins |
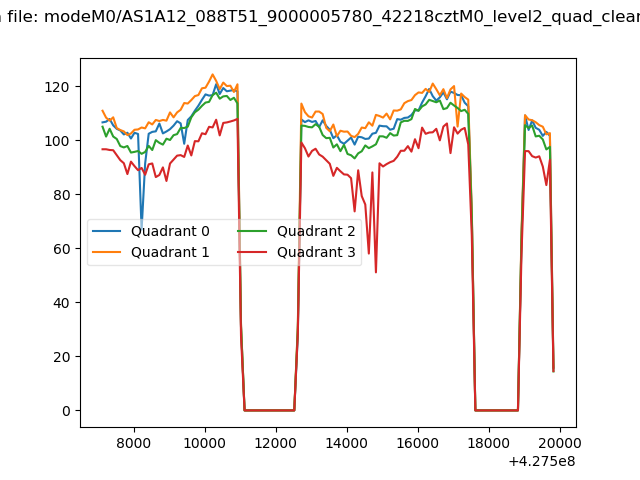 |
|
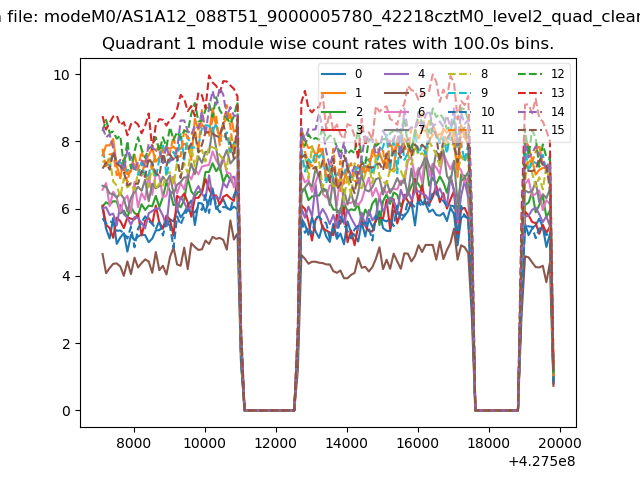
| Module-wise count rates for Quadrant A Data is divided into 100 sec bins |
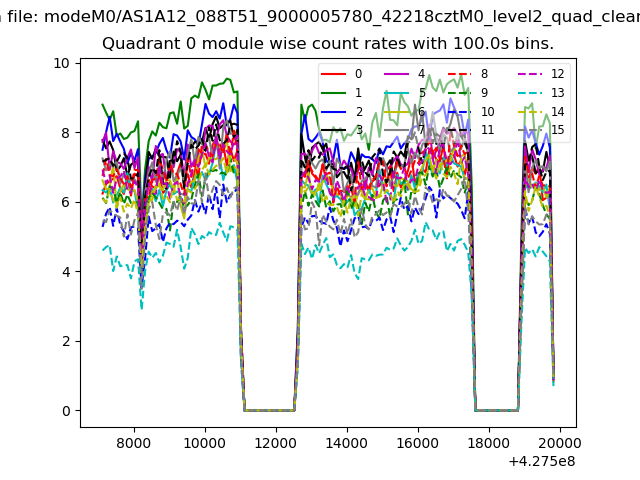 |
 |
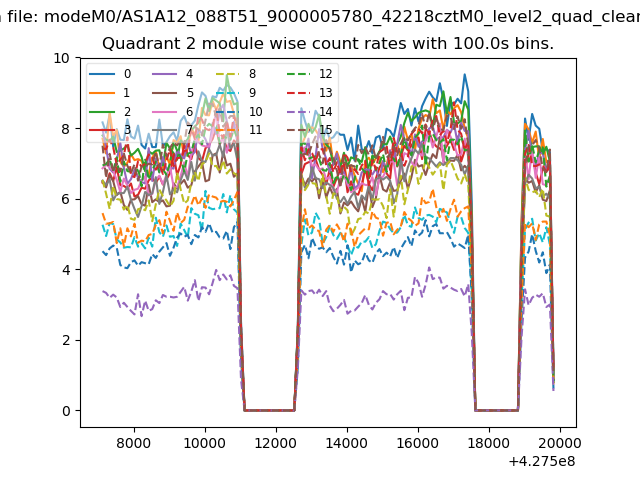
| Module-wise count rates for Quadrant B Data is divided into 100 sec bins |
 |
 |
| Module-wise count rates for Quadrant C Data is divided into 100 sec bins |
 |
 |
| Module-wise count rates for Quadrant D Data is divided into 100 sec bins |
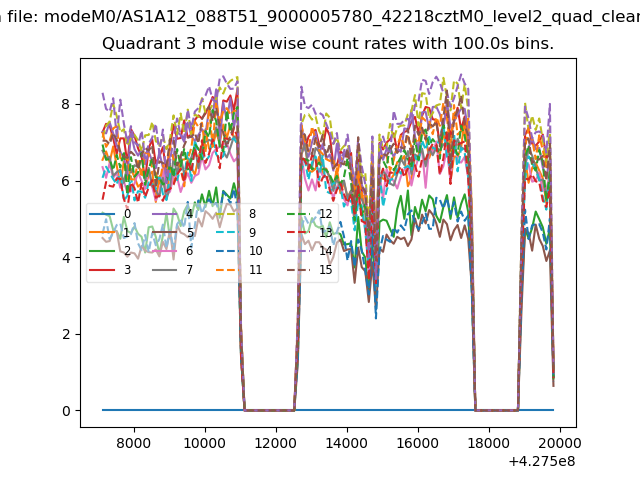 |
 |
| Parameter | Plot |
|---|---|
| CZT HV Monitor | 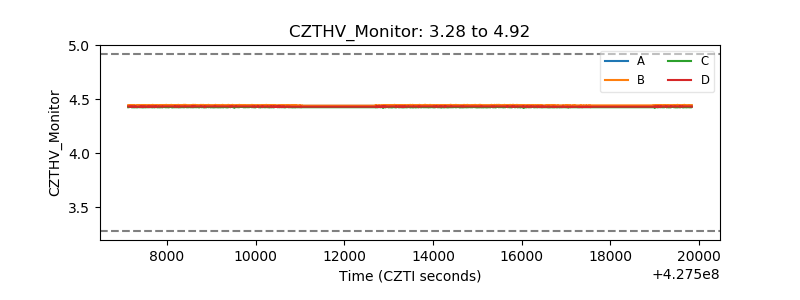 |
| D_VDD | 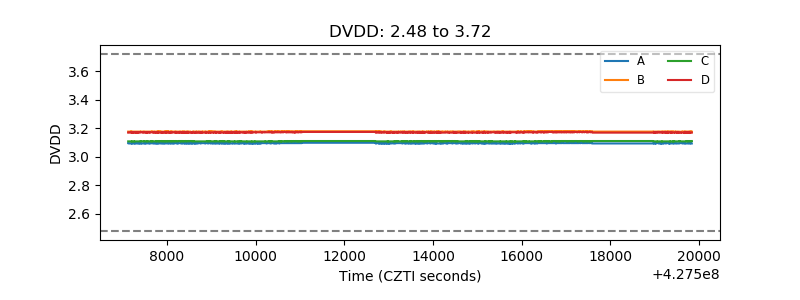 |
| Temperature 1 | 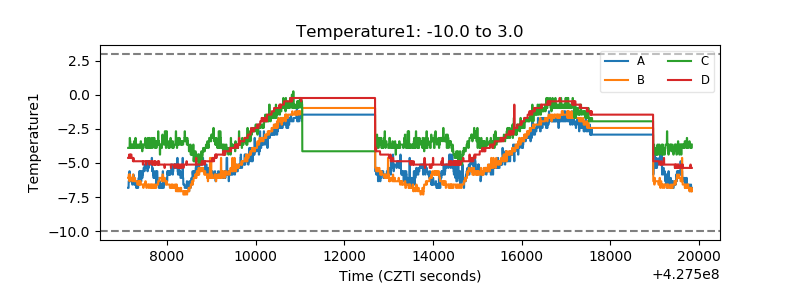 |
| Veto HV Monitor |  |
| Veto LLD | 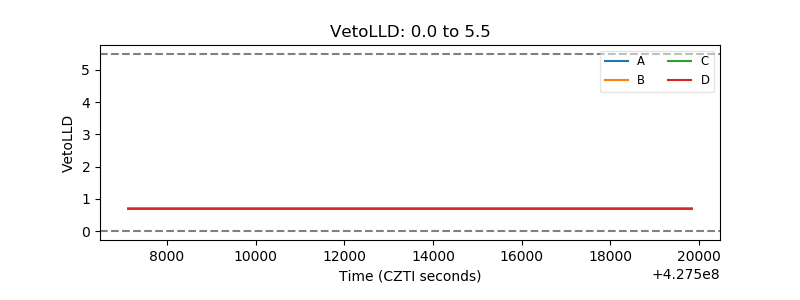 |
| Alpha Counter |  |
| _CPM_Rate |  |
| CZT Counter | 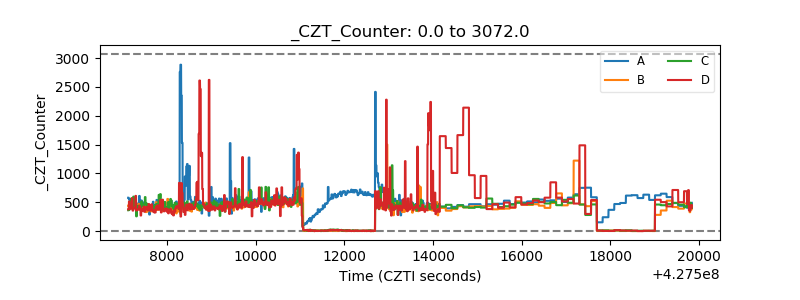 |
| +2.5 Volts monitor | 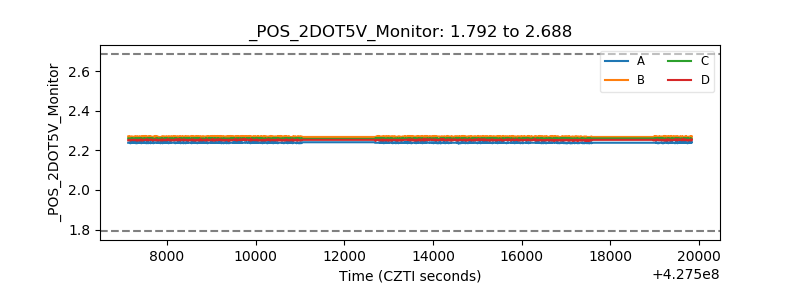 |
| +5 Volts monitor |  |
| _ROLL_ROT | 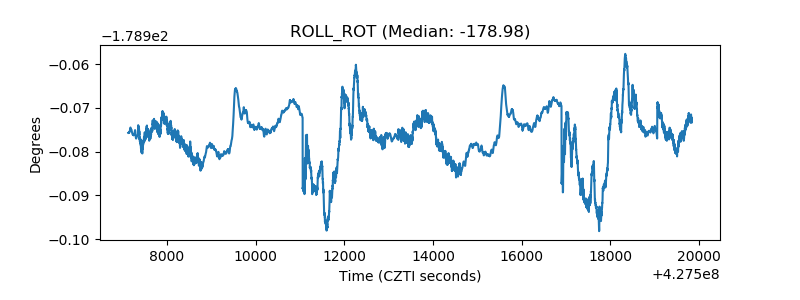 |
| _Roll_DEC | 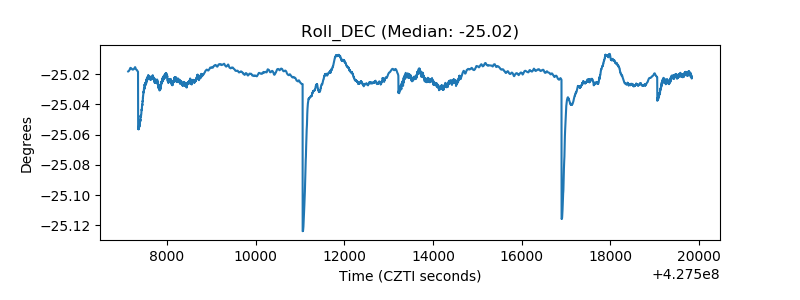 |
| _Roll_RA | 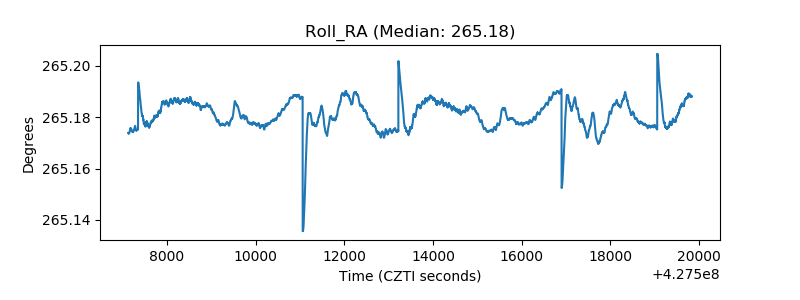 |
| Veto Counter | 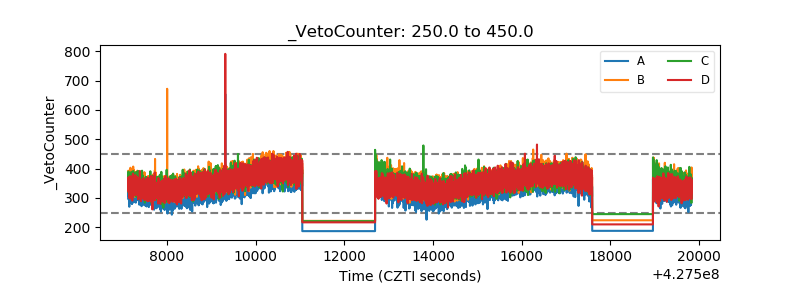 |