| Param | Original file | Final file |
|---|---|---|
| Filename | modeM0/AS1A12_088T51_9000005780_42219cztM0_level2.fits | modeM0/AS1A12_088T51_9000005780_42219cztM0_level2_quad_clean.evt |
| Size (bytes) | 345,715,200 | 98,337,600 |
| Size | 329.7 MB | 93.8 MB |
| Events in quadrant A | 3,445,173 | 654,786 |
| Events in quadrant B | 2,665,649 | 675,611 |
| Events in quadrant C | 2,786,698 | 637,901 |
| Events in quadrant D | 3,423,775 | 582,554 |
| Mode M9 | |||
|---|---|---|---|
| Quadrant | BADHDUFLAG | Total packets | Discarded packets |
| A | 0 | 27 | 0 |
| B | 0 | 27 | 0 |
| C | 0 | 27 | 0 |
| D | 0 | 27 | 0 |
| Mode M0 | |||
|---|---|---|---|
| Quadrant | BADHDUFLAG | Total packets | Discarded packets |
| A | 0 | 13833 | 2 |
| B | 0 | 12358 | 2 |
| C | 0 | 12252 | 2 |
| D | 0 | 14531 | 2 |
| Mode SS | |||
|---|---|---|---|
| Quadrant | BADHDUFLAG | Total packets | Discarded packets |
| A | 0 | 126 | 0 |
| B | 0 | 126 | 0 |
| C | 0 | 126 | 0 |
| D | 0 | 126 | 0 |
| Quadrant | Total seconds | Saturated seconds | Saturation percentage |
|---|---|---|---|
| A | 6110 | 52 | 0.851064% |
| B | 6111 | 8 | 0.130911% |
| C | 6111 | 3 | 0.049092% |
| D | 6111 | 90 | 1.472754% |
Noise dominated data is calculated using 1-second bins in cleaned event files. If a bin has >2000 counts, and if more than 50% of those come from <1% of pixels, then it is considered to be noise-dominated and hence unusable.
| Quadrant | # 1 sec bins | Bins with >0 counts | Bins with >2000 counts | High rate bins dominated by noise | Noise dominated (total time) | Noise dominated (detector-on time) | Marked lightcurve |
|---|---|---|---|---|---|---|---|
| A | 8795 | 6112 | 44 | 44 | 0.50% | 0.72% | 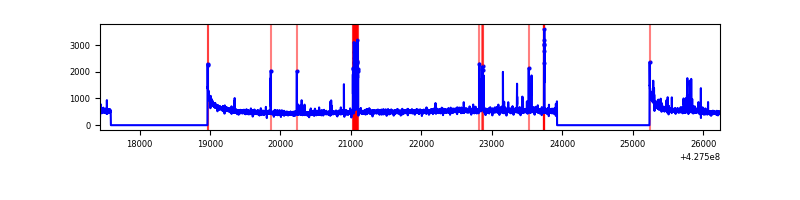 |
| B | 8796 | 6113 | 2 | 2 | 0.02% | 0.03% | 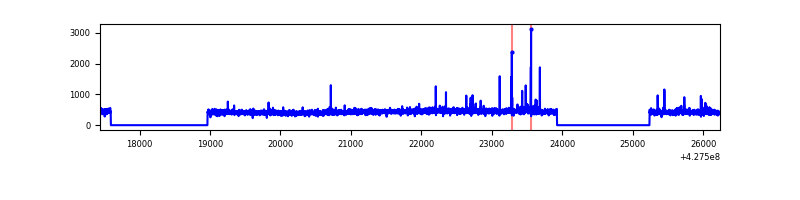 |
| C | 8796 | 6113 | 0 | 0 | 0.00% | 0.00% | 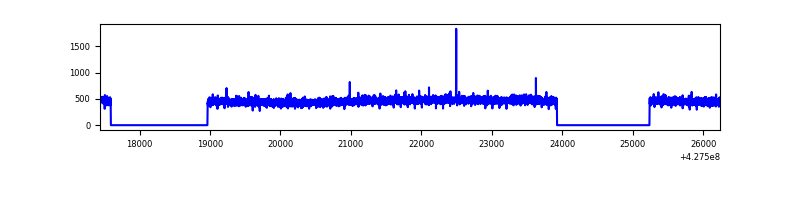 |
| D | 8796 | 6113 | 85 | 85 | 0.97% | 1.39% | 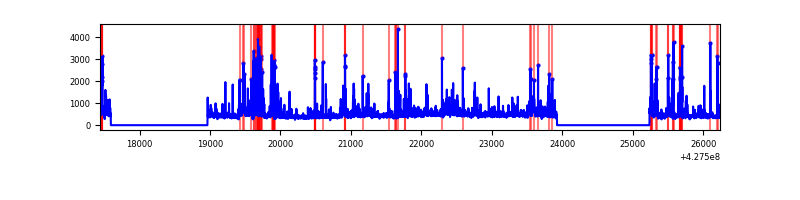 |
Top three noisy pixels from each quadrant. If the there are fewer than three noisy pixels in the level2.evt file, extra rows are filled as -1
| Pixel properties | Quadrant properties | ||||||
|---|---|---|---|---|---|---|---|
| Quadrant | DetID | PixID | Counts | Sigma | Mean | Median | Sigma |
| A | 10 | 83 | 609053 | 4432.86 | 663 | 649 | 137.2 |
| A | 15 | 222 | 206606 | 1500.61 | 663 | 649 | 137.2 |
| A | 13 | 248 | 53864 | 387.73 | 663 | 649 | 137.2 |
| B | 3 | 112 | 30682 | 232.06 | 664 | 644 | 129.4 |
| B | 12 | 111 | 16636 | 123.55 | 664 | 644 | 129.4 |
| B | 11 | 111 | 15157 | 112.12 | 664 | 644 | 129.4 |
| C | 15 | 214 | 254491 | 1674.43 | 647 | 650 | 151.6 |
| C | 7 | 220 | 4969 | 28.49 | 647 | 650 | 151.6 |
| C | 13 | 61 | 4376 | 24.58 | 647 | 650 | 151.6 |
| D | 12 | 6 | 374973 | 2385.09 | 640 | 622 | 157.0 |
| D | 1 | 52 | 233010 | 1480.61 | 640 | 622 | 157.0 |
| D | 2 | 249 | 94771 | 599.85 | 640 | 622 | 157.0 |
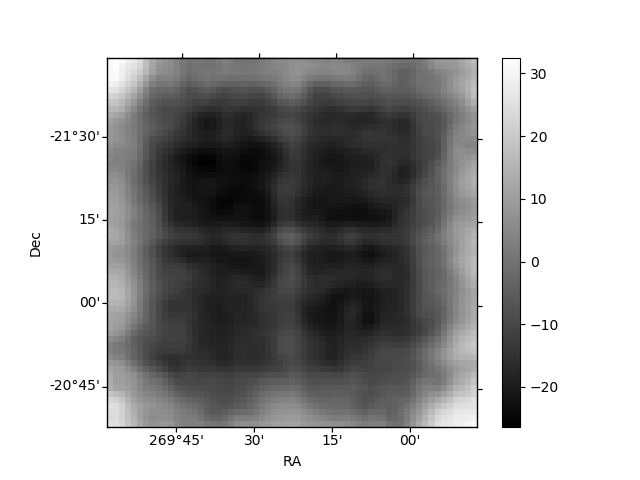
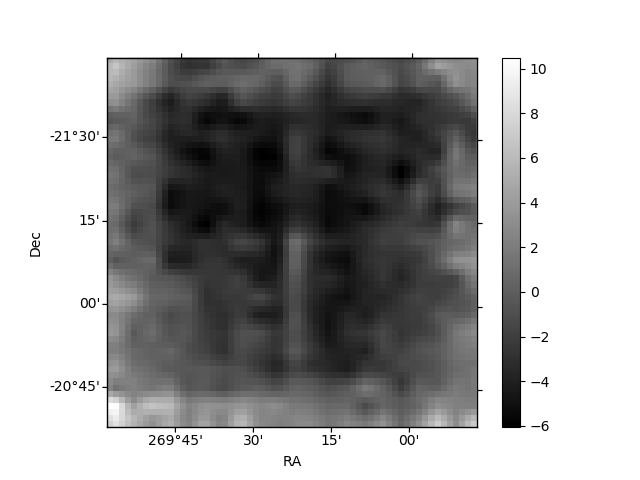
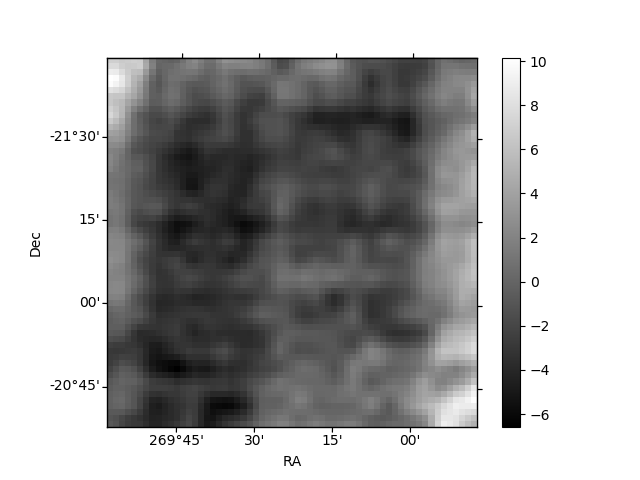
Histogram calculated using DETX and DETY for each event in the final _common_clean file
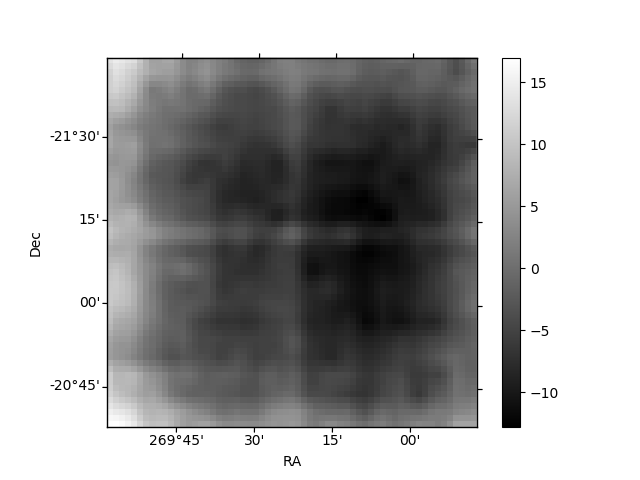
| Quadrant A | 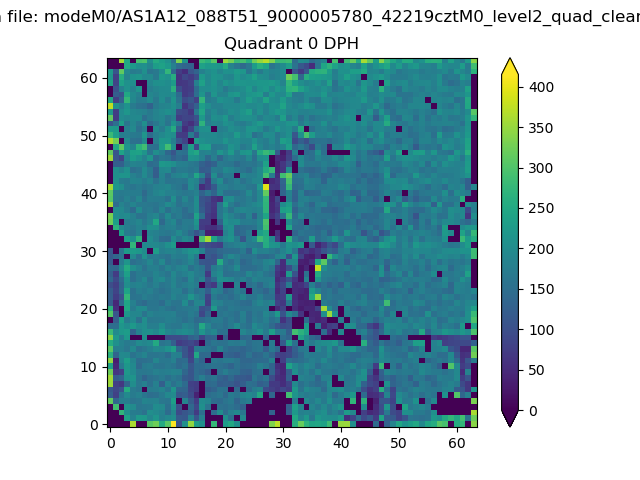 |
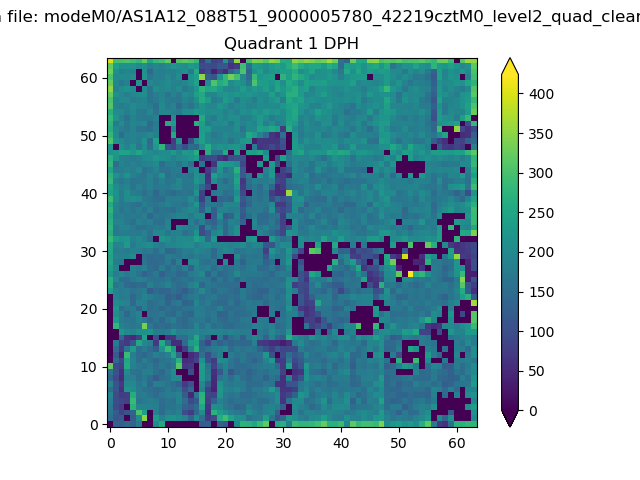 |
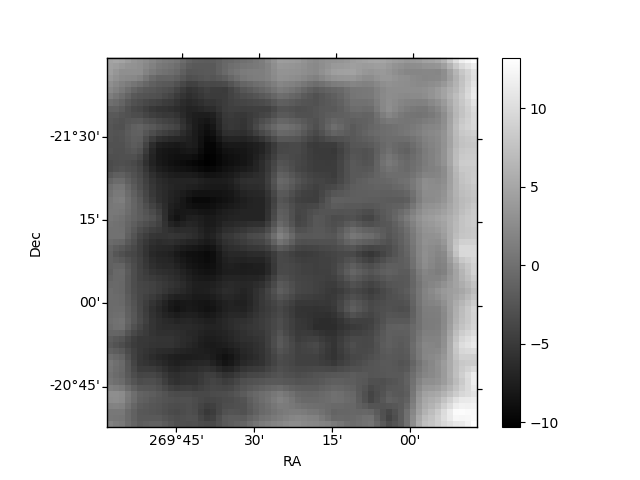
Quadrant B |
|---|---|---|---|
| Quadrant D |  |
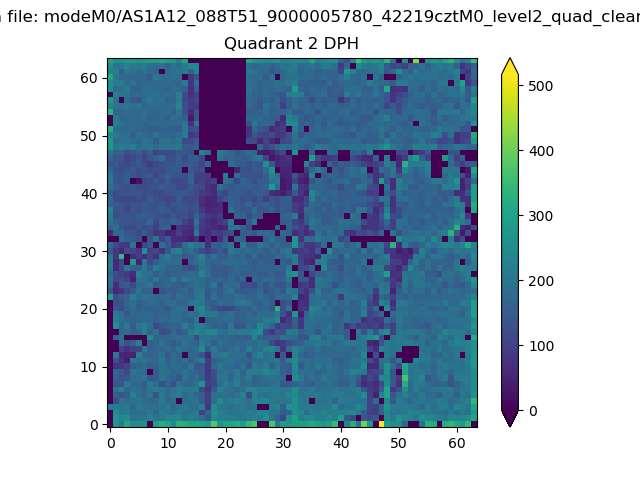 |
Quadrant C |
| Plot type | Count rate plots | Images |
|---|---|---|
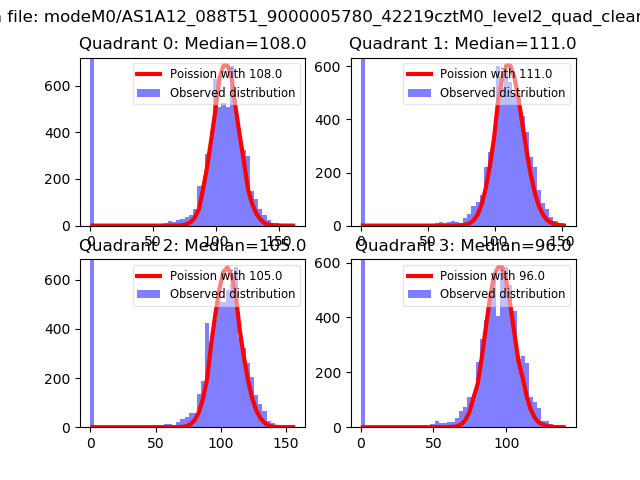
| Comparison with Poisson distribution Blue bars denote a histogram of data divided into 1 sec bins. Red curve is a Poisson curve with rate = median count rate of data. |
 |
 |
| Quadrant-wise count rates Data is divided into 100 sec bins |
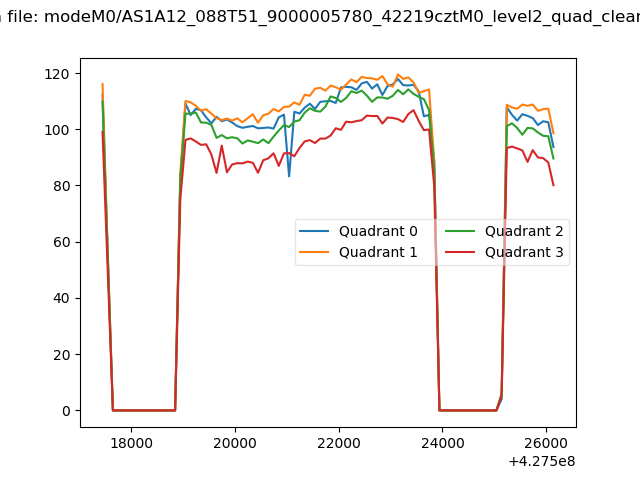 |
|
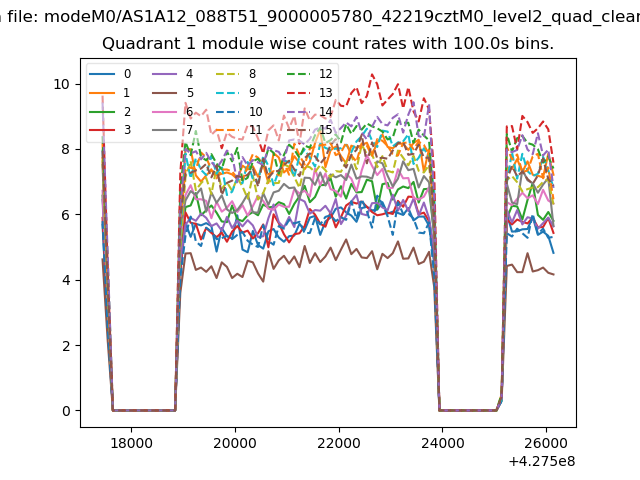
| Module-wise count rates for Quadrant A Data is divided into 100 sec bins |
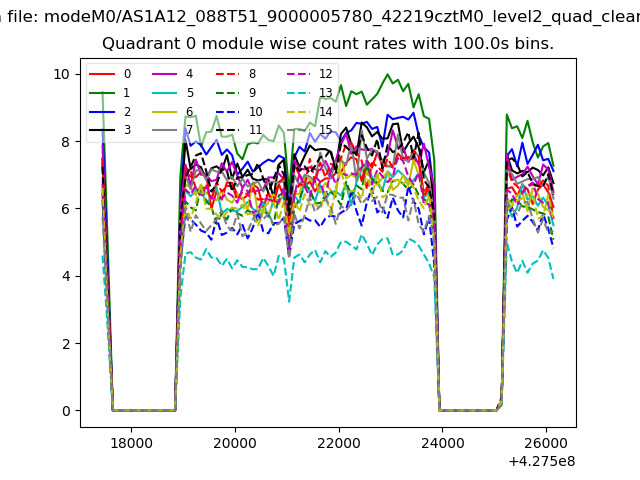 |
 |
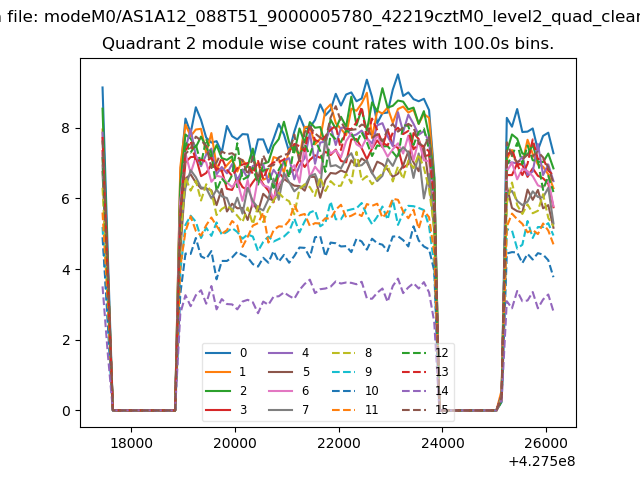
| Module-wise count rates for Quadrant B Data is divided into 100 sec bins |
 |
 |
| Module-wise count rates for Quadrant C Data is divided into 100 sec bins |
 |
 |
| Module-wise count rates for Quadrant D Data is divided into 100 sec bins |
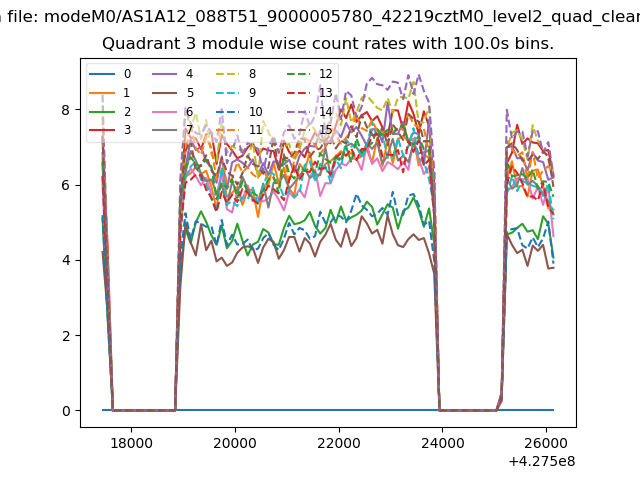 |
 |
| Parameter | Plot |
|---|---|
| CZT HV Monitor |  |
| D_VDD | 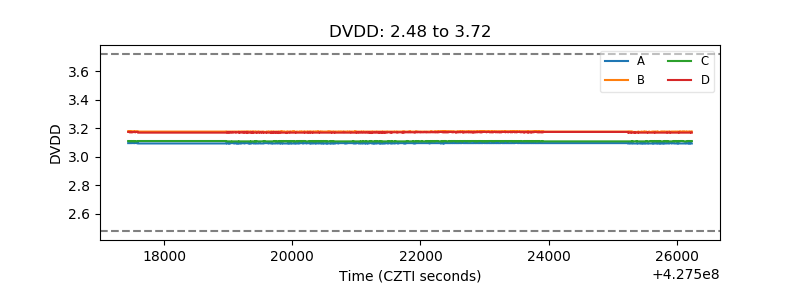 |
| Temperature 1 | 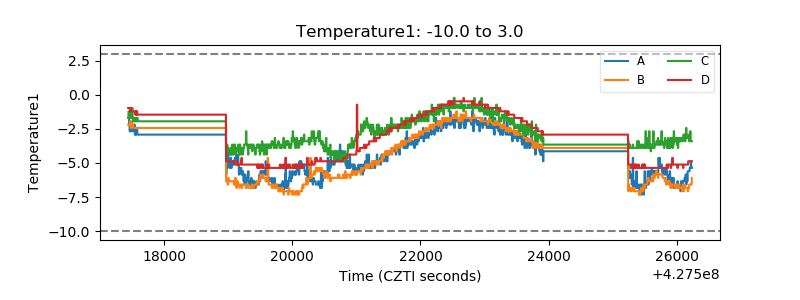 |
| Veto HV Monitor | 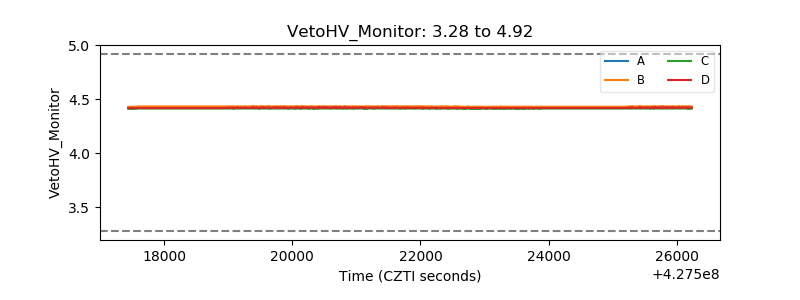 |
| Veto LLD | 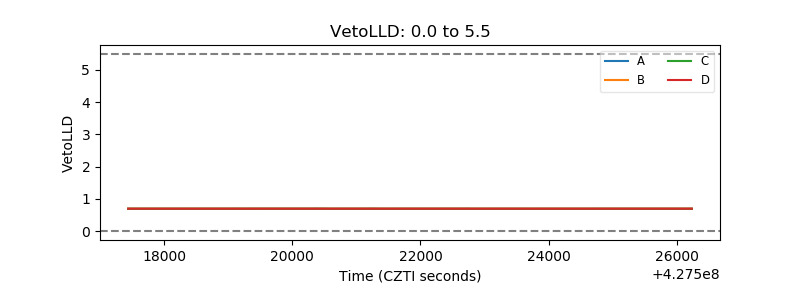 |
| Alpha Counter | 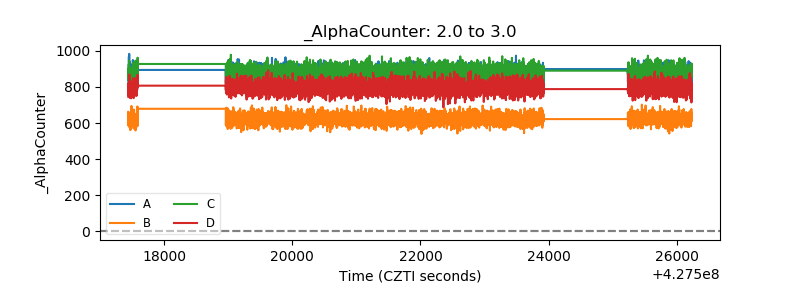 |
| _CPM_Rate |  |
| CZT Counter | 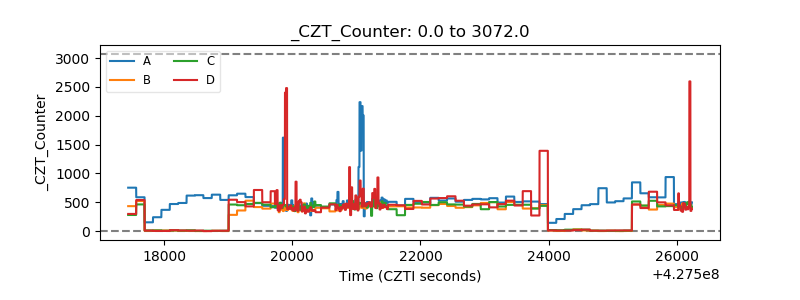 |
| +2.5 Volts monitor |  |
| +5 Volts monitor | 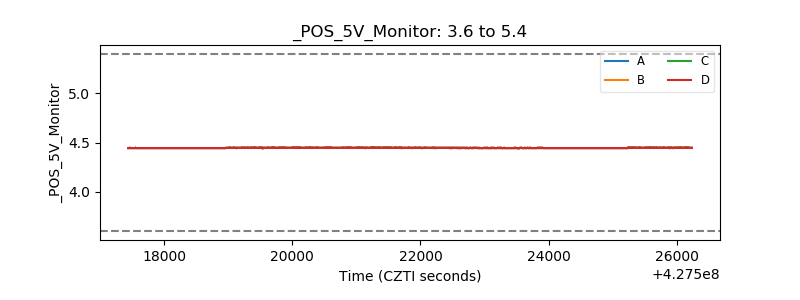 |
| _ROLL_ROT | 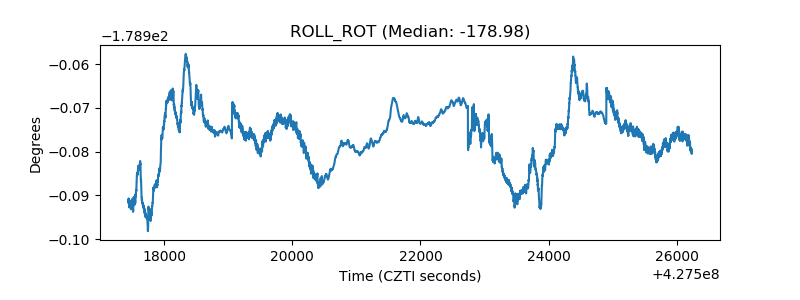 |
| _Roll_DEC | 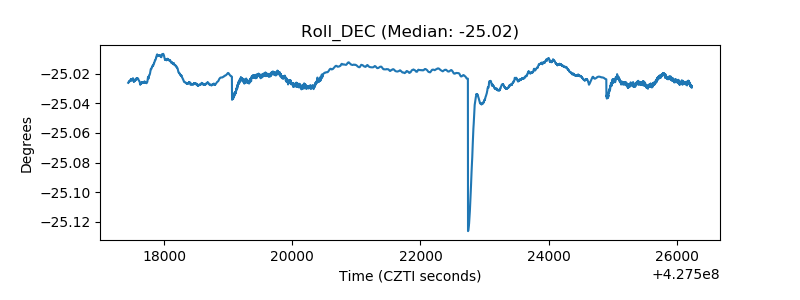 |
| _Roll_RA | 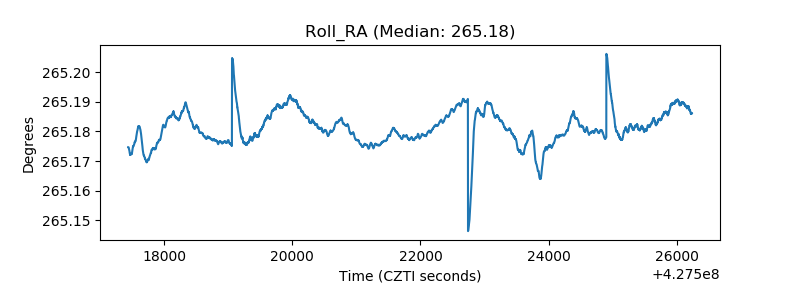 |
| Veto Counter | 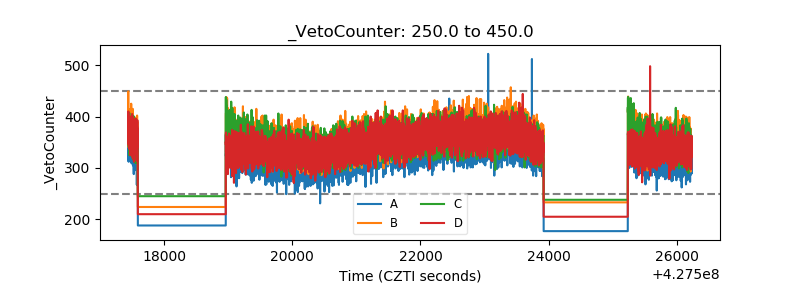 |