| Param | Original file | Final file |
|---|---|---|
| Filename | modeM0/AS1A12_088T52_9000005778_42207cztM0_level2.fits | modeM0/AS1A12_088T52_9000005778_42207cztM0_level2_quad_clean.evt |
| Size (bytes) | 141,140,160 | 36,656,640 |
| Size | 134.6 MB | 35.0 MB |
| Events in quadrant A | 1,251,881 | 245,430 |
| Events in quadrant B | 1,019,410 | 252,972 |
| Events in quadrant C | 1,047,404 | 238,768 |
| Events in quadrant D | 1,731,258 | 212,890 |
| Mode SS | |||
|---|---|---|---|
| Quadrant | BADHDUFLAG | Total packets | Discarded packets |
| A | 0 | 46 | 0 |
| B | 0 | 46 | 0 |
| C | 0 | 46 | 0 |
| D | 0 | 46 | 0 |
| Mode M9 | |||
|---|---|---|---|
| Quadrant | BADHDUFLAG | Total packets | Discarded packets |
| A | 0 | 15 | 0 |
| B | 0 | 15 | 0 |
| C | 0 | 15 | 0 |
| D | 0 | 15 | 0 |
| Mode M0 | |||
|---|---|---|---|
| Quadrant | BADHDUFLAG | Total packets | Discarded packets |
| A | 0 | 4997 | 1 |
| B | 0 | 4502 | 1 |
| C | 0 | 4449 | 1 |
| D | 0 | 6692 | 1 |
| Quadrant | Total seconds | Saturated seconds | Saturation percentage |
|---|---|---|---|
| A | 2214 | 8 | 0.361337% |
| B | 2214 | 9 | 0.406504% |
| C | 2214 | 2 | 0.090334% |
| D | 2214 | 98 | 4.426378% |
Noise dominated data is calculated using 1-second bins in cleaned event files. If a bin has >2000 counts, and if more than 50% of those come from <1% of pixels, then it is considered to be noise-dominated and hence unusable.
| Quadrant | # 1 sec bins | Bins with >0 counts | Bins with >2000 counts | High rate bins dominated by noise | Noise dominated (total time) | Noise dominated (detector-on time) | Marked lightcurve |
|---|---|---|---|---|---|---|---|
| A | 3677 | 2215 | 3 | 3 | 0.08% | 0.14% | 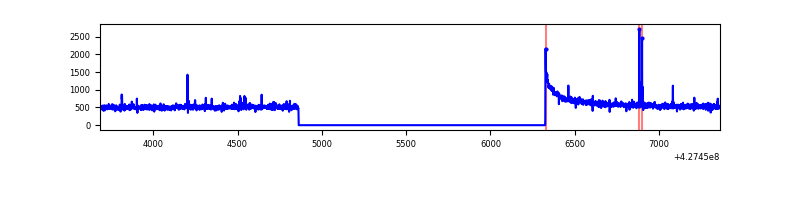 |
| B | 3677 | 2215 | 1 | 1 | 0.03% | 0.05% | 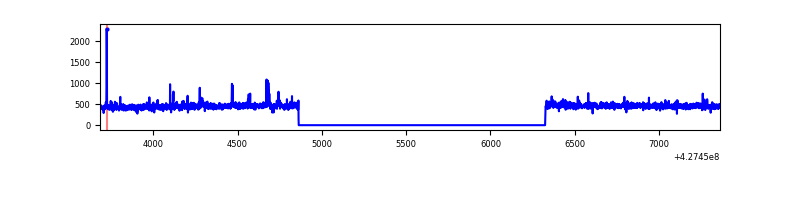 |
| C | 3677 | 2215 | 0 | 0 | 0.00% | 0.00% | 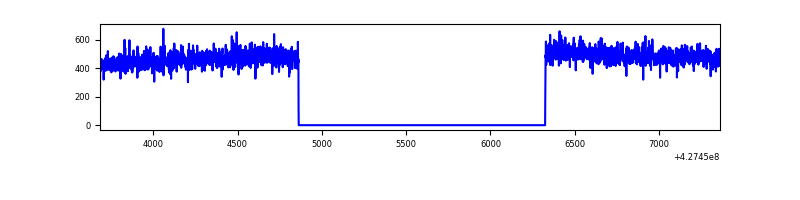 |
| D | 3677 | 2215 | 86 | 86 | 2.34% | 3.88% | 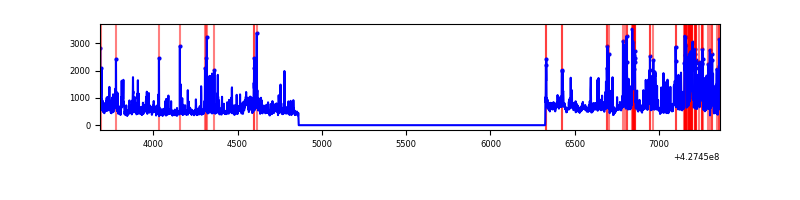 |
Top three noisy pixels from each quadrant. If the there are fewer than three noisy pixels in the level2.evt file, extra rows are filled as -1
| Pixel properties | Quadrant properties | ||||||
|---|---|---|---|---|---|---|---|
| Quadrant | DetID | PixID | Counts | Sigma | Mean | Median | Sigma |
| A | 10 | 83 | 244133 | 4547.72 | 250 | 245 | 53.6 |
| A | 15 | 223 | 14251 | 261.17 | 250 | 245 | 53.6 |
| A | 15 | 222 | 14121 | 258.74 | 250 | 245 | 53.6 |
| B | 0 | 229 | 23029 | 449.97 | 250 | 244 | 50.6 |
| B | 15 | 35 | 11215 | 216.66 | 250 | 244 | 50.6 |
| B | 12 | 111 | 6373 | 121.04 | 250 | 244 | 50.6 |
| C | 15 | 214 | 94324 | 1595.86 | 244 | 245 | 59.0 |
| C | 13 | 61 | 1627 | 23.44 | 244 | 245 | 59.0 |
| C | 0 | 207 | 999 | 12.79 | 244 | 245 | 59.0 |
| D | 1 | 52 | 460779 | 7466.8 | 238 | 229 | 61.7 |
| D | 2 | 249 | 131458 | 2127.59 | 238 | 229 | 61.7 |
| D | 5 | 70 | 130381 | 2110.13 | 238 | 229 | 61.7 |
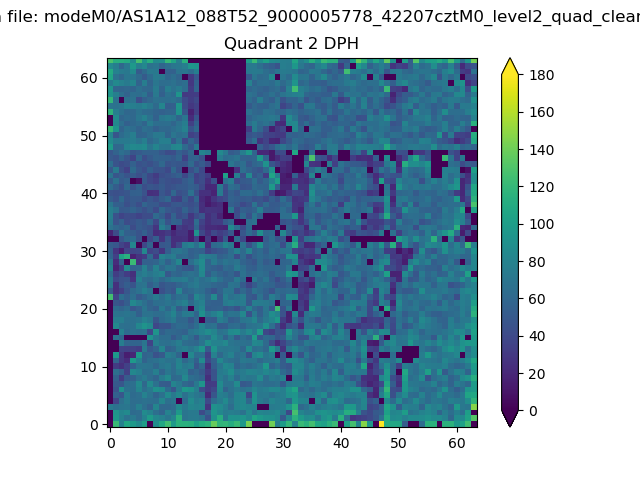
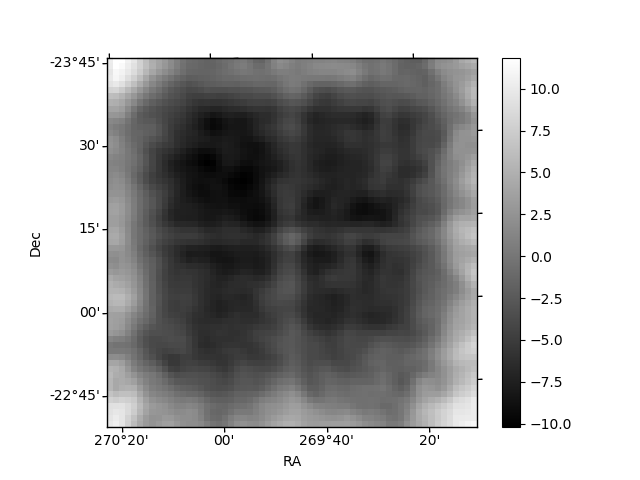
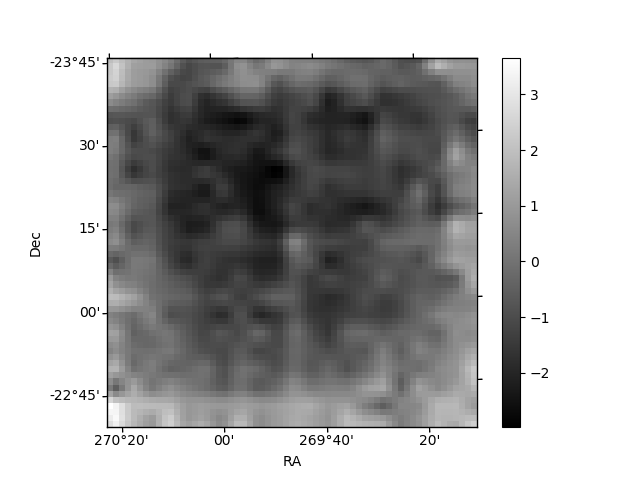
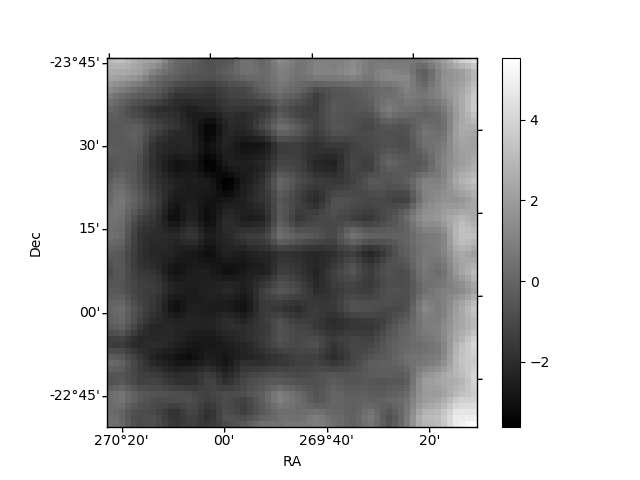
Histogram calculated using DETX and DETY for each event in the final _common_clean file
| Quadrant A | 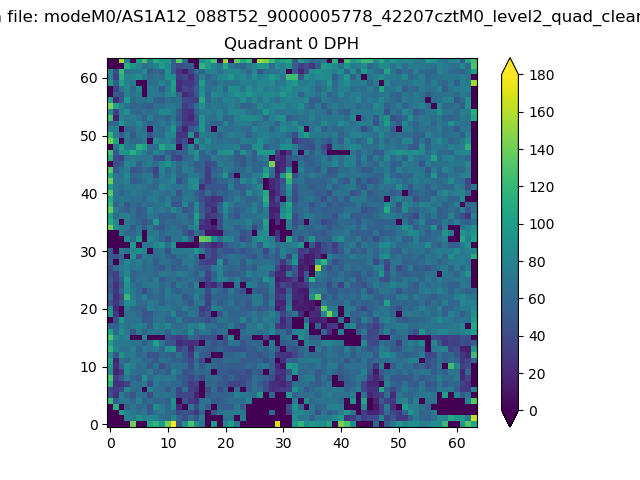 |
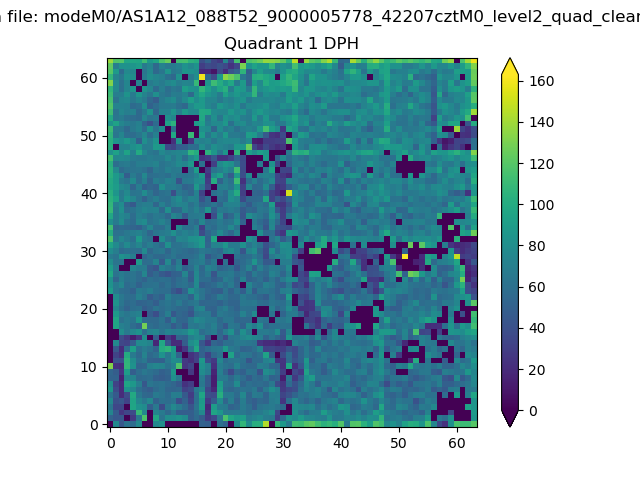 |
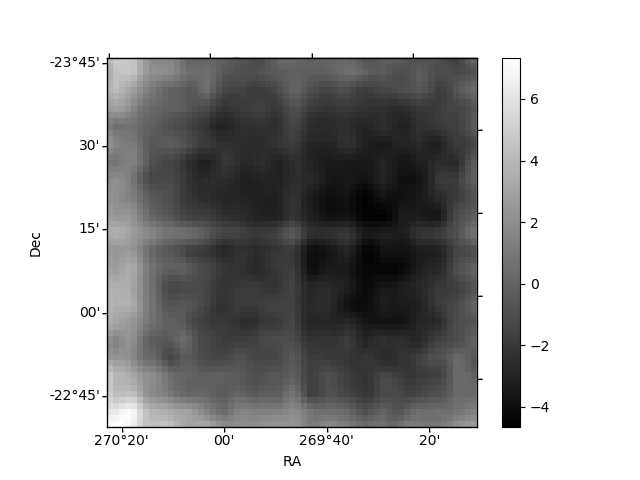
Quadrant B |
|---|---|---|---|
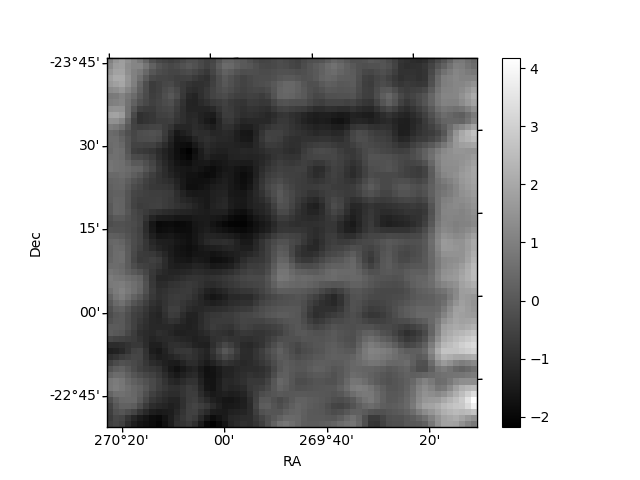
| Quadrant D | 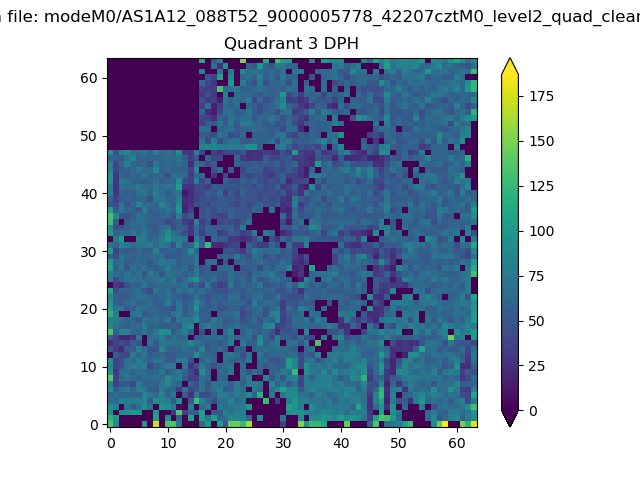 |
 |
Quadrant C |
| Plot type | Count rate plots | Images |
|---|---|---|
| Comparison with Poisson distribution Blue bars denote a histogram of data divided into 1 sec bins. Red curve is a Poisson curve with rate = median count rate of data. |
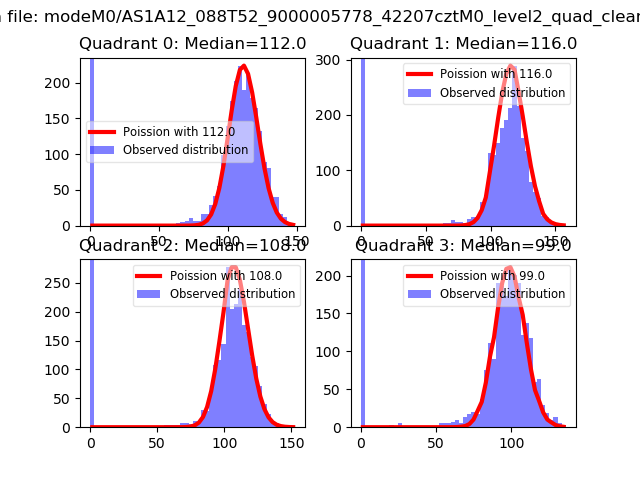 |
 |
| Quadrant-wise count rates Data is divided into 100 sec bins |
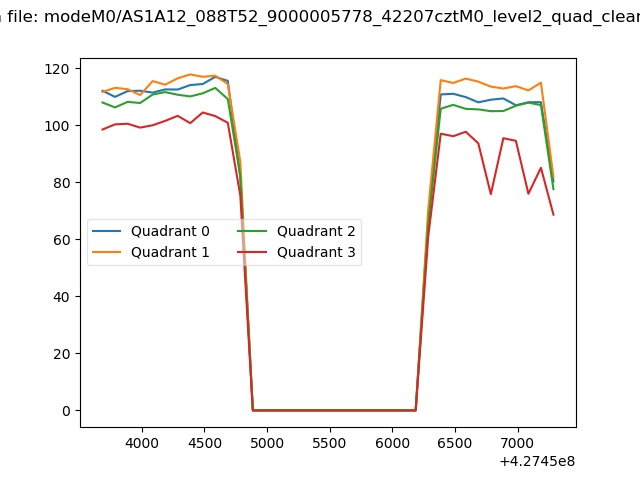 |
|
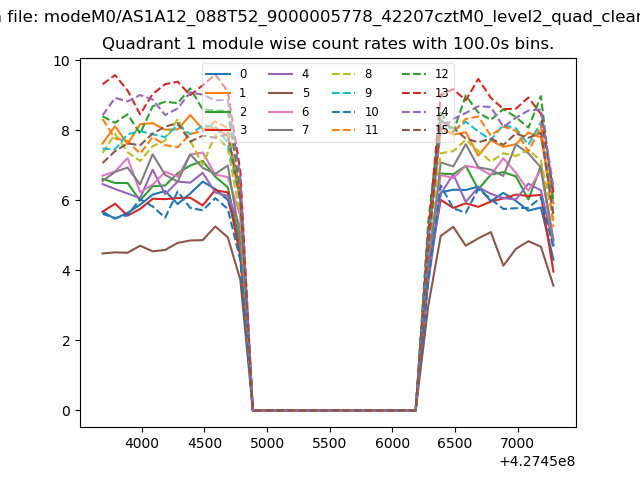
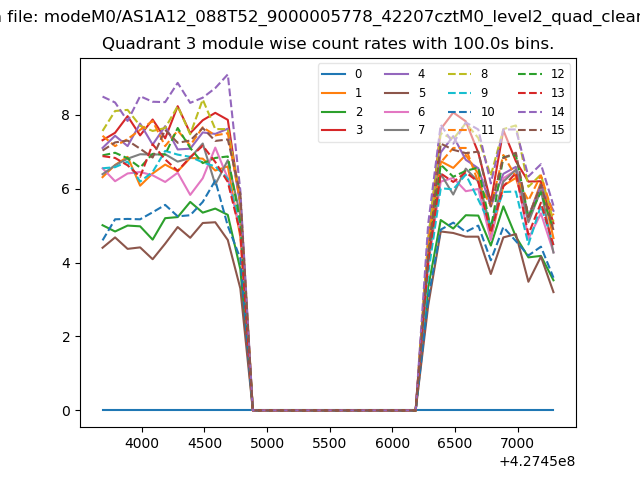
| Module-wise count rates for Quadrant A Data is divided into 100 sec bins |
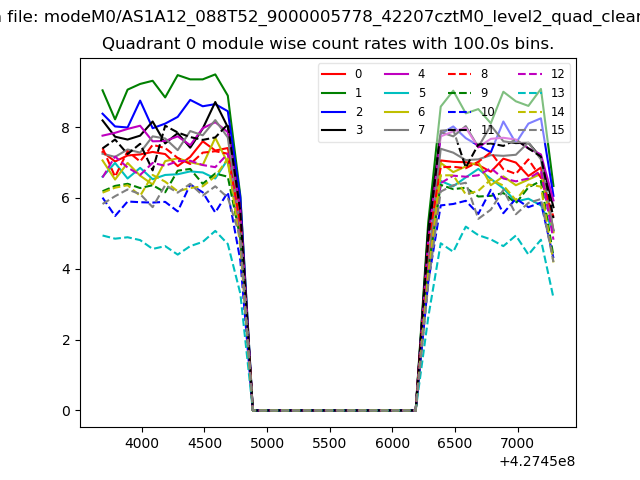 |
 |
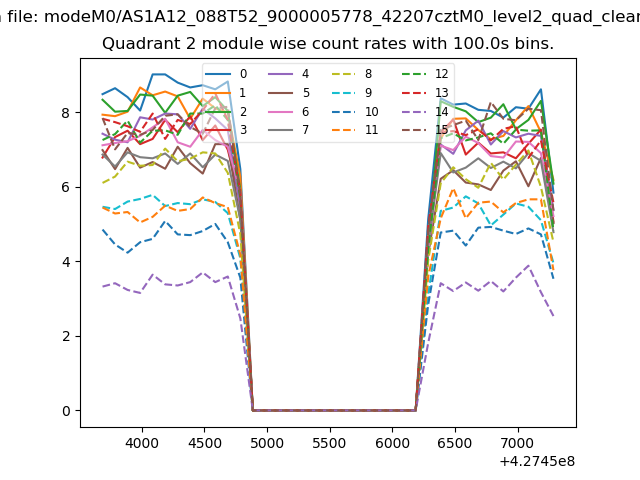
| Module-wise count rates for Quadrant B Data is divided into 100 sec bins |
 |
 |
| Module-wise count rates for Quadrant C Data is divided into 100 sec bins |
 |
 |
| Module-wise count rates for Quadrant D Data is divided into 100 sec bins |
 |
 |
| Parameter | Plot |
|---|---|
| CZT HV Monitor | 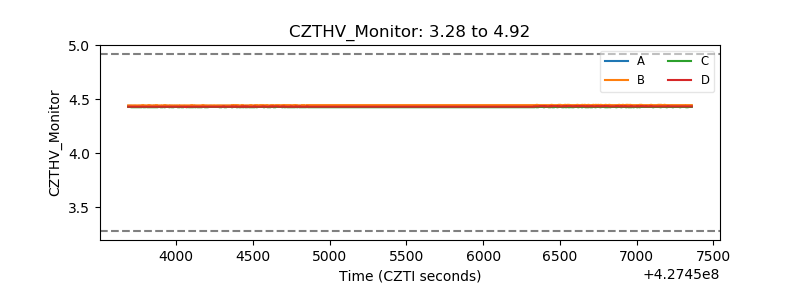 |
| D_VDD | 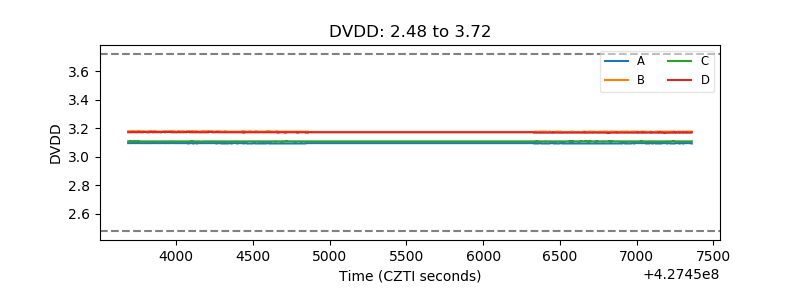 |
| Temperature 1 | 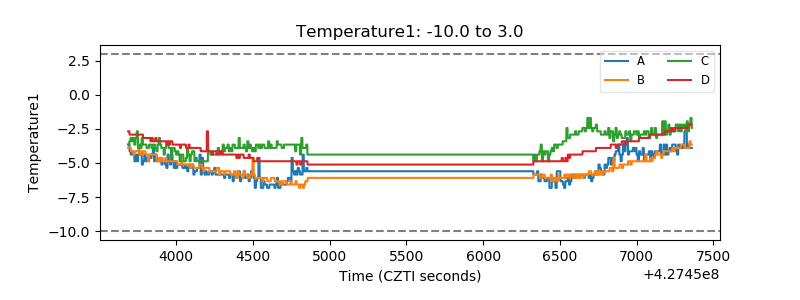 |
| Veto HV Monitor | 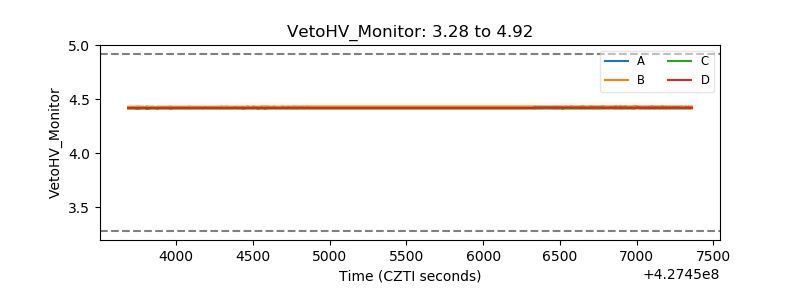 |
| Veto LLD | 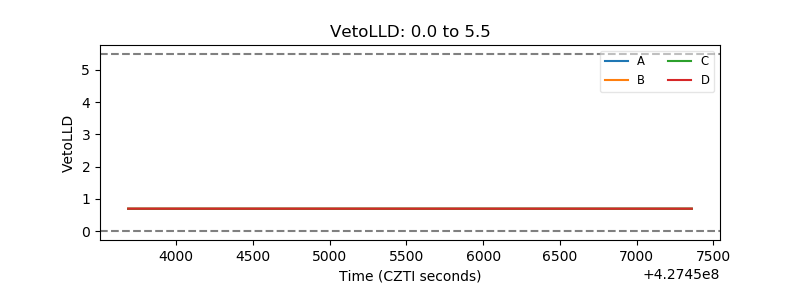 |
| Alpha Counter |  |
| _CPM_Rate |  |
| CZT Counter | 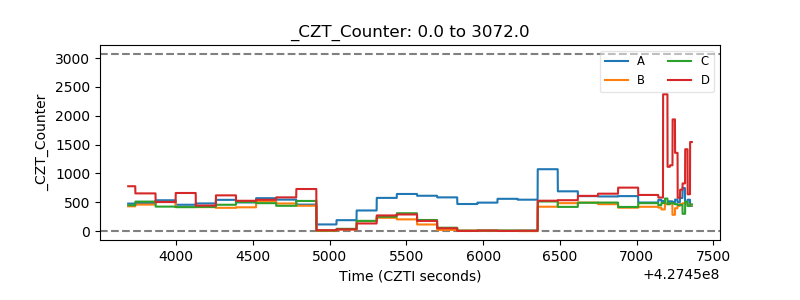 |
| +2.5 Volts monitor | 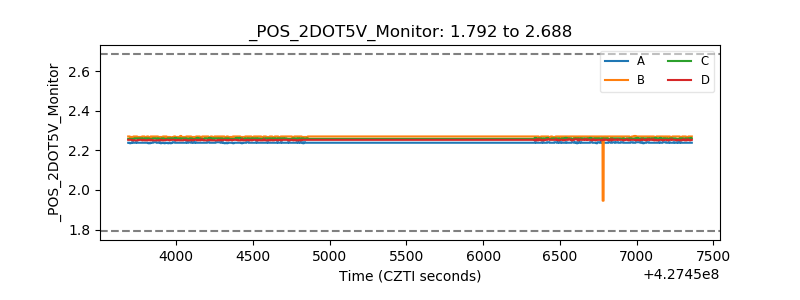 |
| +5 Volts monitor |  |
| _ROLL_ROT | 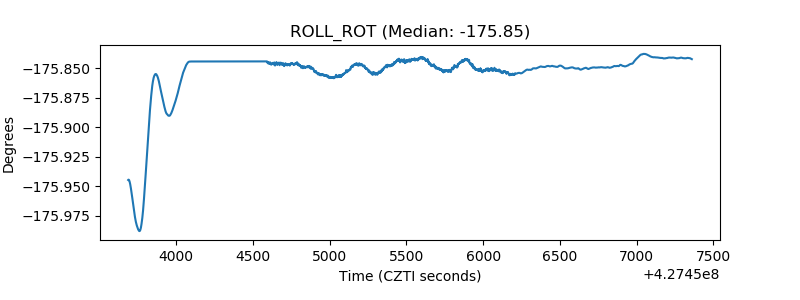 |
| _Roll_DEC | 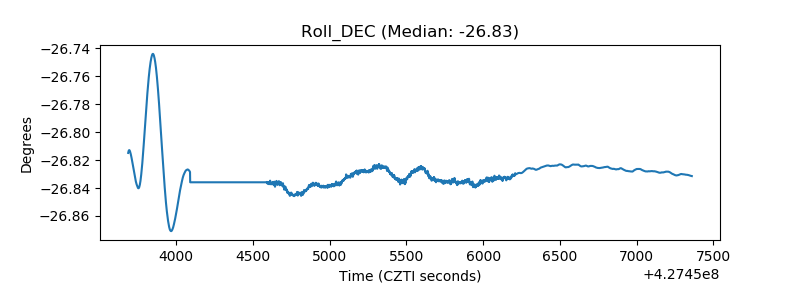 |
| _Roll_RA | 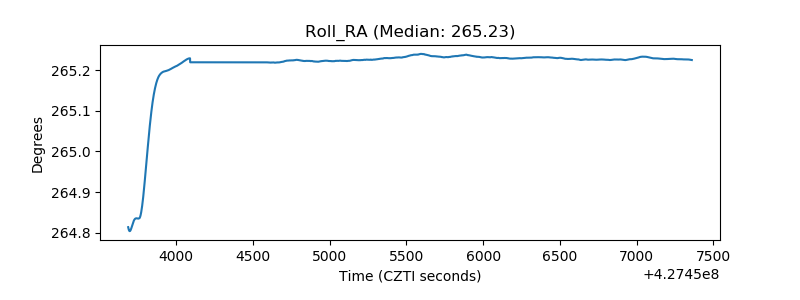 |
| Veto Counter | 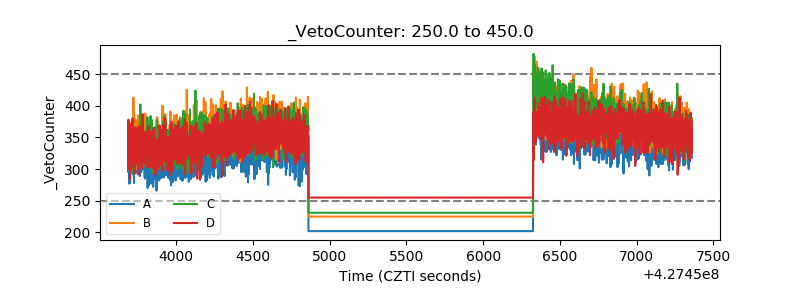 |