| Param | Original file | Final file |
|---|---|---|
| Filename | modeM0/AS1A12_088T52_9000005778_42208cztM0_level2.fits | modeM0/AS1A12_088T52_9000005778_42208cztM0_level2_quad_clean.evt |
| Size (bytes) | 406,647,360 | 90,414,720 |
| Size | 387.8 MB | 86.2 MB |
| Events in quadrant A | 3,450,539 | 618,233 |
| Events in quadrant B | 2,764,622 | 630,597 |
| Events in quadrant C | 2,653,638 | 607,690 |
| Events in quadrant D | 5,747,027 | 487,807 |
| Mode SS | |||
|---|---|---|---|
| Quadrant | BADHDUFLAG | Total packets | Discarded packets |
| A | 0 | 116 | 0 |
| B | 0 | 116 | 0 |
| C | 0 | 116 | 0 |
| D | 0 | 116 | 0 |
| Mode M9 | |||
|---|---|---|---|
| Quadrant | BADHDUFLAG | Total packets | Discarded packets |
| A | 0 | 28 | 0 |
| B | 0 | 29 | 0 |
| C | 0 | 29 | 0 |
| D | 0 | 29 | 0 |
| Mode M0 | |||
|---|---|---|---|
| Quadrant | BADHDUFLAG | Total packets | Discarded packets |
| A | 0 | 13657 | 2 |
| B | 0 | 12008 | 2 |
| C | 0 | 11416 | 2 |
| D | 0 | 21005 | 2 |
| Quadrant | Total seconds | Saturated seconds | Saturation percentage |
|---|---|---|---|
| A | 5618 | 26 | 0.462798% |
| B | 5618 | 87 | 1.548594% |
| C | 5618 | 12 | 0.213599% |
| D | 5618 | 822 | 14.631541% |
Noise dominated data is calculated using 1-second bins in cleaned event files. If a bin has >2000 counts, and if more than 50% of those come from <1% of pixels, then it is considered to be noise-dominated and hence unusable.
| Quadrant | # 1 sec bins | Bins with >0 counts | Bins with >2000 counts | High rate bins dominated by noise | Noise dominated (total time) | Noise dominated (detector-on time) | Marked lightcurve |
|---|---|---|---|---|---|---|---|
| A | 7201 | 5619 | 17 | 17 | 0.24% | 0.30% |  |
| B | 7201 | 5619 | 70 | 70 | 0.97% | 1.25% |  |
| C | 7201 | 5619 | 8 | 8 | 0.11% | 0.14% |  |
| D | 7201 | 5619 | 762 | 762 | 10.58% | 13.56% |  |
Top three noisy pixels from each quadrant. If the there are fewer than three noisy pixels in the level2.evt file, extra rows are filled as -1
| Pixel properties | Quadrant properties | ||||||
|---|---|---|---|---|---|---|---|
| Quadrant | DetID | PixID | Counts | Sigma | Mean | Median | Sigma |
| A | 10 | 83 | 578886 | 4450.86 | 627 | 612 | 129.9 |
| A | 15 | 223 | 321426 | 2469.24 | 627 | 612 | 129.9 |
| A | 15 | 222 | 96895 | 741.07 | 627 | 612 | 129.9 |
| B | 7 | 202 | 173058 | 1428.61 | 618 | 603 | 120.7 |
| B | 0 | 229 | 76628 | 629.79 | 618 | 603 | 120.7 |
| B | 3 | 112 | 31090 | 252.55 | 618 | 603 | 120.7 |
| C | 15 | 214 | 237618 | 1648.85 | 609 | 613 | 143.7 |
| C | 7 | 220 | 42585 | 292.0 | 609 | 613 | 143.7 |
| C | 13 | 61 | 4037 | 23.82 | 609 | 613 | 143.7 |
| D | 1 | 52 | 1886338 | 13277.08 | 577 | 560 | 142.0 |
| D | 2 | 249 | 1114522 | 7843.0 | 577 | 560 | 142.0 |
| D | 5 | 70 | 173716 | 1219.13 | 577 | 560 | 142.0 |
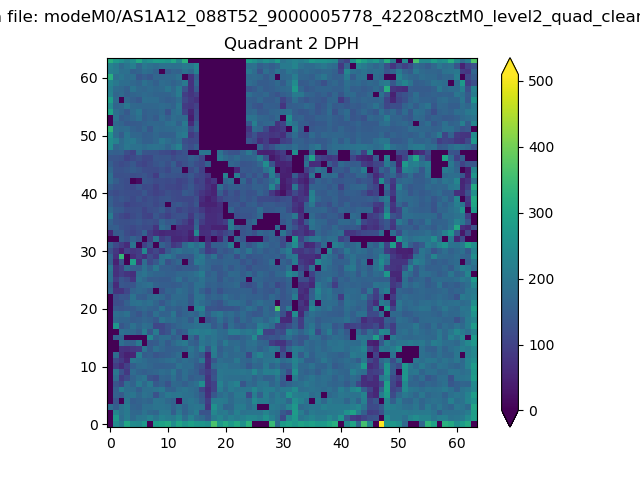
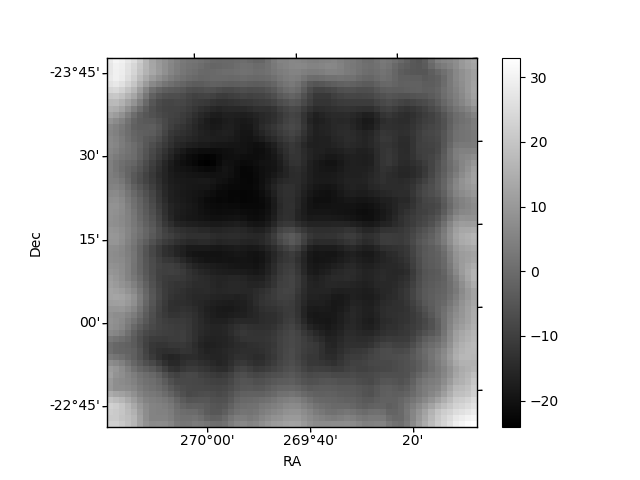
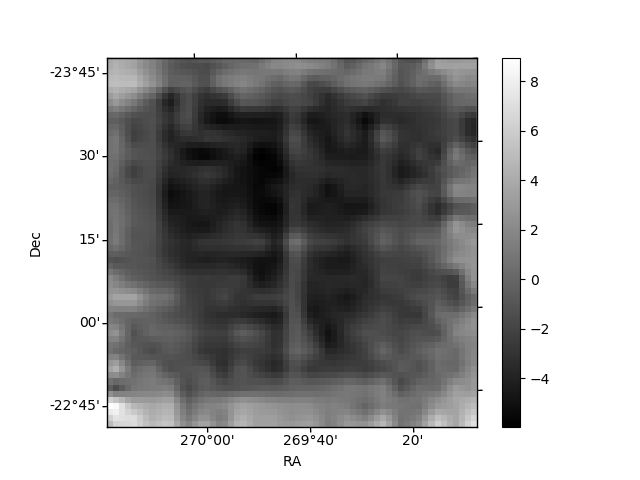
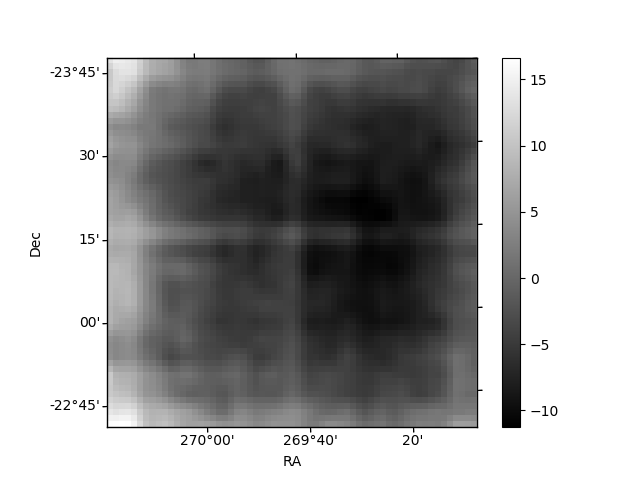
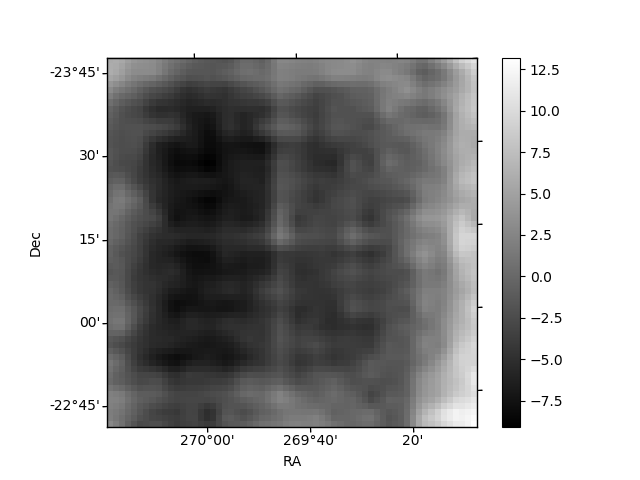
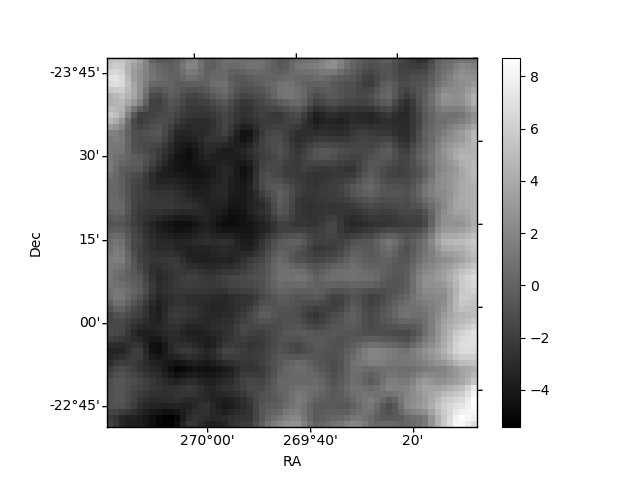
Histogram calculated using DETX and DETY for each event in the final _common_clean file
| Quadrant A | 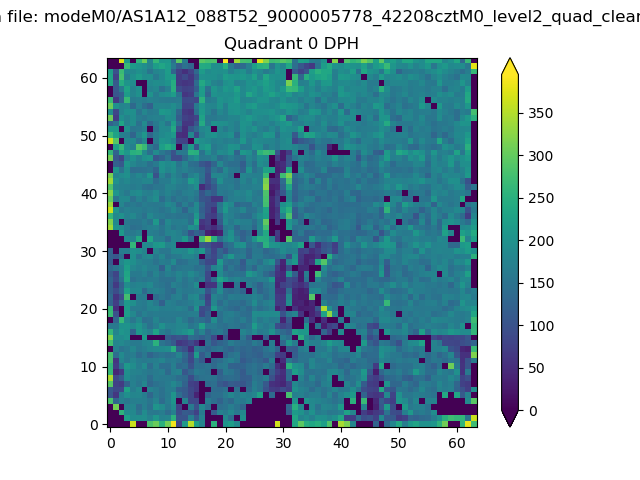 |
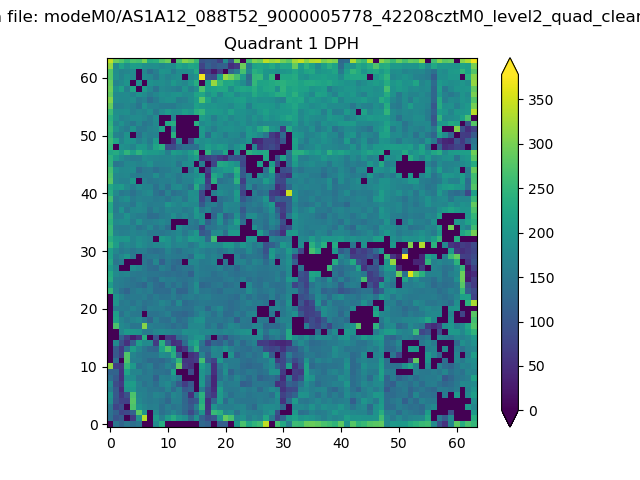 |
Quadrant B |
|---|---|---|---|
| Quadrant D | 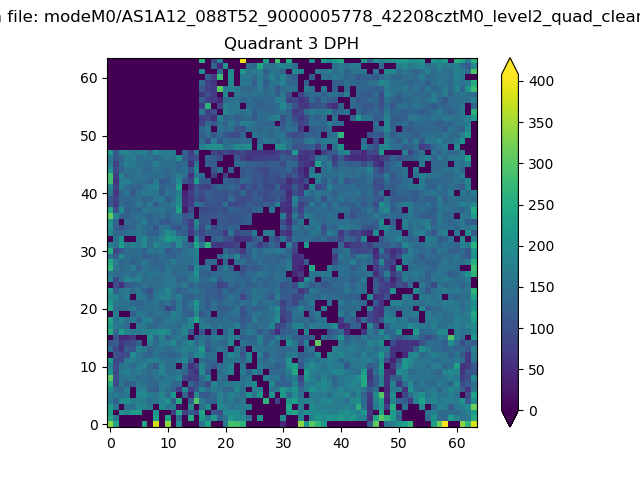 |
 |
Quadrant C |
| Plot type | Count rate plots | Images |
|---|---|---|
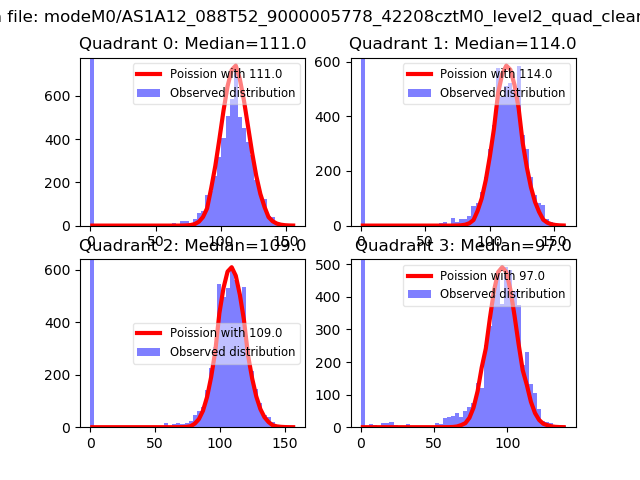
| Comparison with Poisson distribution Blue bars denote a histogram of data divided into 1 sec bins. Red curve is a Poisson curve with rate = median count rate of data. |
 |
 |
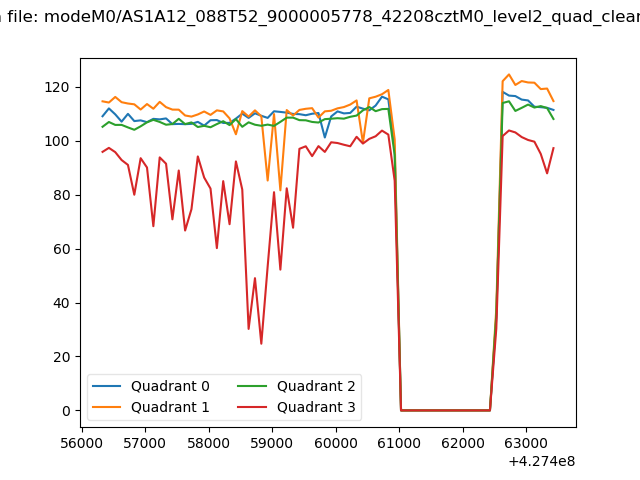
| Quadrant-wise count rates Data is divided into 100 sec bins |
 |
|
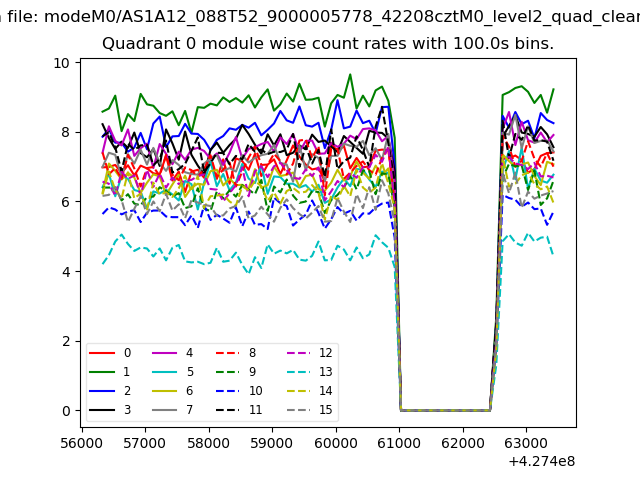
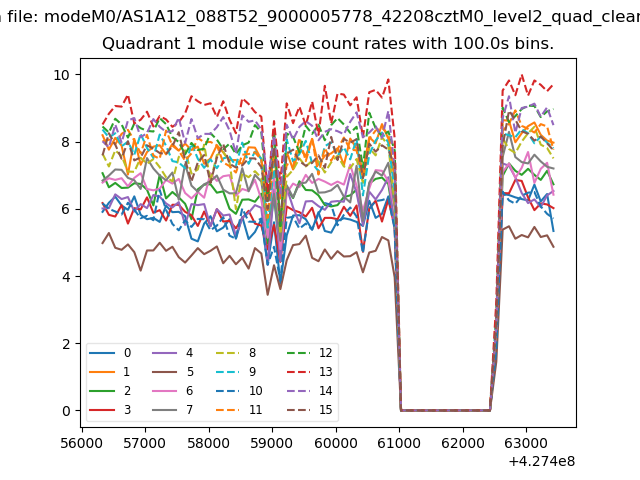
| Module-wise count rates for Quadrant A Data is divided into 100 sec bins |
 |
 |
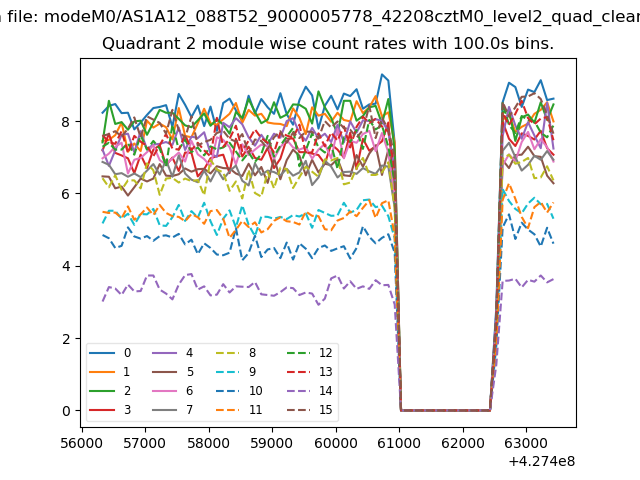
| Module-wise count rates for Quadrant B Data is divided into 100 sec bins |
 |
 |
| Module-wise count rates for Quadrant C Data is divided into 100 sec bins |
 |
 |
| Module-wise count rates for Quadrant D Data is divided into 100 sec bins |
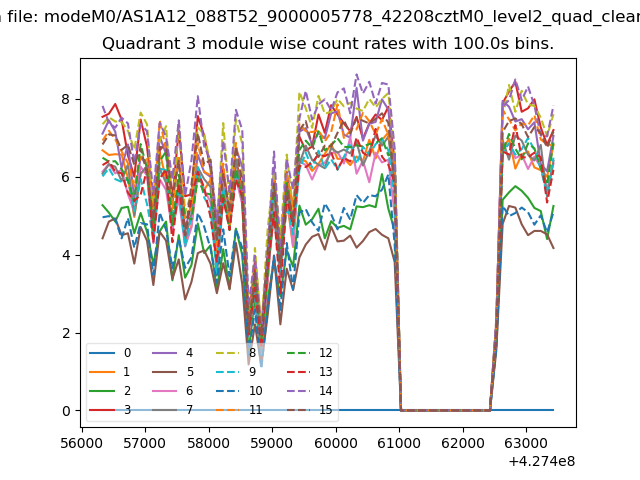 |
 |
| Parameter | Plot |
|---|---|
| CZT HV Monitor | 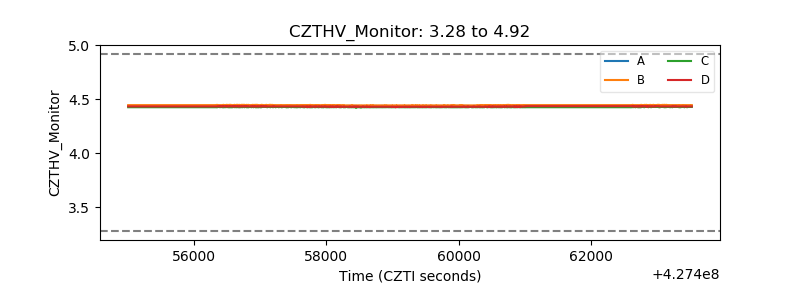 |
| D_VDD | 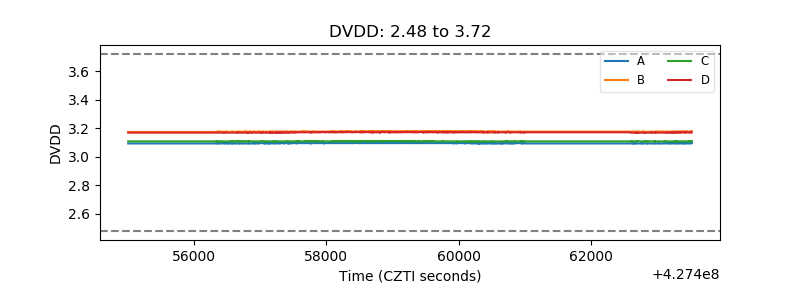 |
| Temperature 1 | 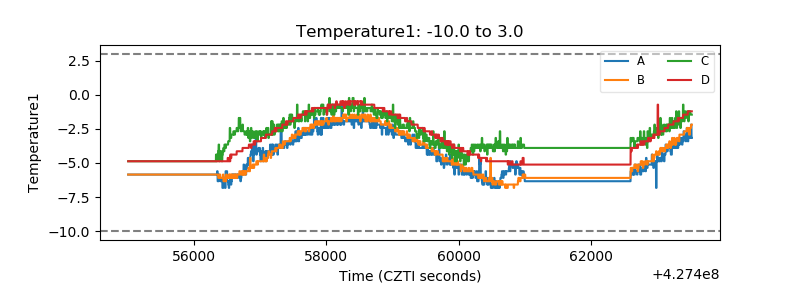 |
| Veto HV Monitor | 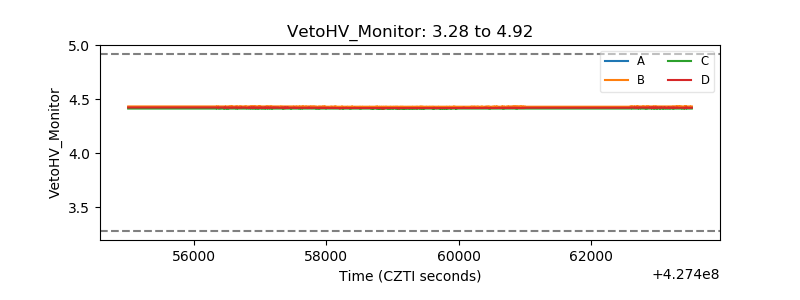 |
| Veto LLD | 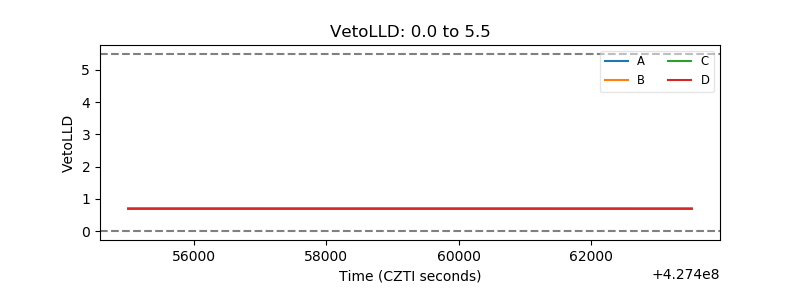 |
| Alpha Counter |  |
| _CPM_Rate |  |
| CZT Counter | 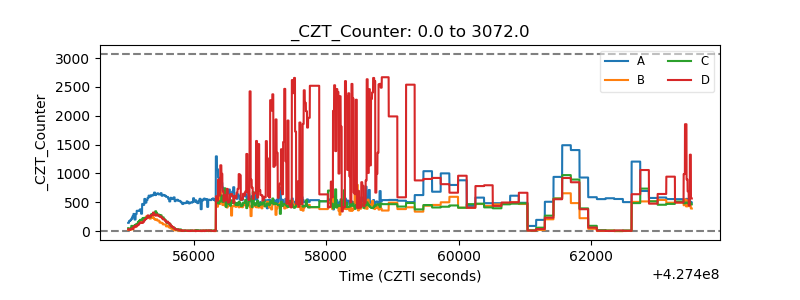 |
| +2.5 Volts monitor | 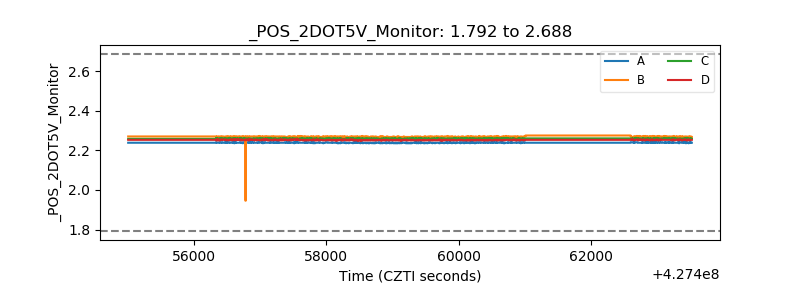 |
| +5 Volts monitor |  |
| _ROLL_ROT | 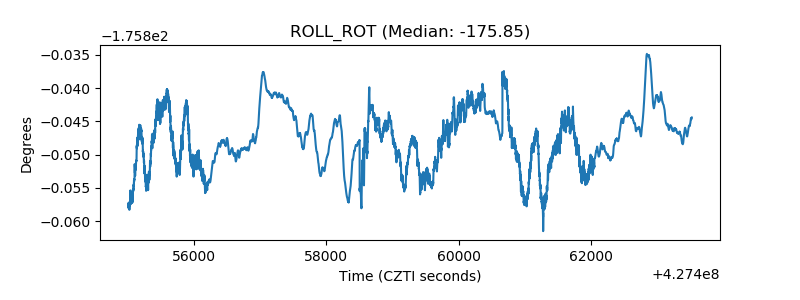 |
| _Roll_DEC | 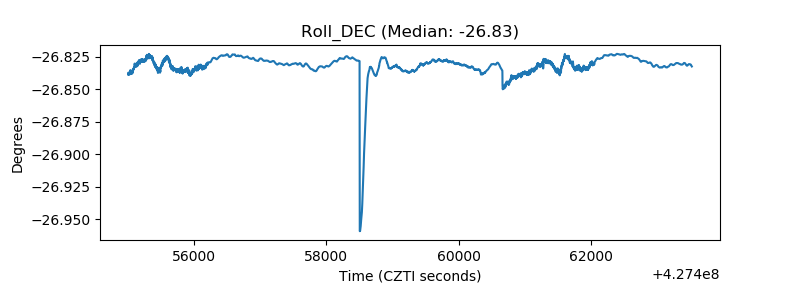 |
| _Roll_RA | 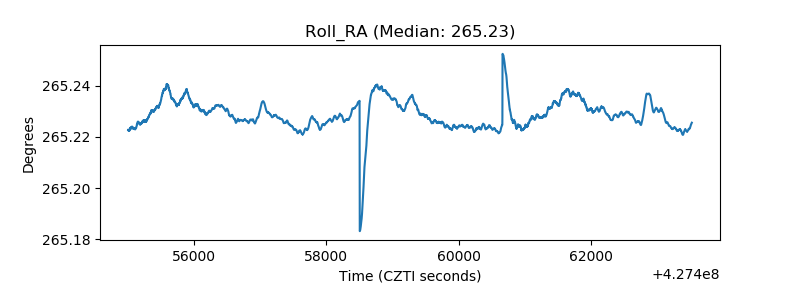 |
| Veto Counter | 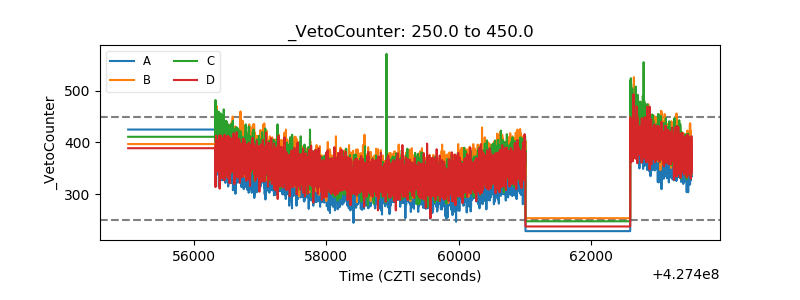 |