| Param | Original file | Final file |
|---|---|---|
| Filename | modeM0/AS1A12_088T52_9000005778_42209cztM0_level2.fits | modeM0/AS1A12_088T52_9000005778_42209cztM0_level2_quad_clean.evt |
| Size (bytes) | 377,089,920 | 91,275,840 |
| Size | 359.6 MB | 87.0 MB |
| Events in quadrant A | 3,114,772 | 620,560 |
| Events in quadrant B | 3,407,402 | 600,384 |
| Events in quadrant C | 2,571,182 | 610,330 |
| Events in quadrant D | 4,439,326 | 549,163 |
| Mode SS | |||
|---|---|---|---|
| Quadrant | BADHDUFLAG | Total packets | Discarded packets |
| A | 0 | 112 | 0 |
| B | 0 | 112 | 0 |
| C | 0 | 112 | 0 |
| D | 0 | 112 | 0 |
| Mode M9 | |||
|---|---|---|---|
| Quadrant | BADHDUFLAG | Total packets | Discarded packets |
| A | 0 | 27 | 0 |
| B | 0 | 27 | 0 |
| C | 0 | 28 | 0 |
| D | 0 | 28 | 0 |
| Mode M0 | |||
|---|---|---|---|
| Quadrant | BADHDUFLAG | Total packets | Discarded packets |
| A | 0 | 12550 | 2 |
| B | 0 | 13754 | 2 |
| C | 0 | 11064 | 3 |
| D | 0 | 16949 | 2 |
| Quadrant | Total seconds | Saturated seconds | Saturation percentage |
|---|---|---|---|
| A | 5475 | 47 | 0.858447% |
| B | 5475 | 360 | 6.575342% |
| C | 5474 | 3 | 0.054805% |
| D | 5474 | 135 | 2.466204% |
Noise dominated data is calculated using 1-second bins in cleaned event files. If a bin has >2000 counts, and if more than 50% of those come from <1% of pixels, then it is considered to be noise-dominated and hence unusable.
| Quadrant | # 1 sec bins | Bins with >0 counts | Bins with >2000 counts | High rate bins dominated by noise | Noise dominated (total time) | Noise dominated (detector-on time) | Marked lightcurve |
|---|---|---|---|---|---|---|---|
| A | 7178 | 5476 | 32 | 32 | 0.45% | 0.58% | 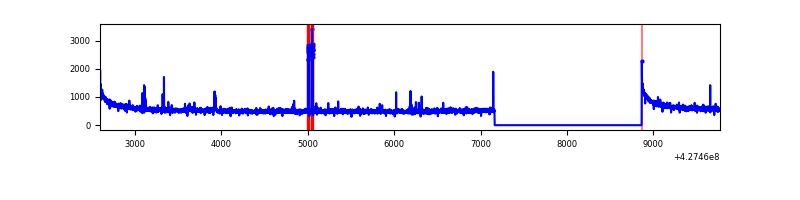 |
| B | 7178 | 5476 | 330 | 330 | 4.60% | 6.03% | 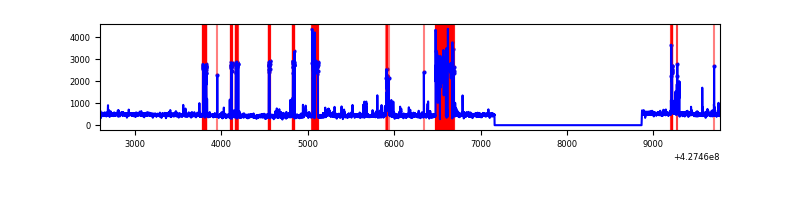 |
| C | 7177 | 5475 | 0 | 0 | 0.00% | 0.00% | 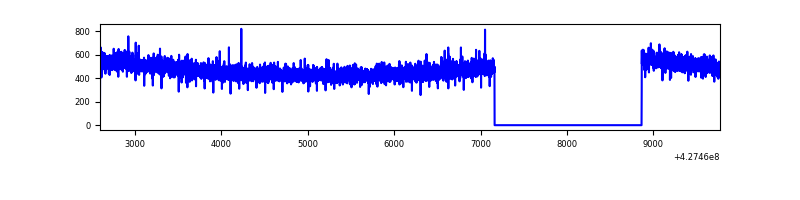 |
| D | 7177 | 5475 | 153 | 153 | 2.13% | 2.79% | 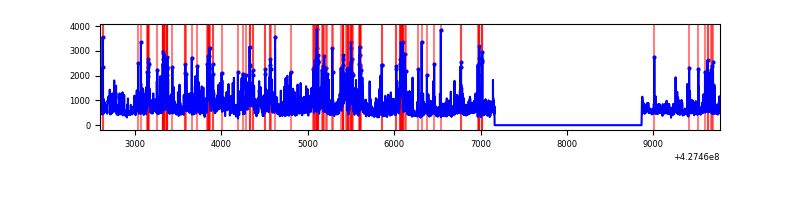 |
Top three noisy pixels from each quadrant. If the there are fewer than three noisy pixels in the level2.evt file, extra rows are filled as -1
| Pixel properties | Quadrant properties | ||||||
|---|---|---|---|---|---|---|---|
| Quadrant | DetID | PixID | Counts | Sigma | Mean | Median | Sigma |
| A | 10 | 83 | 575042 | 4462.04 | 621 | 607 | 128.7 |
| A | 15 | 222 | 95610 | 737.96 | 621 | 607 | 128.7 |
| A | 13 | 248 | 23983 | 181.58 | 621 | 607 | 128.7 |
| B | 7 | 202 | 804137 | 7014.28 | 593 | 578 | 114.6 |
| B | 0 | 229 | 95206 | 826.01 | 593 | 578 | 114.6 |
| B | 0 | 245 | 81408 | 705.56 | 593 | 578 | 114.6 |
| C | 15 | 214 | 231368 | 1634.6 | 600 | 604 | 141.2 |
| C | 13 | 61 | 3927 | 23.54 | 600 | 604 | 141.2 |
| C | 7 | 220 | 2106 | 10.64 | 600 | 604 | 141.2 |
| D | 1 | 52 | 1629305 | 10968.72 | 597 | 578 | 148.5 |
| D | 2 | 249 | 199971 | 1342.82 | 597 | 578 | 148.5 |
| D | 12 | 6 | 61446 | 409.92 | 597 | 578 | 148.5 |
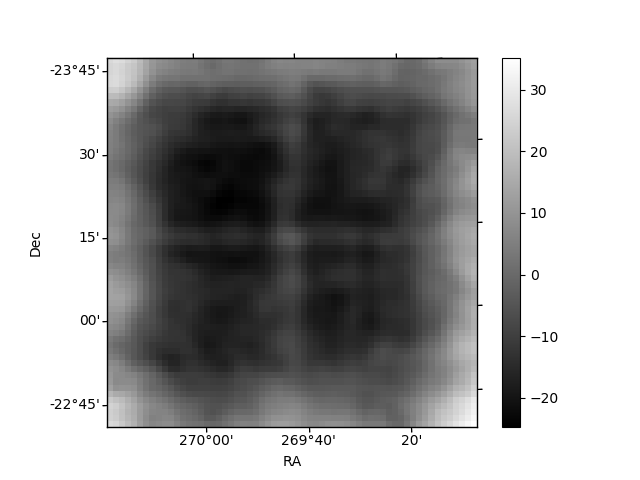
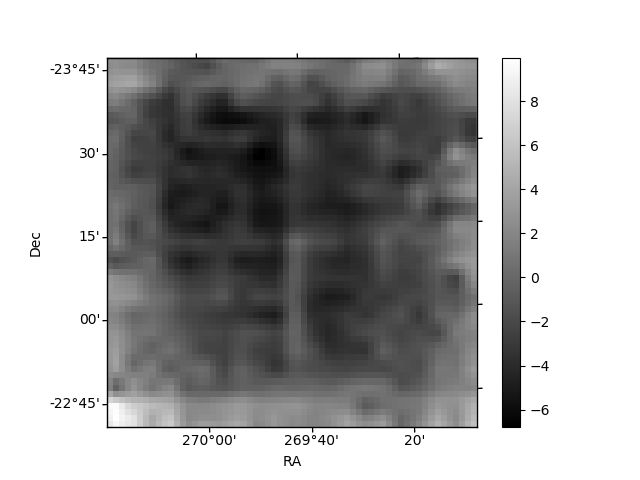
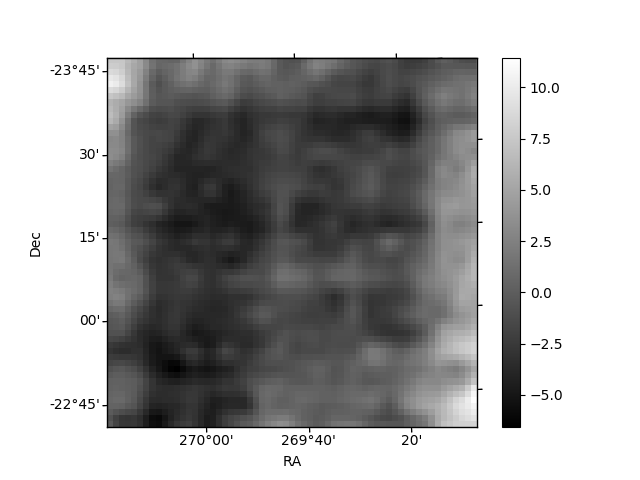
Histogram calculated using DETX and DETY for each event in the final _common_clean file
| Quadrant A | 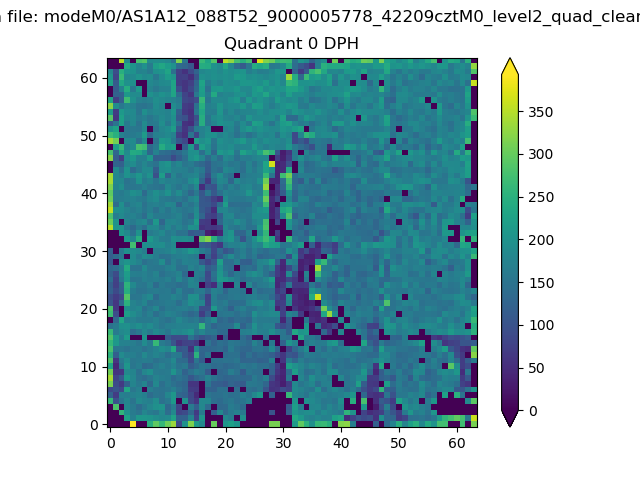 |
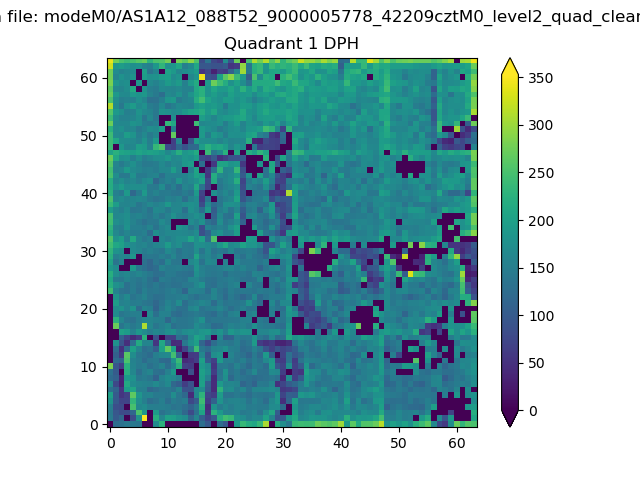 |
Quadrant B |
|---|---|---|---|
| Quadrant D | 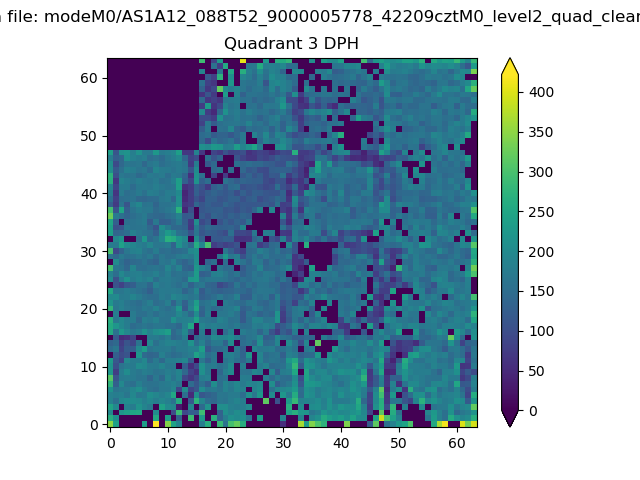 |
 |
Quadrant C |
| Plot type | Count rate plots | Images |
|---|---|---|
| Comparison with Poisson distribution Blue bars denote a histogram of data divided into 1 sec bins. Red curve is a Poisson curve with rate = median count rate of data. |
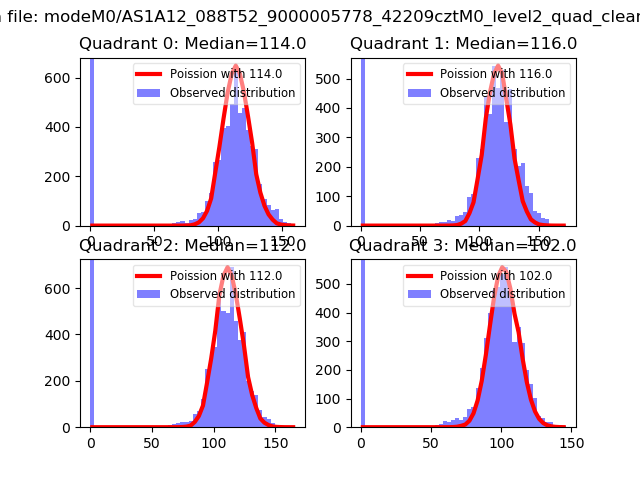 |
 |
| Quadrant-wise count rates Data is divided into 100 sec bins |
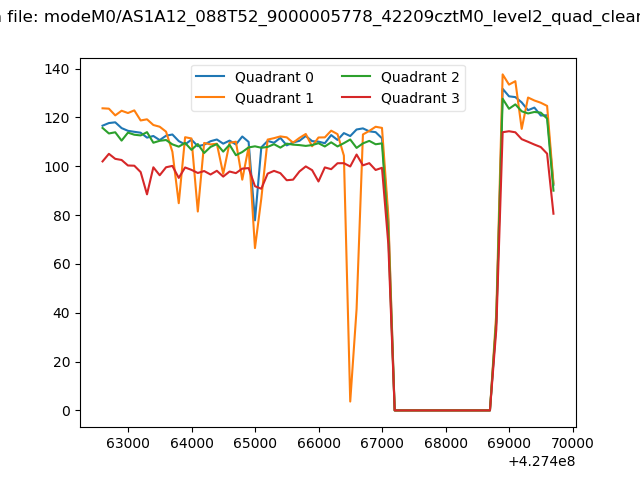 |
|
| Module-wise count rates for Quadrant A Data is divided into 100 sec bins |
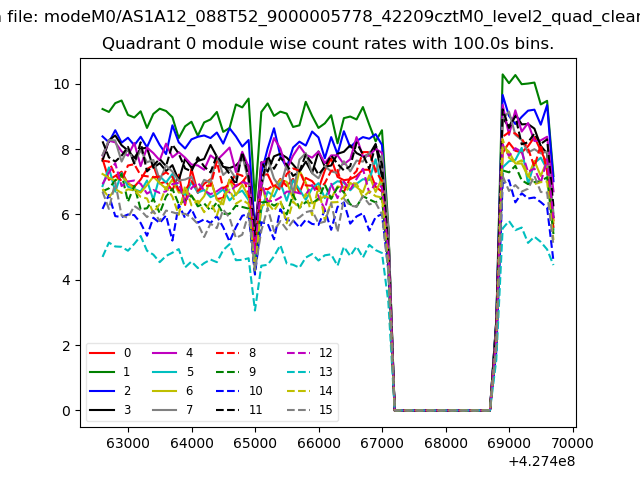 |
 |
| Module-wise count rates for Quadrant B Data is divided into 100 sec bins |
 |
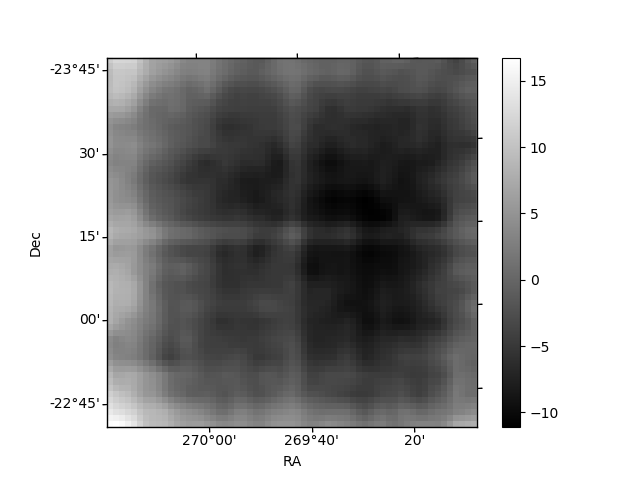 |
| Module-wise count rates for Quadrant C Data is divided into 100 sec bins |
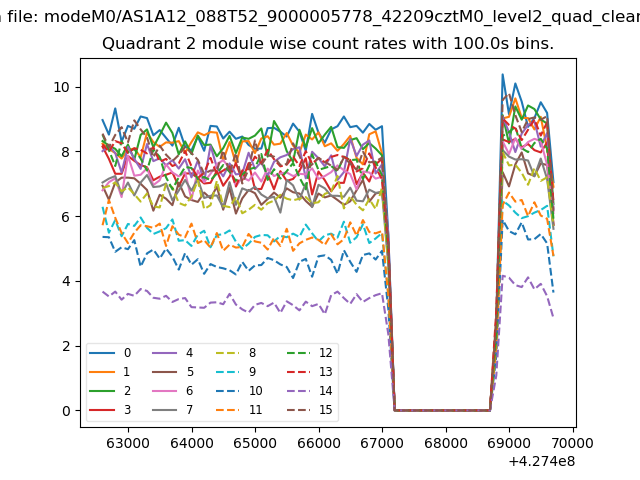 |
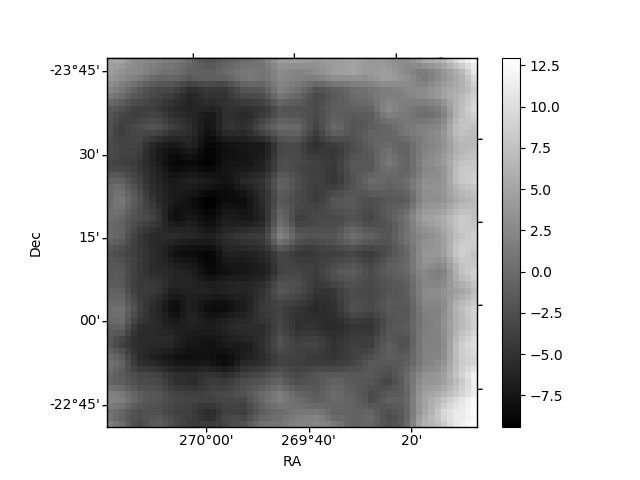 |
| Module-wise count rates for Quadrant D Data is divided into 100 sec bins |
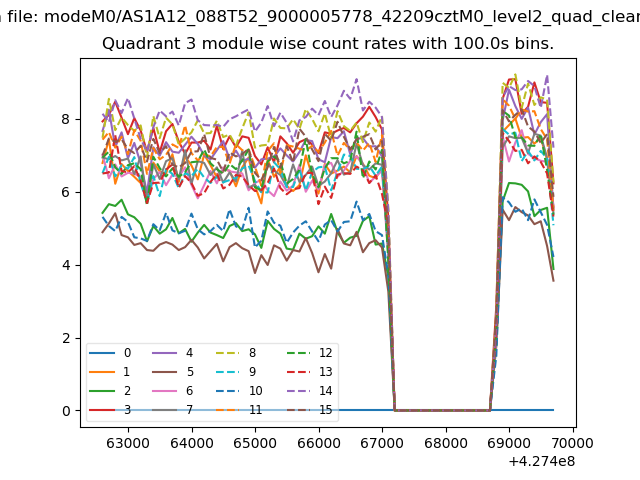 |
 |
| Parameter | Plot |
|---|---|
| CZT HV Monitor | 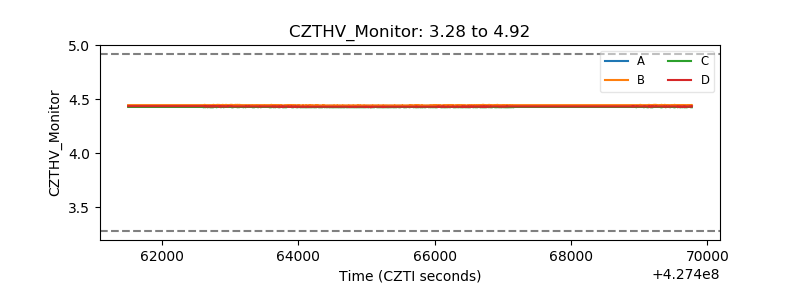 |
| D_VDD | 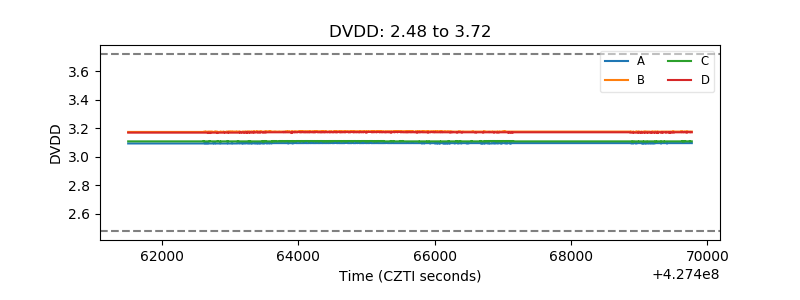 |
| Temperature 1 | 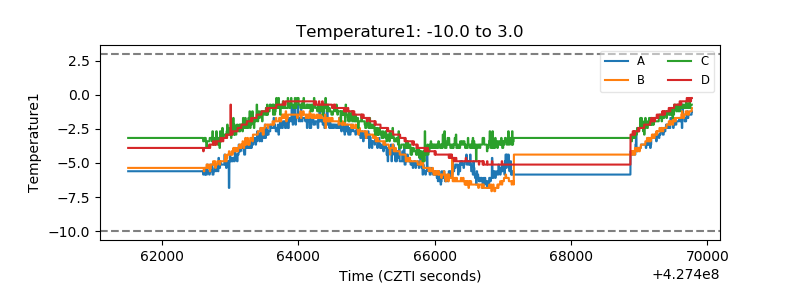 |
| Veto HV Monitor | 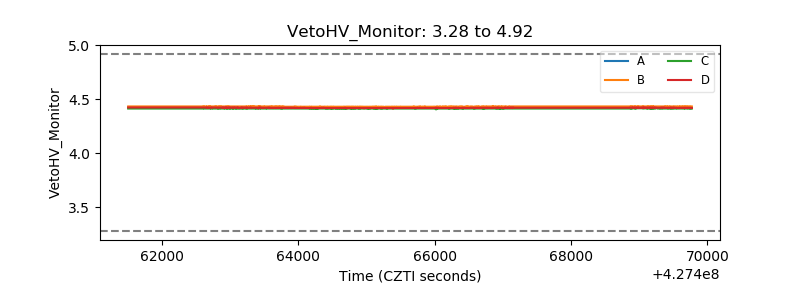 |
| Veto LLD |  |
| Alpha Counter |  |
| _CPM_Rate |  |
| CZT Counter | 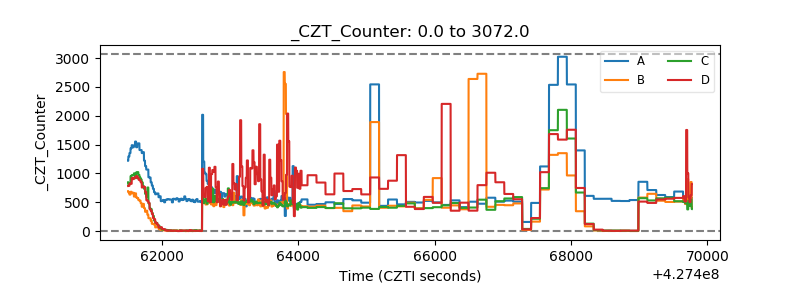 |
| +2.5 Volts monitor | 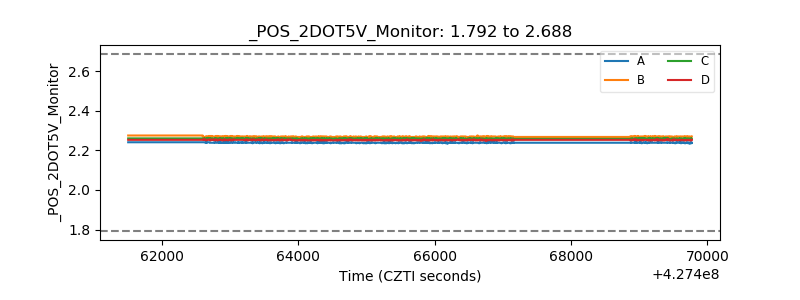 |
| +5 Volts monitor | 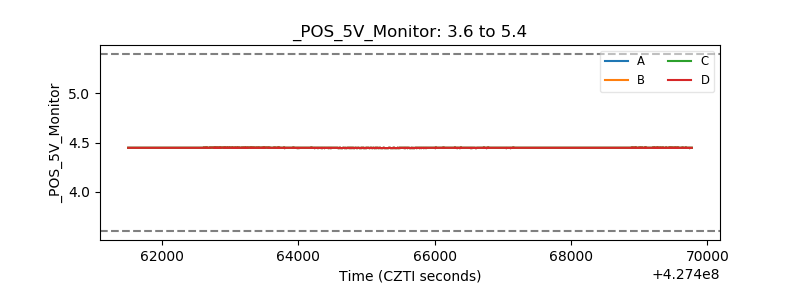 |
| _ROLL_ROT | 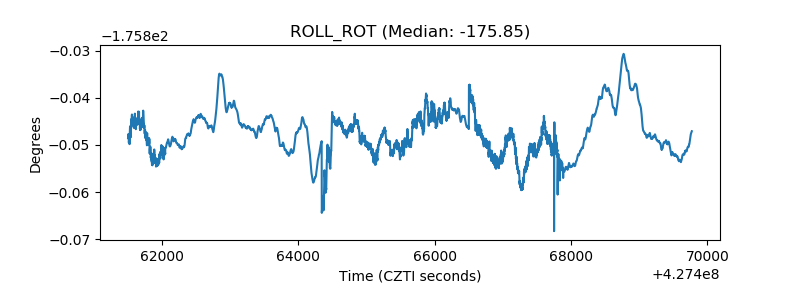 |
| _Roll_DEC | 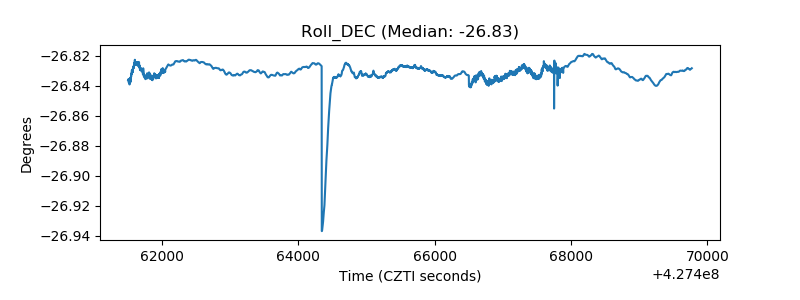 |
| _Roll_RA | 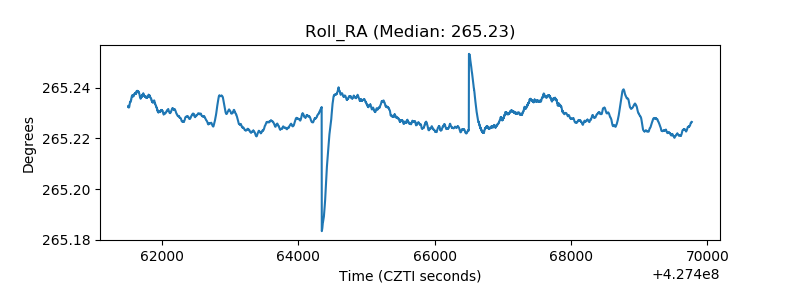 |
| Veto Counter | 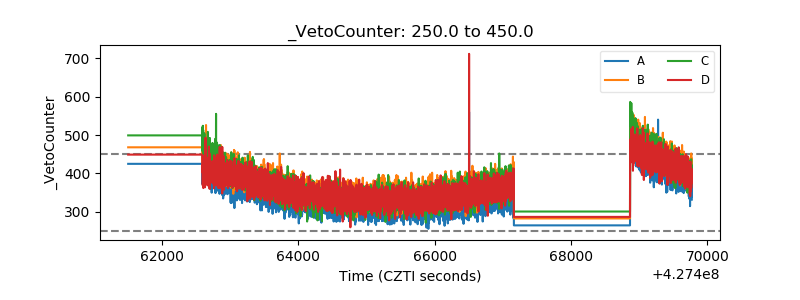 |