| Param | Original file | Final file |
|---|---|---|
| Filename | modeM0/AS1A12_088T52_9000005778_42211cztM0_level2.fits | modeM0/AS1A12_088T52_9000005778_42211cztM0_level2_quad_clean.evt |
| Size (bytes) | 331,868,160 | 91,131,840 |
| Size | 316.5 MB | 86.9 MB |
| Events in quadrant A | 3,143,184 | 619,683 |
| Events in quadrant B | 2,659,750 | 631,643 |
| Events in quadrant C | 2,474,662 | 601,156 |
| Events in quadrant D | 3,602,372 | 543,600 |
| Mode SS | |||
|---|---|---|---|
| Quadrant | BADHDUFLAG | Total packets | Discarded packets |
| A | 0 | 104 | 0 |
| B | 0 | 104 | 0 |
| C | 0 | 104 | 0 |
| D | 0 | 104 | 0 |
| Mode M9 | |||
|---|---|---|---|
| Quadrant | BADHDUFLAG | Total packets | Discarded packets |
| A | 0 | 19 | 0 |
| B | 0 | 19 | 0 |
| C | 0 | 19 | 0 |
| D | 0 | 19 | 0 |
| Mode M0 | |||
|---|---|---|---|
| Quadrant | BADHDUFLAG | Total packets | Discarded packets |
| A | 0 | 12558 | 1 |
| B | 0 | 11396 | 1 |
| C | 0 | 10570 | 1 |
| D | 0 | 14244 | 1 |
| Quadrant | Total seconds | Saturated seconds | Saturation percentage |
|---|---|---|---|
| A | 5195 | 38 | 0.731473% |
| B | 5195 | 53 | 1.020212% |
| C | 5196 | 2 | 0.038491% |
| D | 5196 | 145 | 2.790608% |
Noise dominated data is calculated using 1-second bins in cleaned event files. If a bin has >2000 counts, and if more than 50% of those come from <1% of pixels, then it is considered to be noise-dominated and hence unusable.
| Quadrant | # 1 sec bins | Bins with >0 counts | Bins with >2000 counts | High rate bins dominated by noise | Noise dominated (total time) | Noise dominated (detector-on time) | Marked lightcurve |
|---|---|---|---|---|---|---|---|
| A | 7048 | 5196 | 14 | 14 | 0.20% | 0.27% | 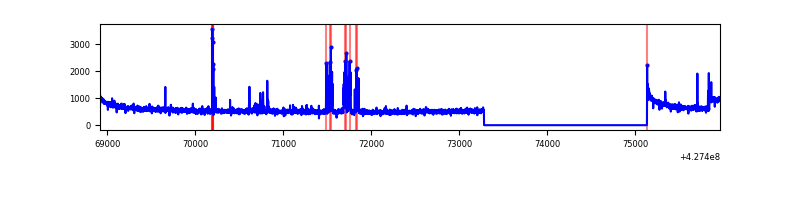 |
| B | 7048 | 5196 | 41 | 41 | 0.58% | 0.79% | 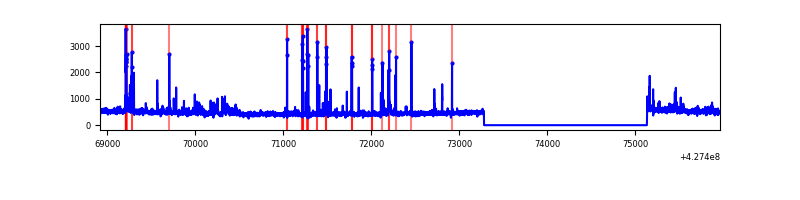 |
| C | 7049 | 5197 | 0 | 0 | 0.00% | 0.00% | 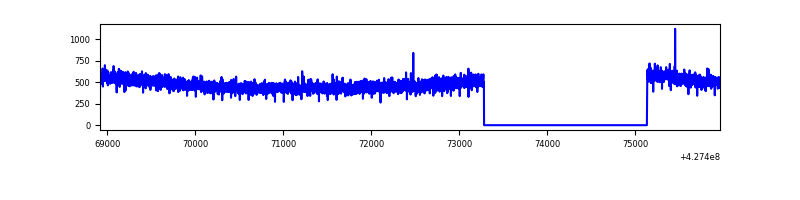 |
| D | 7049 | 5197 | 143 | 143 | 2.03% | 2.75% | 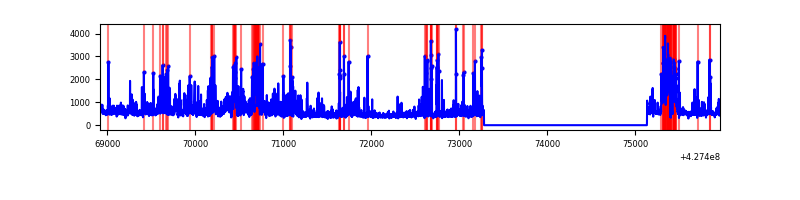 |
Top three noisy pixels from each quadrant. If the there are fewer than three noisy pixels in the level2.evt file, extra rows are filled as -1
| Pixel properties | Quadrant properties | ||||||
|---|---|---|---|---|---|---|---|
| Quadrant | DetID | PixID | Counts | Sigma | Mean | Median | Sigma |
| A | 10 | 83 | 542648 | 4403.65 | 601 | 589 | 123.1 |
| A | 15 | 222 | 152677 | 1235.55 | 601 | 589 | 123.1 |
| A | 15 | 223 | 77396 | 623.97 | 601 | 589 | 123.1 |
| B | 7 | 202 | 82437 | 715.98 | 591 | 577 | 114.3 |
| B | 0 | 229 | 79783 | 692.76 | 591 | 577 | 114.3 |
| B | 0 | 245 | 71535 | 620.62 | 591 | 577 | 114.3 |
| C | 15 | 214 | 217756 | 1617.31 | 577 | 581 | 134.3 |
| C | 7 | 220 | 5804 | 38.9 | 577 | 581 | 134.3 |
| C | 13 | 61 | 3841 | 24.28 | 577 | 581 | 134.3 |
| D | 1 | 52 | 1036865 | 7404.73 | 574 | 559 | 140.0 |
| D | 12 | 6 | 93868 | 666.72 | 574 | 559 | 140.0 |
| D | 1 | 47 | 34894 | 245.33 | 574 | 559 | 140.0 |
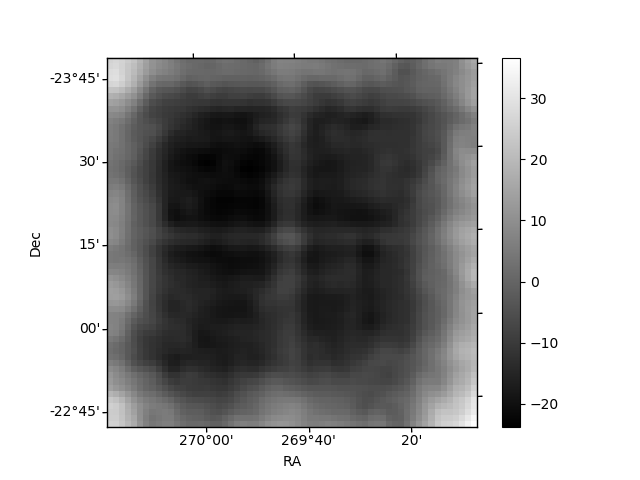
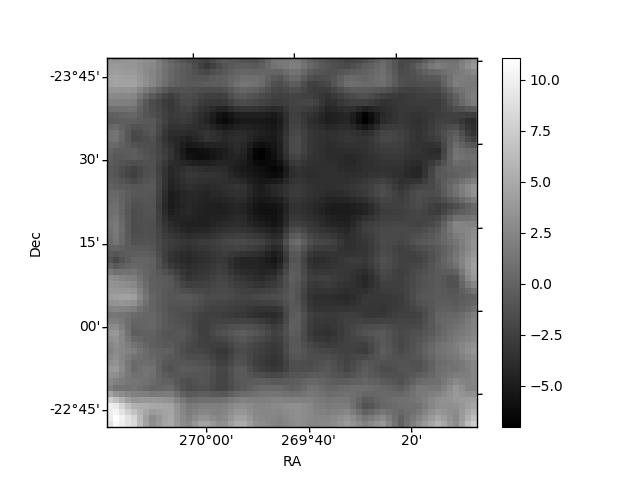
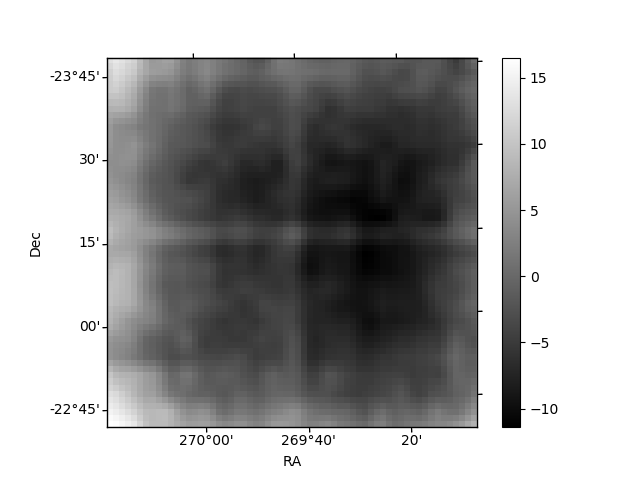
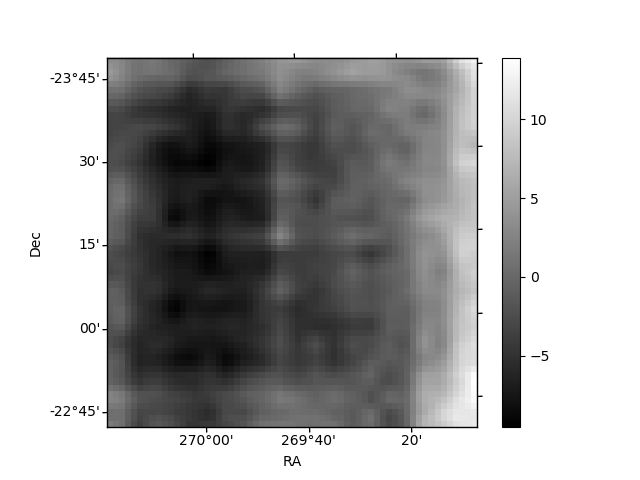
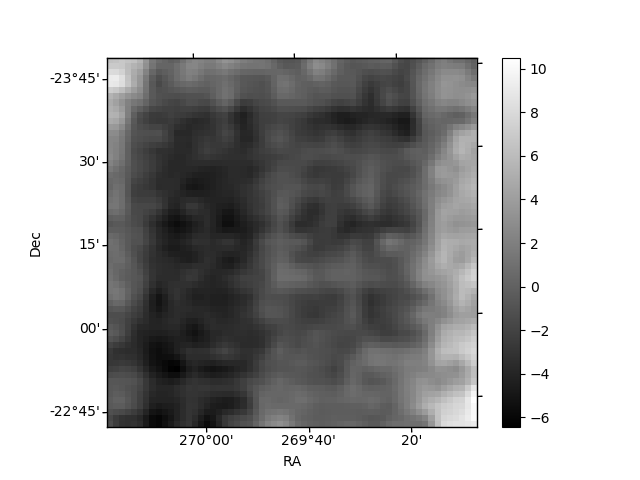
Histogram calculated using DETX and DETY for each event in the final _common_clean file
| Quadrant A | 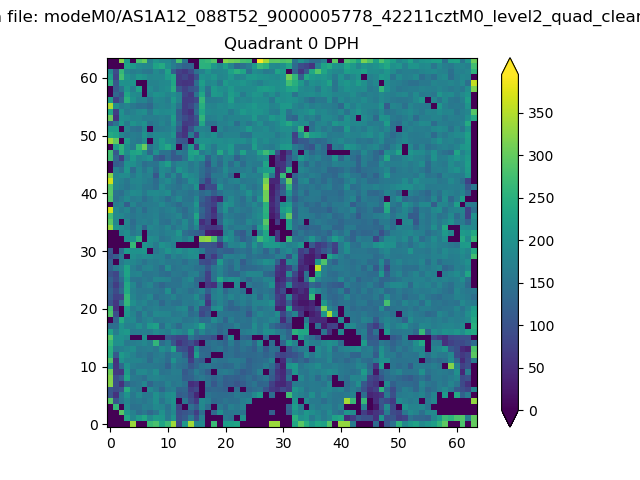 |
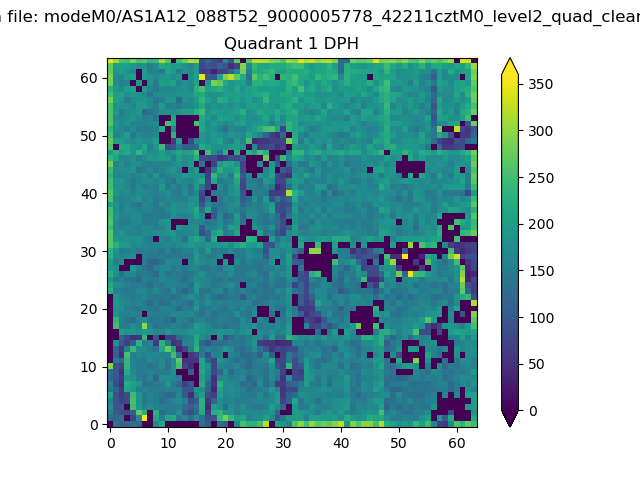 |
Quadrant B |
|---|---|---|---|
| Quadrant D | 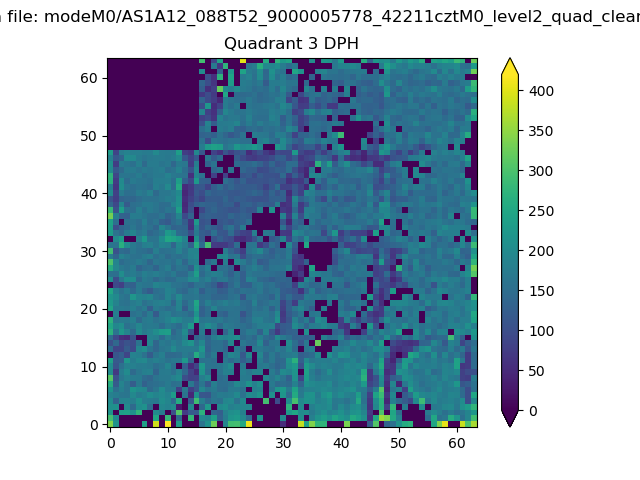 |
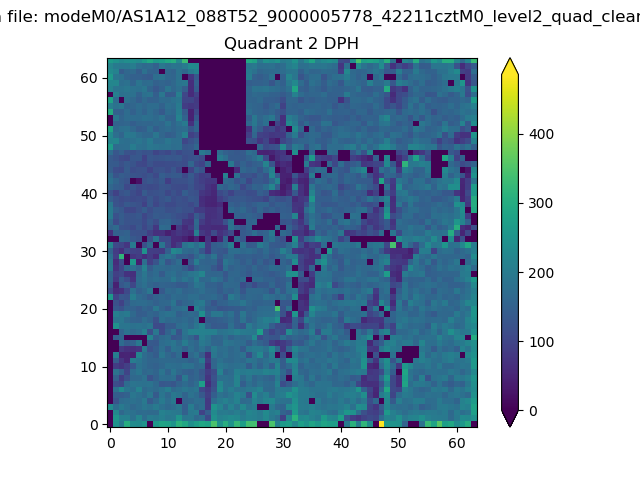 |
Quadrant C |
| Plot type | Count rate plots | Images |
|---|---|---|
| Comparison with Poisson distribution Blue bars denote a histogram of data divided into 1 sec bins. Red curve is a Poisson curve with rate = median count rate of data. |
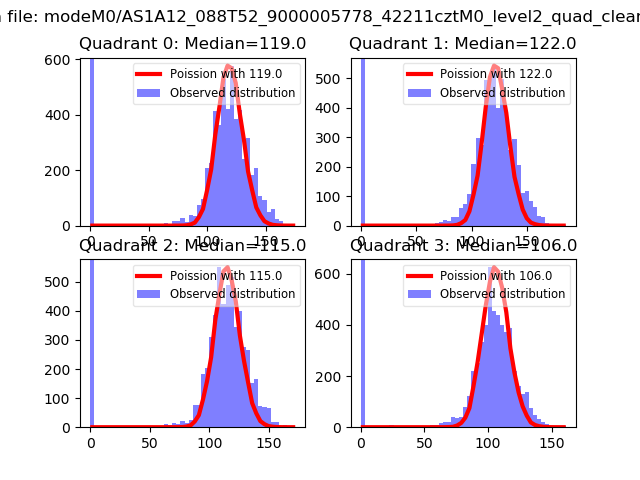 |
 |
| Quadrant-wise count rates Data is divided into 100 sec bins |
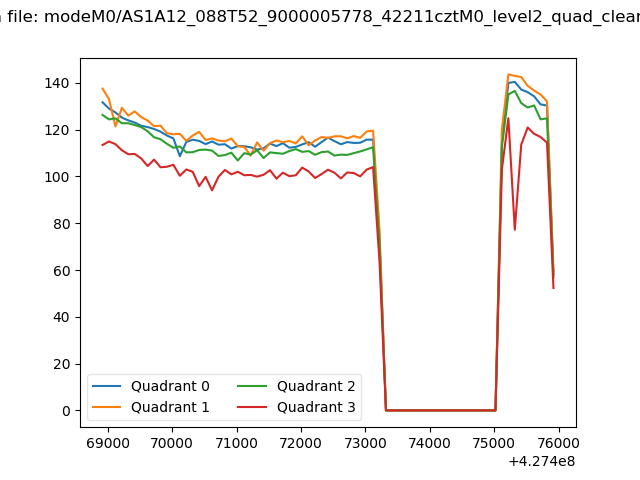 |
|
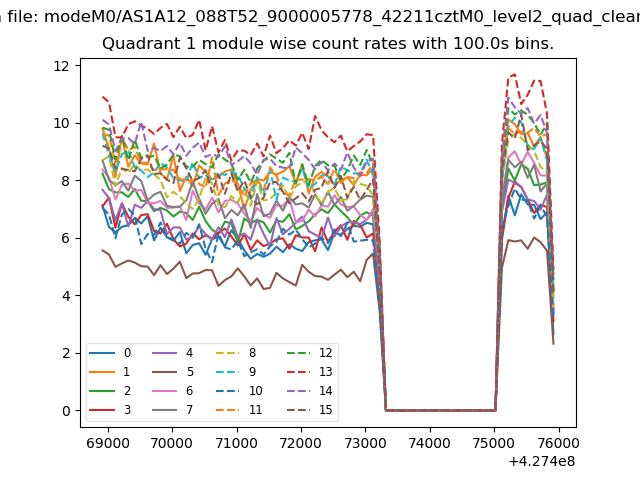
| Module-wise count rates for Quadrant A Data is divided into 100 sec bins |
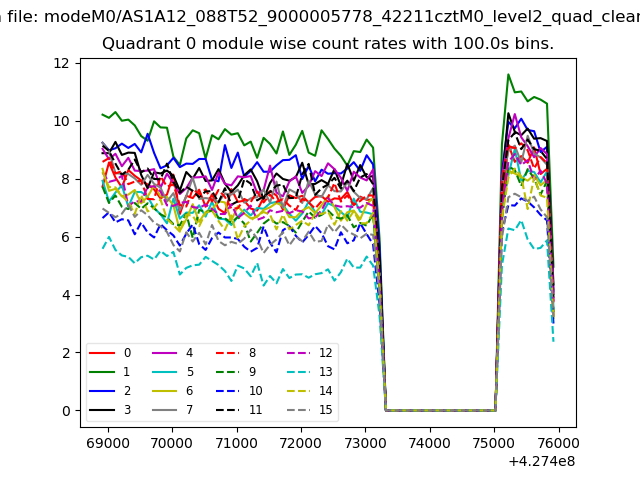 |
 |
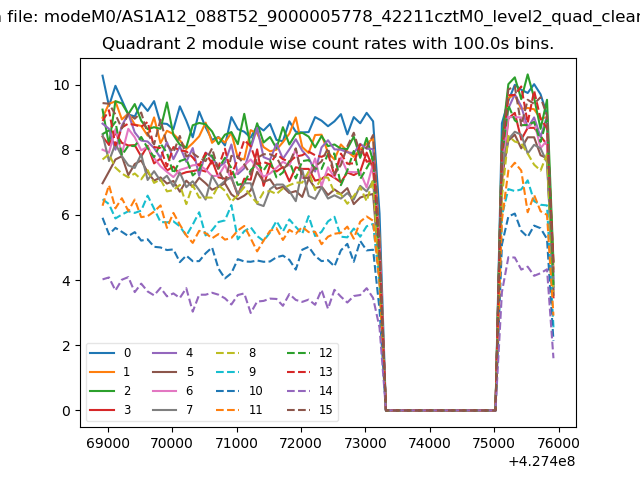
| Module-wise count rates for Quadrant B Data is divided into 100 sec bins |
 |
 |
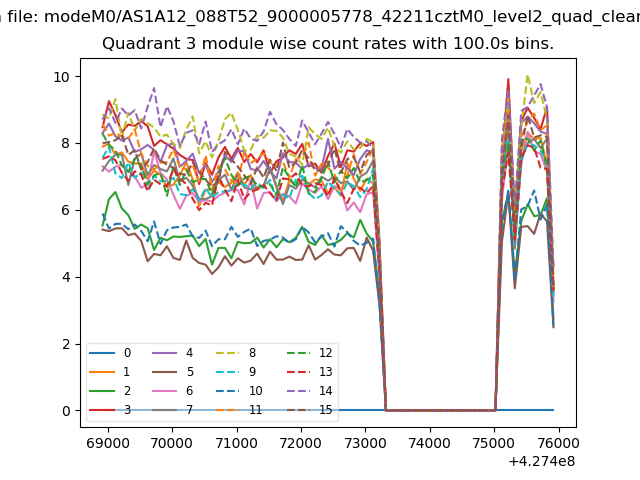
| Module-wise count rates for Quadrant C Data is divided into 100 sec bins |
 |
 |
| Module-wise count rates for Quadrant D Data is divided into 100 sec bins |
 |
 |
| Parameter | Plot |
|---|---|
| CZT HV Monitor | 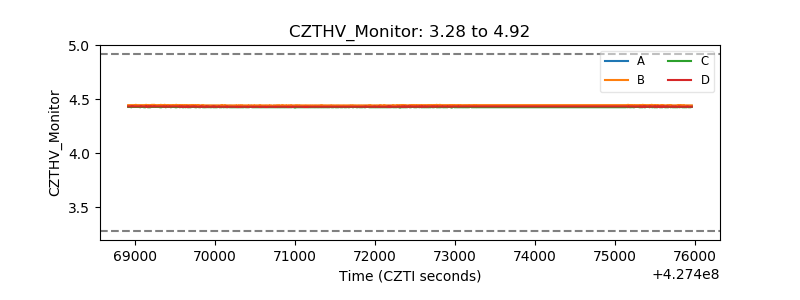 |
| D_VDD | 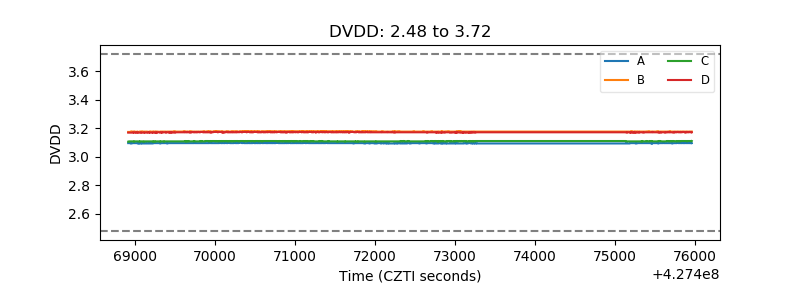 |
| Temperature 1 | 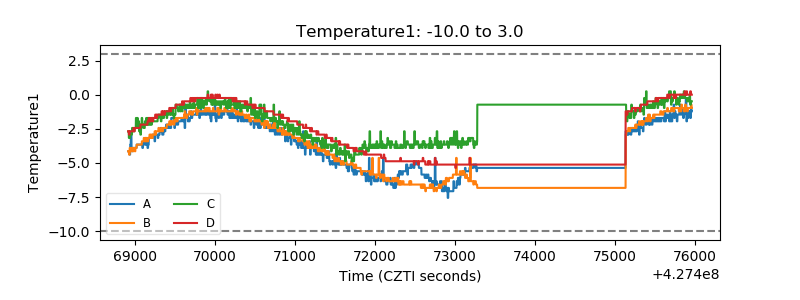 |
| Veto HV Monitor |  |
| Veto LLD | 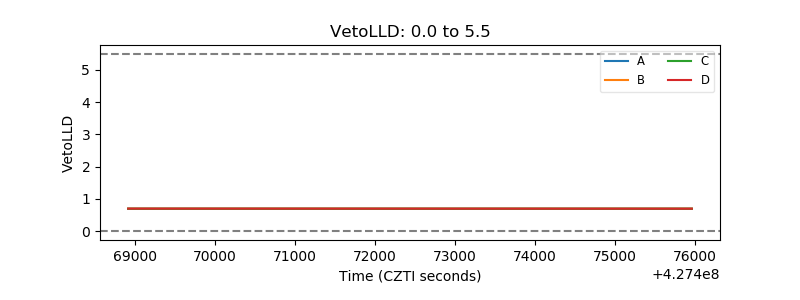 |
| Alpha Counter | 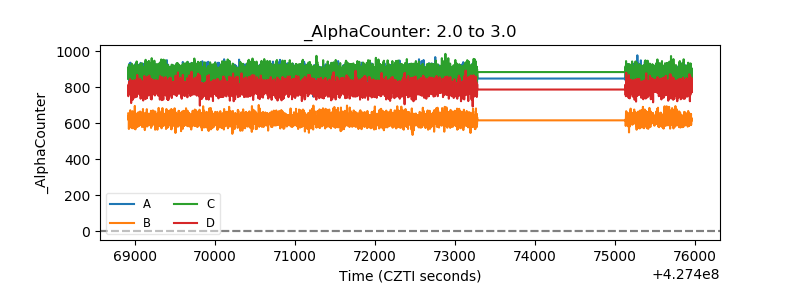 |
| _CPM_Rate | 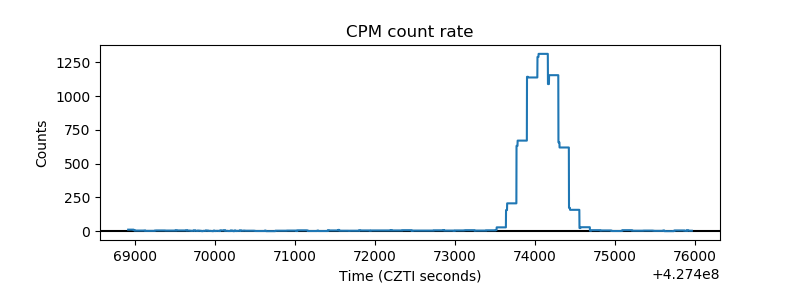 |
| CZT Counter | 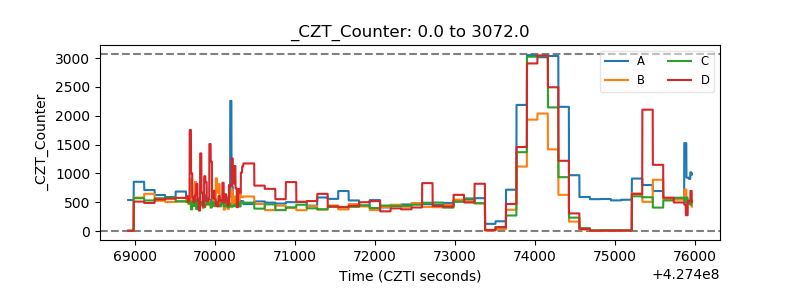 |
| +2.5 Volts monitor | 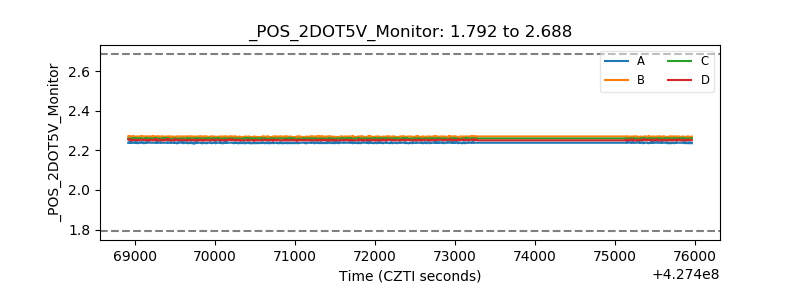 |
| +5 Volts monitor | 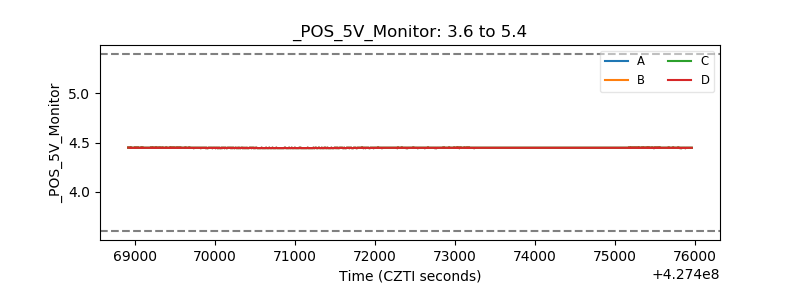 |
| _ROLL_ROT |  |
| _Roll_DEC | 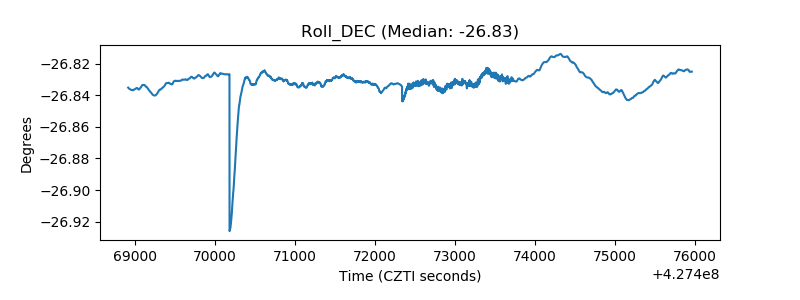 |
| _Roll_RA | 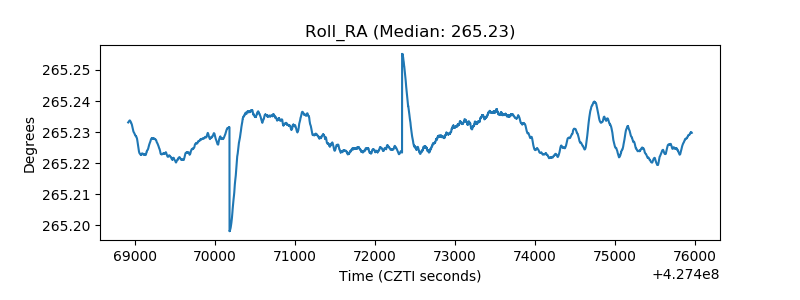 |
| Veto Counter | 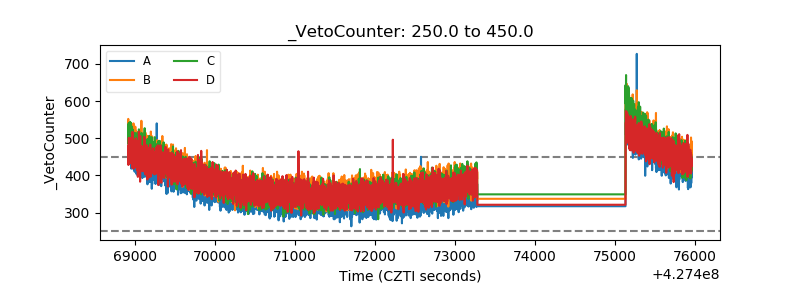 |