| Param | Original file | Final file |
|---|---|---|
| Filename | modeM0/AS1A12_088T52_9000005778_42212cztM0_level2.fits | modeM0/AS1A12_088T52_9000005778_42212cztM0_level2_quad_clean.evt |
| Size (bytes) | 184,564,800 | 50,117,760 |
| Size | 176.0 MB | 47.8 MB |
| Events in quadrant A | 1,885,299 | 344,526 |
| Events in quadrant B | 1,371,709 | 349,713 |
| Events in quadrant C | 1,315,946 | 330,340 |
| Events in quadrant D | 2,042,765 | 296,243 |
| Mode SS | |||
|---|---|---|---|
| Quadrant | BADHDUFLAG | Total packets | Discarded packets |
| A | 0 | 54 | 0 |
| B | 0 | 54 | 0 |
| C | 0 | 54 | 0 |
| D | 0 | 54 | 0 |
| Mode M9 | |||
|---|---|---|---|
| Quadrant | BADHDUFLAG | Total packets | Discarded packets |
| A | 0 | 13 | 0 |
| B | 0 | 14 | 0 |
| C | 0 | 14 | 0 |
| D | 0 | 14 | 0 |
| Mode M0 | |||
|---|---|---|---|
| Quadrant | BADHDUFLAG | Total packets | Discarded packets |
| A | 0 | 7428 | 1 |
| B | 0 | 5952 | 1 |
| C | 0 | 5654 | 1 |
| D | 0 | 7897 | 1 |
| Quadrant | Total seconds | Saturated seconds | Saturation percentage |
|---|---|---|---|
| A | 2758 | 16 | 0.580131% |
| B | 2758 | 7 | 0.253807% |
| C | 2758 | 1 | 0.036258% |
| D | 2758 | 131 | 4.749819% |
Noise dominated data is calculated using 1-second bins in cleaned event files. If a bin has >2000 counts, and if more than 50% of those come from <1% of pixels, then it is considered to be noise-dominated and hence unusable.
| Quadrant | # 1 sec bins | Bins with >0 counts | Bins with >2000 counts | High rate bins dominated by noise | Noise dominated (total time) | Noise dominated (detector-on time) | Marked lightcurve |
|---|---|---|---|---|---|---|---|
| A | 2758 | 2758 | 5 | 5 | 0.18% | 0.18% | 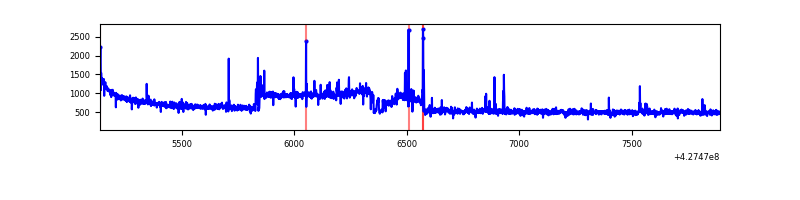 |
| B | 2758 | 2758 | 3 | 3 | 0.11% | 0.11% | 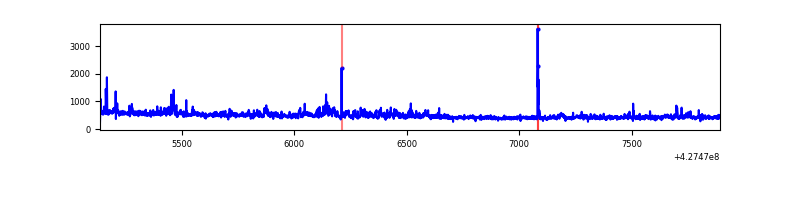 |
| C | 2758 | 2758 | 1 | 1 | 0.04% | 0.04% | 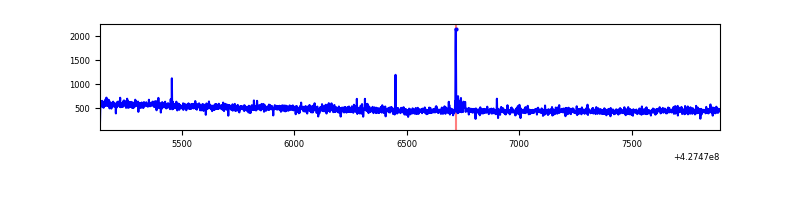 |
| D | 2758 | 2758 | 116 | 116 | 4.21% | 4.21% | 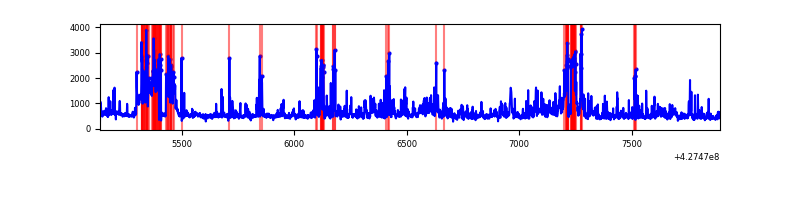 |
Top three noisy pixels from each quadrant. If the there are fewer than three noisy pixels in the level2.evt file, extra rows are filled as -1
| Pixel properties | Quadrant properties | ||||||
|---|---|---|---|---|---|---|---|
| Quadrant | DetID | PixID | Counts | Sigma | Mean | Median | Sigma |
| A | 10 | 83 | 315582 | 4717.06 | 321 | 315 | 66.8 |
| A | 15 | 223 | 306571 | 4582.24 | 321 | 315 | 66.8 |
| A | 15 | 222 | 11494 | 167.26 | 321 | 315 | 66.8 |
| B | 0 | 229 | 72028 | 1154.19 | 314 | 307 | 62.1 |
| B | 3 | 112 | 21753 | 345.12 | 314 | 307 | 62.1 |
| B | 5 | 255 | 14011 | 220.53 | 314 | 307 | 62.1 |
| C | 15 | 214 | 117540 | 1649.33 | 302 | 304 | 71.1 |
| C | 15 | 159 | 12125 | 166.3 | 302 | 304 | 71.1 |
| C | 7 | 220 | 4091 | 53.28 | 302 | 304 | 71.1 |
| D | 1 | 52 | 525915 | 7047.16 | 302 | 294 | 74.6 |
| D | 13 | 249 | 140995 | 1886.42 | 302 | 294 | 74.6 |
| D | 2 | 249 | 64539 | 861.35 | 302 | 294 | 74.6 |
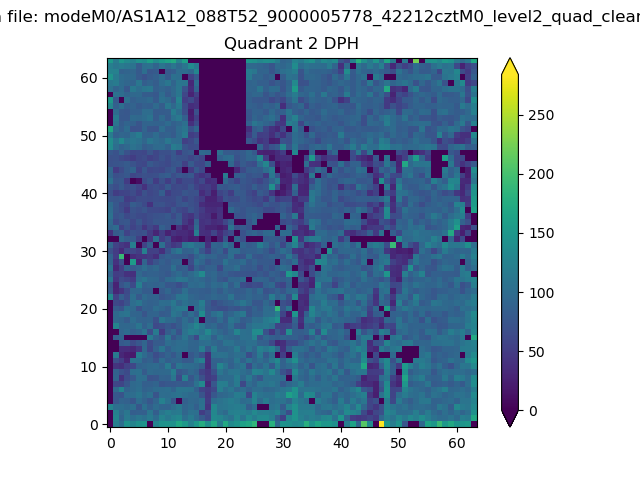
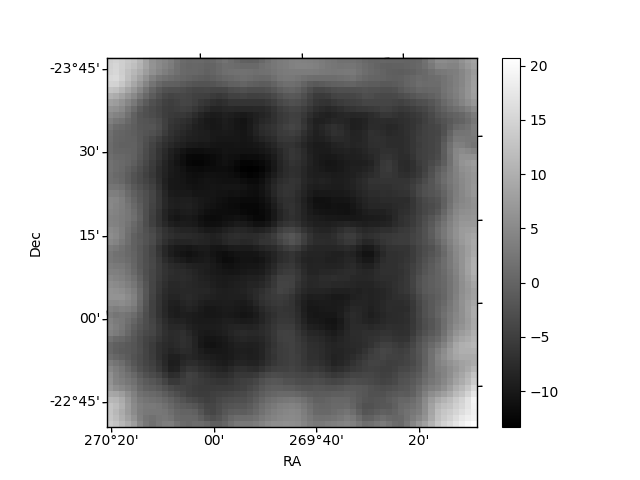
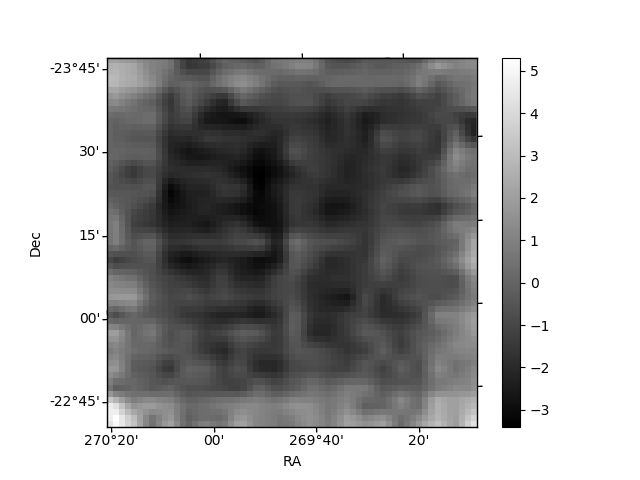
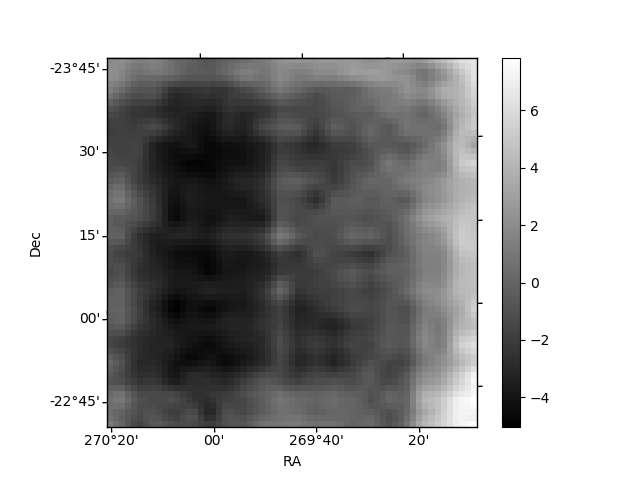
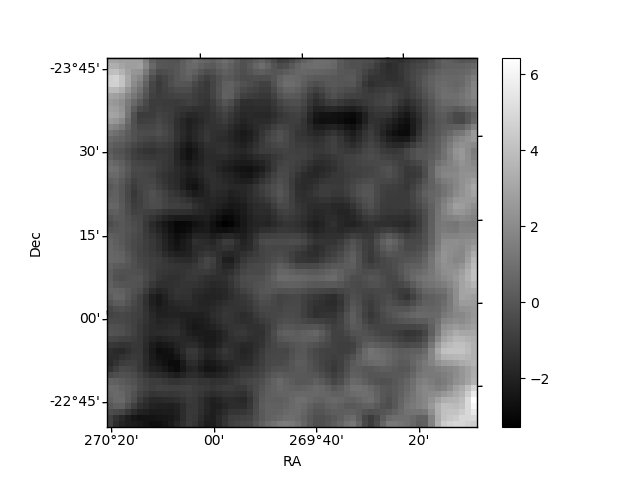
Histogram calculated using DETX and DETY for each event in the final _common_clean file
| Quadrant A | 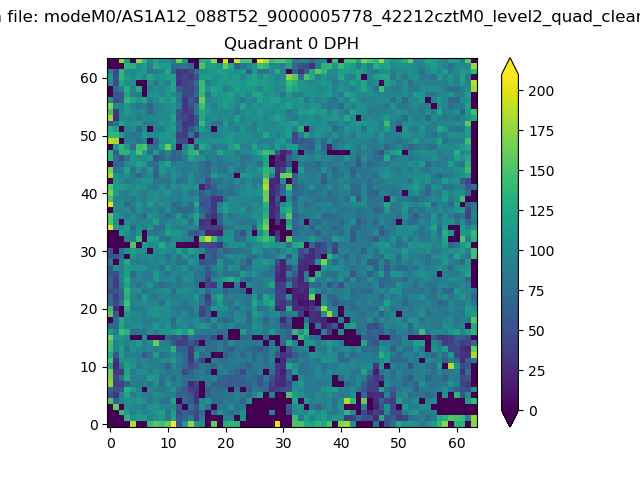 |
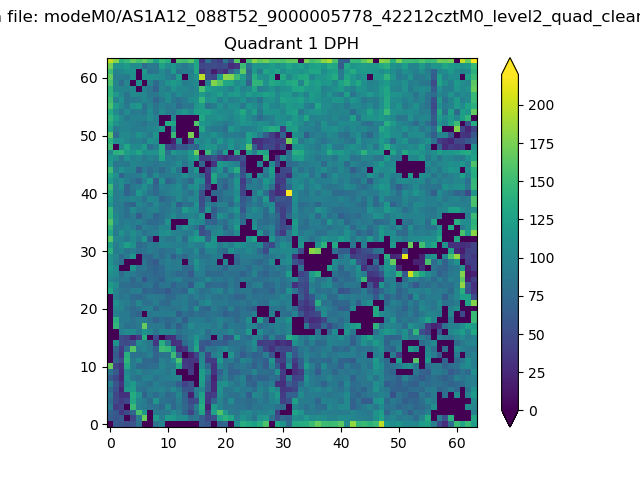 |
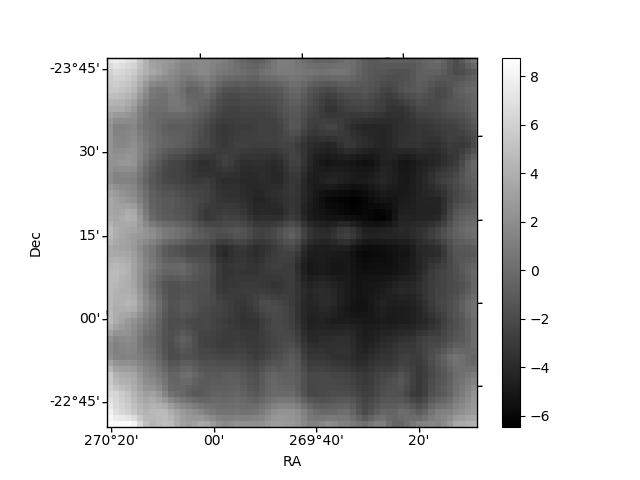
Quadrant B |
|---|---|---|---|
| Quadrant D | 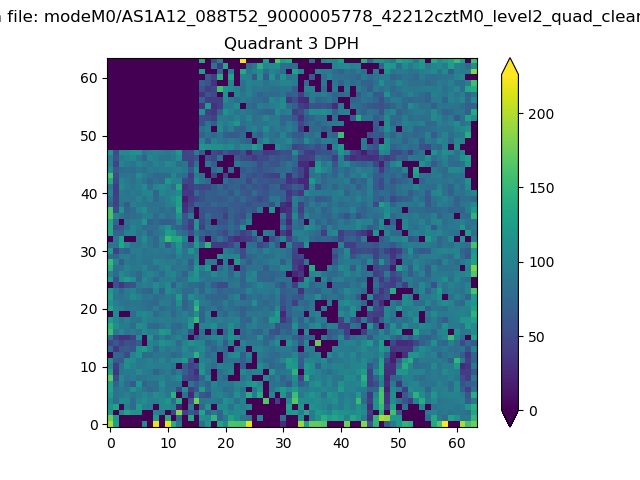 |
 |
Quadrant C |
| Plot type | Count rate plots | Images |
|---|---|---|
| Comparison with Poisson distribution Blue bars denote a histogram of data divided into 1 sec bins. Red curve is a Poisson curve with rate = median count rate of data. |
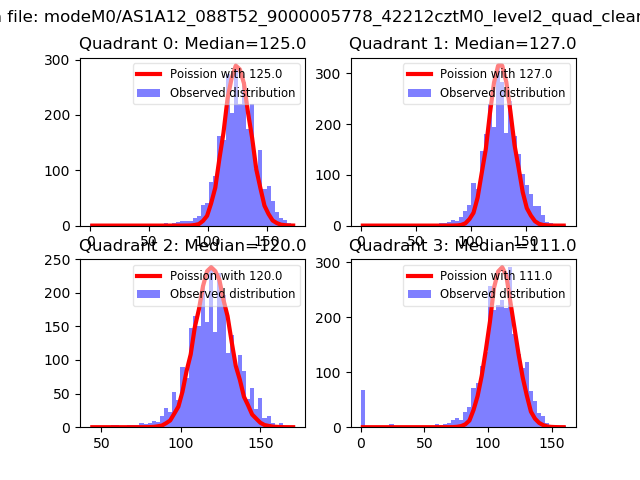 |
 |
| Quadrant-wise count rates Data is divided into 100 sec bins |
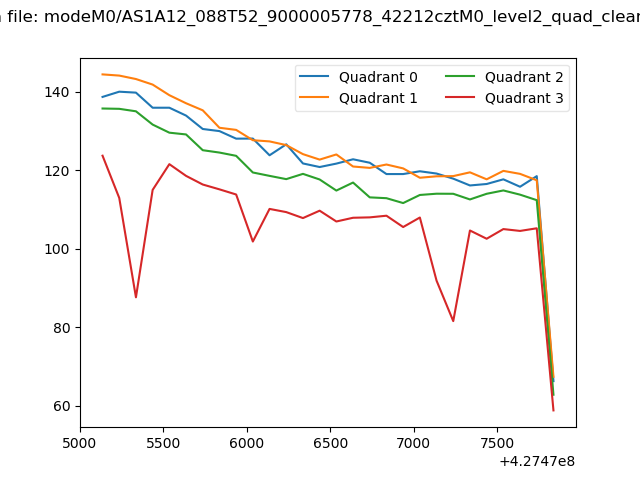 |
|
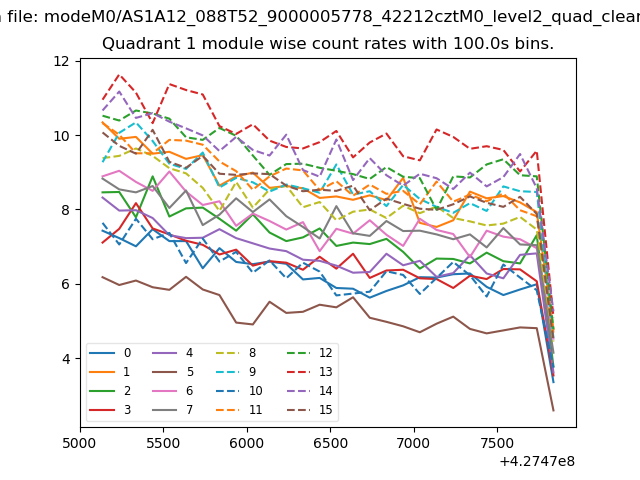
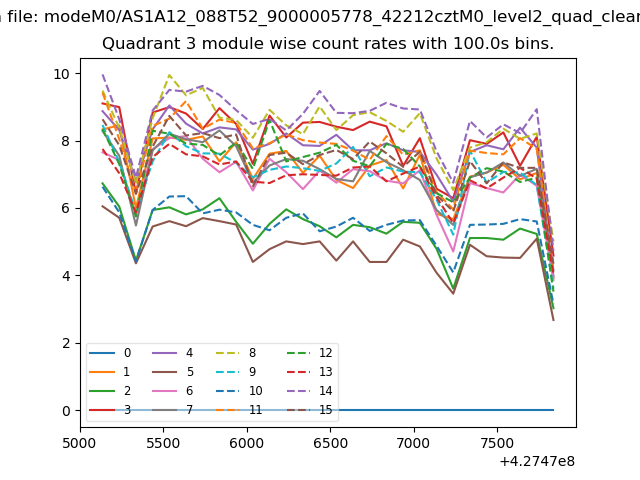
| Module-wise count rates for Quadrant A Data is divided into 100 sec bins |
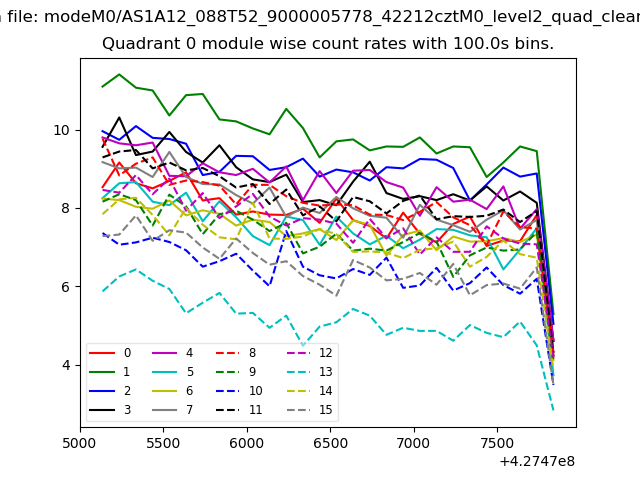 |
 |
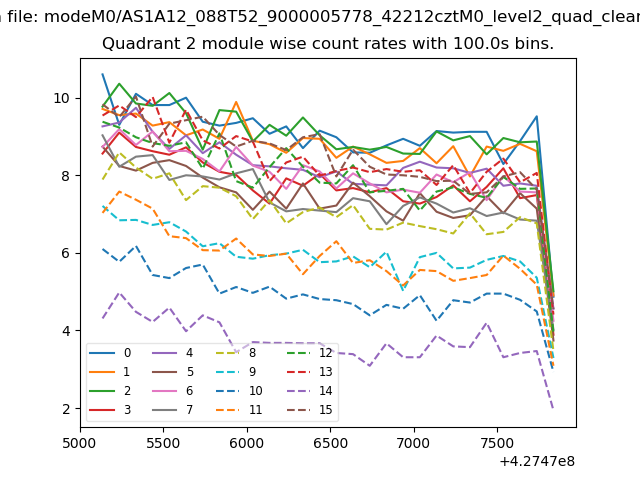
| Module-wise count rates for Quadrant B Data is divided into 100 sec bins |
 |
 |
| Module-wise count rates for Quadrant C Data is divided into 100 sec bins |
 |
 |
| Module-wise count rates for Quadrant D Data is divided into 100 sec bins |
 |
 |
| Parameter | Plot |
|---|---|
| CZT HV Monitor | 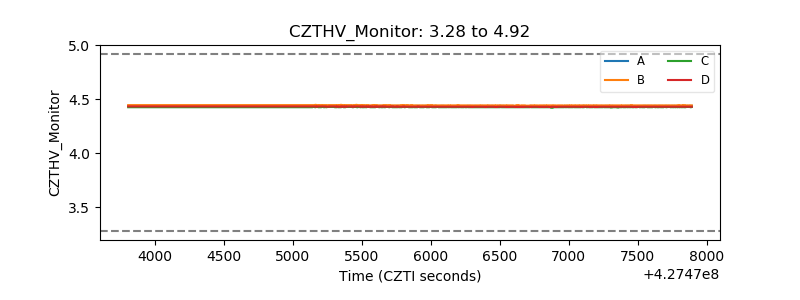 |
| D_VDD | 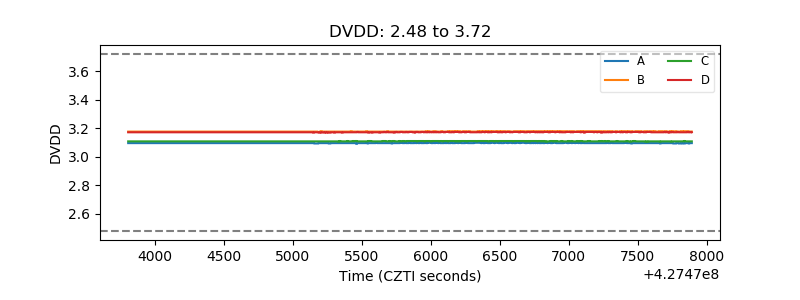 |
| Temperature 1 | 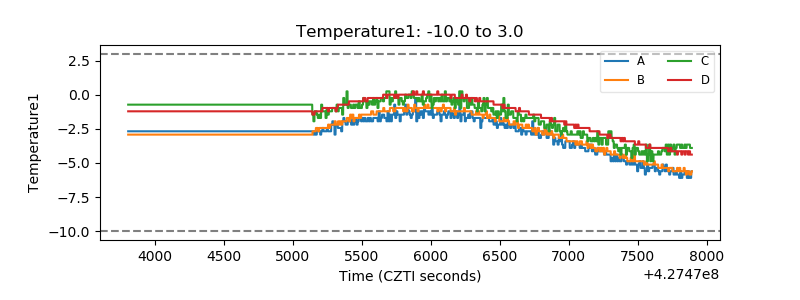 |
| Veto HV Monitor |  |
| Veto LLD | 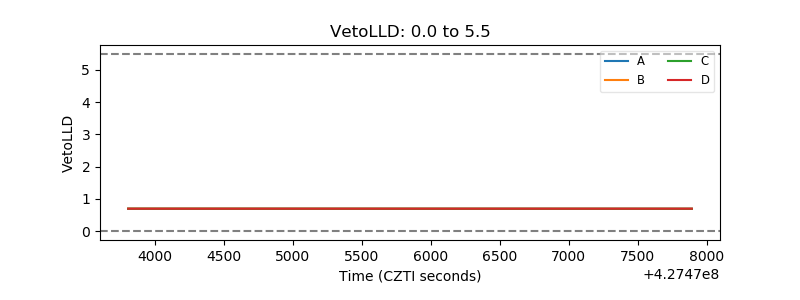 |
| Alpha Counter | 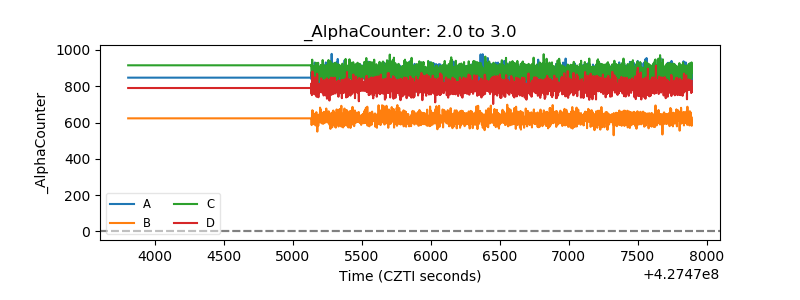 |
| _CPM_Rate | 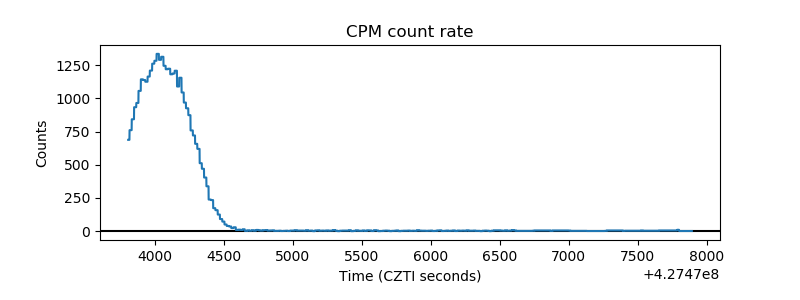 |
| CZT Counter | 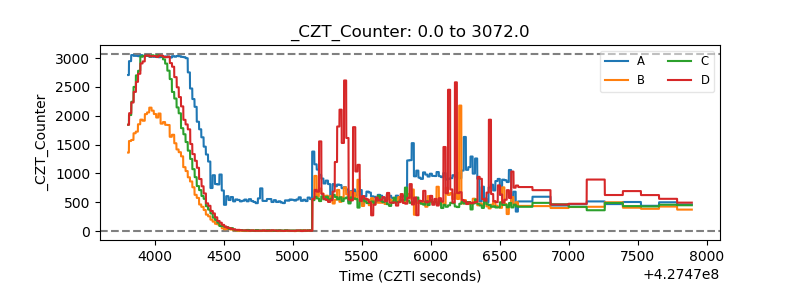 |
| +2.5 Volts monitor | 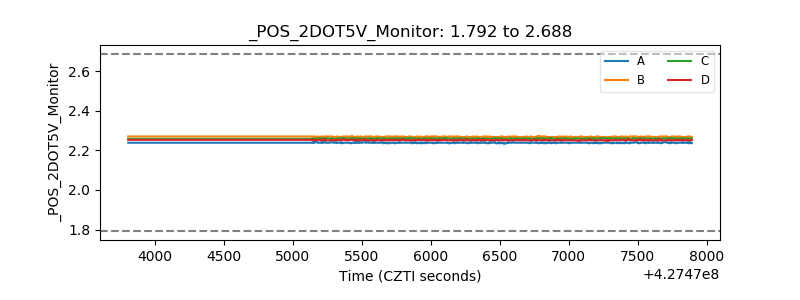 |
| +5 Volts monitor | 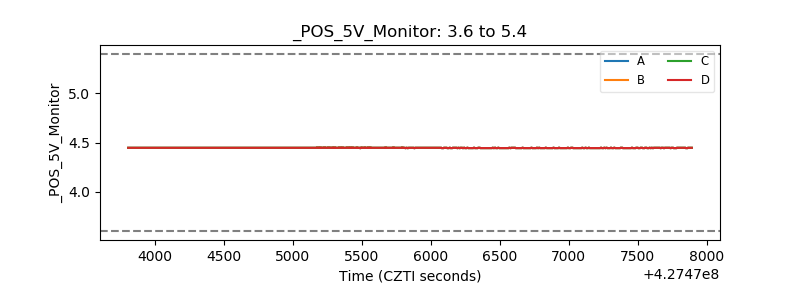 |
| _ROLL_ROT | 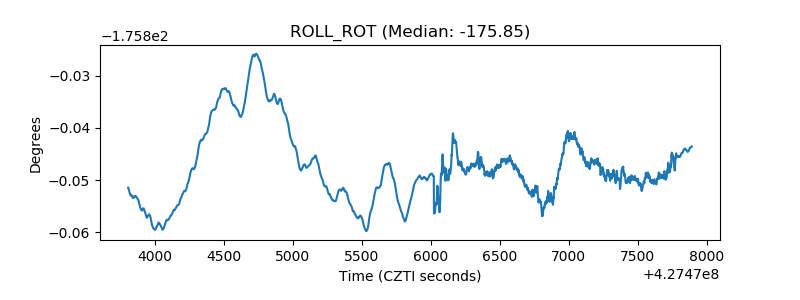 |
| _Roll_DEC | 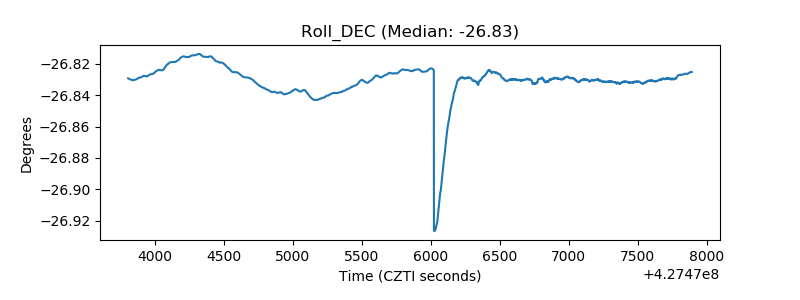 |
| _Roll_RA | 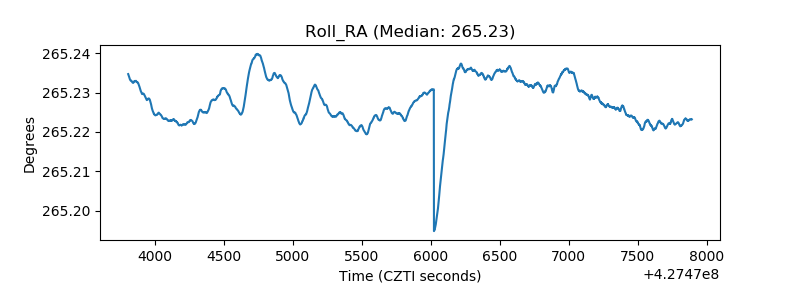 |
| Veto Counter | 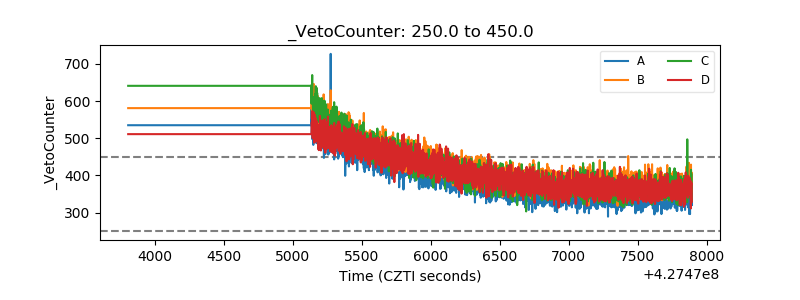 |