| Param | Original file | Final file |
|---|---|---|
| Filename | modeM0/AS1A12_089T08_9000005790_42289cztM0_level2.fits | modeM0/AS1A12_089T08_9000005790_42289cztM0_level2_quad_clean.evt |
| Size (bytes) | 307,261,440 | 85,973,760 |
| Size | 293.0 MB | 82.0 MB |
| Events in quadrant A | 2,820,989 | 577,896 |
| Events in quadrant B | 2,377,475 | 595,154 |
| Events in quadrant C | 2,380,744 | 561,079 |
| Events in quadrant D | 3,386,251 | 502,525 |
| Mode M0 | |||
|---|---|---|---|
| Quadrant | BADHDUFLAG | Total packets | Discarded packets |
| A | 0 | 11588 | 2 |
| B | 0 | 10770 | 2 |
| C | 0 | 10574 | 2 |
| D | 0 | 13842 | 2 |
| Mode SS | |||
|---|---|---|---|
| Quadrant | BADHDUFLAG | Total packets | Discarded packets |
| A | 0 | 106 | 0 |
| B | 0 | 106 | 0 |
| C | 0 | 106 | 0 |
| D | 0 | 106 | 0 |
| Mode M9 | |||
|---|---|---|---|
| Quadrant | BADHDUFLAG | Total packets | Discarded packets |
| A | 0 | 23 | 0 |
| B | 0 | 24 | 0 |
| C | 0 | 24 | 0 |
| D | 0 | 24 | 0 |
| Quadrant | Total seconds | Saturated seconds | Saturation percentage |
|---|---|---|---|
| A | 5236 | 35 | 0.668449% |
| B | 5236 | 10 | 0.190985% |
| C | 5236 | 2 | 0.038197% |
| D | 5236 | 217 | 4.144385% |
Noise dominated data is calculated using 1-second bins in cleaned event files. If a bin has >2000 counts, and if more than 50% of those come from <1% of pixels, then it is considered to be noise-dominated and hence unusable.
| Quadrant | # 1 sec bins | Bins with >0 counts | Bins with >2000 counts | High rate bins dominated by noise | Noise dominated (total time) | Noise dominated (detector-on time) | Marked lightcurve |
|---|---|---|---|---|---|---|---|
| A | 7060 | 5237 | 18 | 18 | 0.25% | 0.34% | 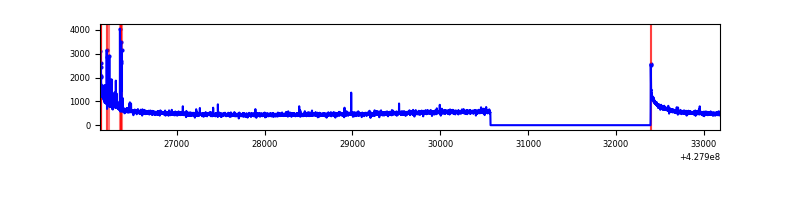 |
| B | 7060 | 5237 | 3 | 3 | 0.04% | 0.06% | 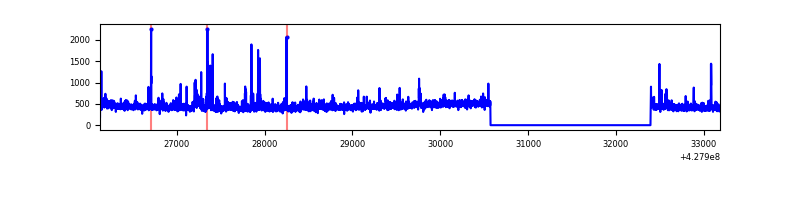 |
| C | 7060 | 5237 | 0 | 0 | 0.00% | 0.00% | 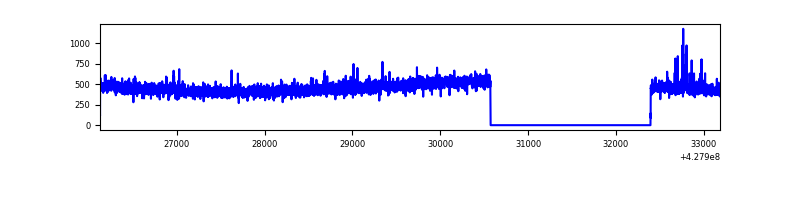 |
| D | 7060 | 5237 | 208 | 208 | 2.95% | 3.97% |  |
Top three noisy pixels from each quadrant. If the there are fewer than three noisy pixels in the level2.evt file, extra rows are filled as -1
| Pixel properties | Quadrant properties | ||||||
|---|---|---|---|---|---|---|---|
| Quadrant | DetID | PixID | Counts | Sigma | Mean | Median | Sigma |
| A | 10 | 83 | 553146 | 4781.14 | 562 | 551 | 115.6 |
| A | 7 | 3 | 71703 | 615.62 | 562 | 551 | 115.6 |
| A | 15 | 223 | 10170 | 83.23 | 562 | 551 | 115.6 |
| B | 4 | 171 | 94979 | 856.39 | 565 | 549 | 110.3 |
| B | 5 | 255 | 34399 | 306.99 | 565 | 549 | 110.3 |
| B | 15 | 35 | 19709 | 173.76 | 565 | 549 | 110.3 |
| C | 15 | 214 | 218744 | 1689.38 | 547 | 551 | 129.2 |
| C | 15 | 159 | 19688 | 148.17 | 547 | 551 | 129.2 |
| C | 15 | 111 | 5438 | 37.84 | 547 | 551 | 129.2 |
| D | 12 | 233 | 352825 | 2674.21 | 537 | 524 | 131.7 |
| D | 1 | 52 | 291556 | 2209.14 | 537 | 524 | 131.7 |
| D | 2 | 249 | 262932 | 1991.86 | 537 | 524 | 131.7 |
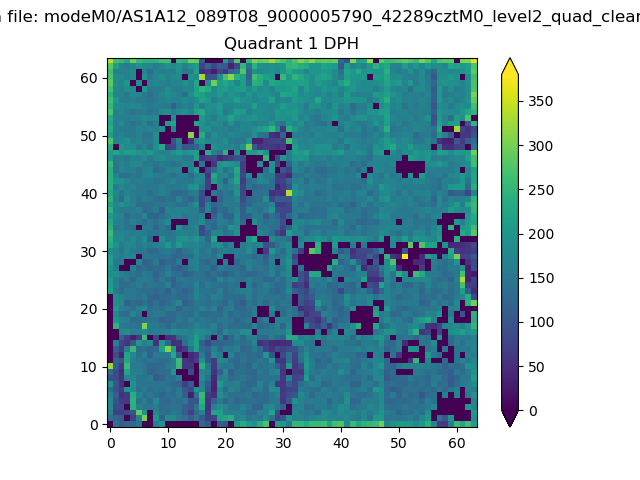
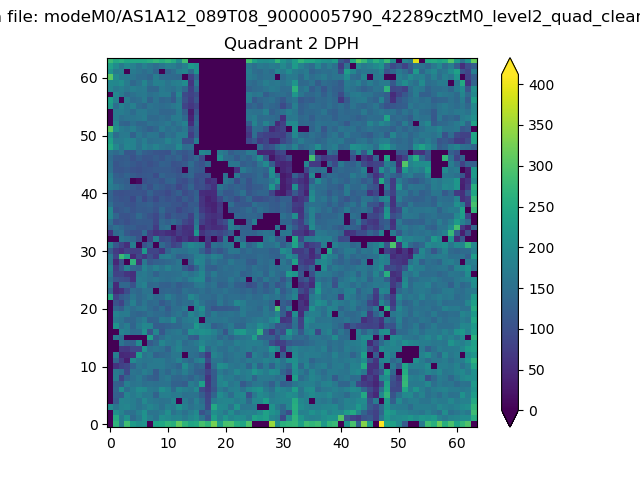
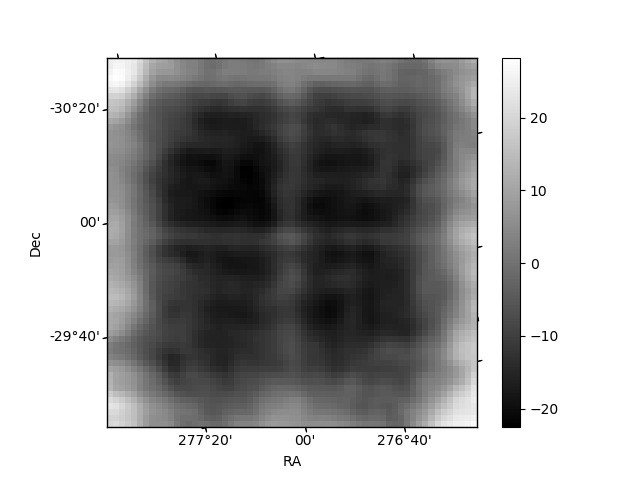
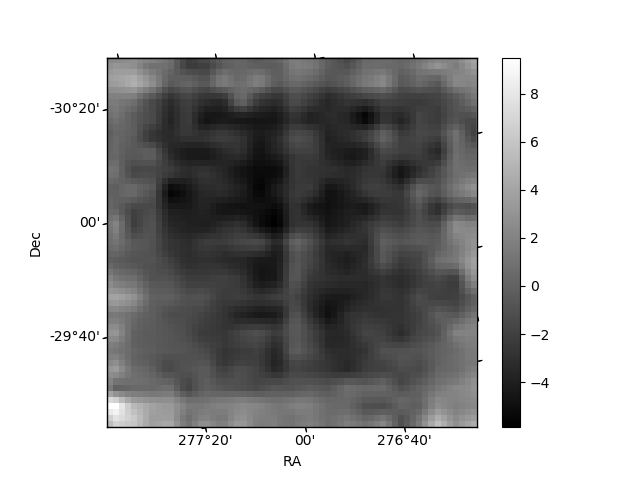
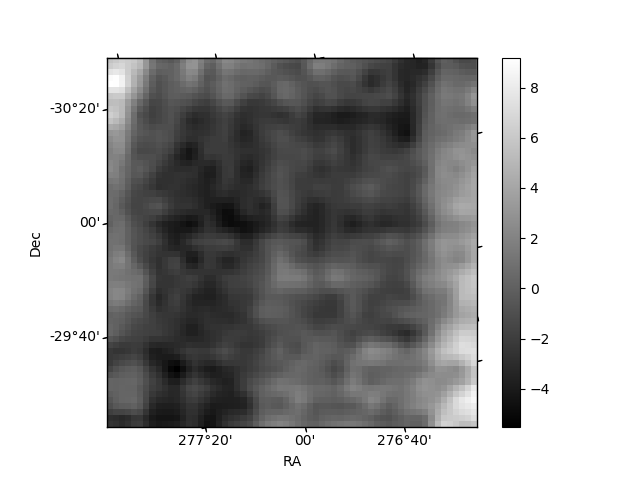
Histogram calculated using DETX and DETY for each event in the final _common_clean file
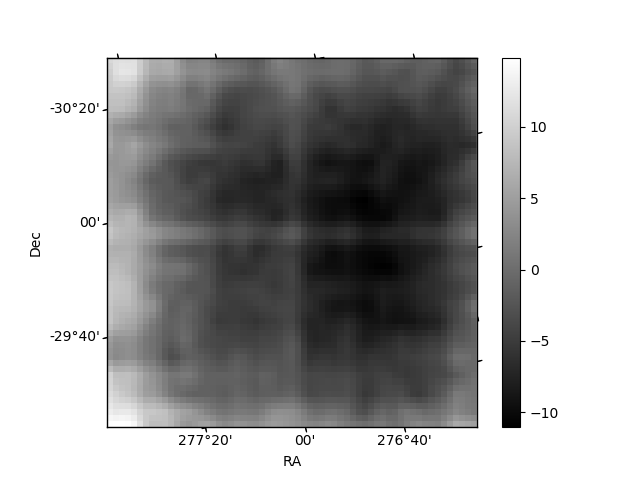
| Quadrant A | 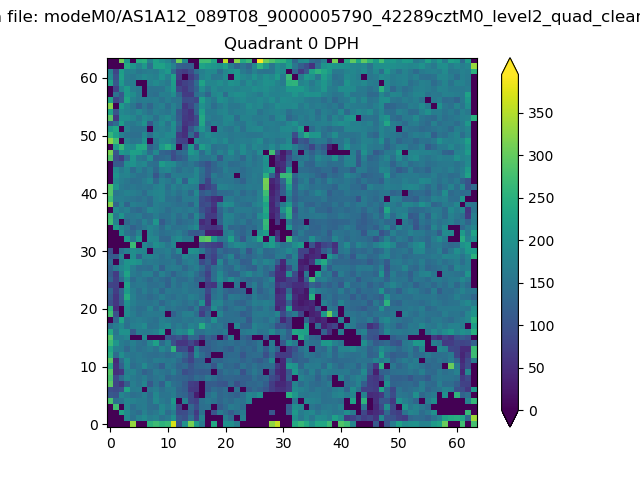 |
 |
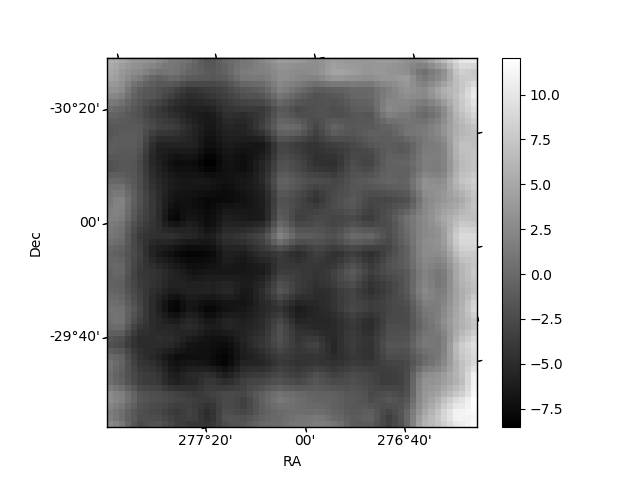
Quadrant B |
|---|---|---|---|
| Quadrant D | 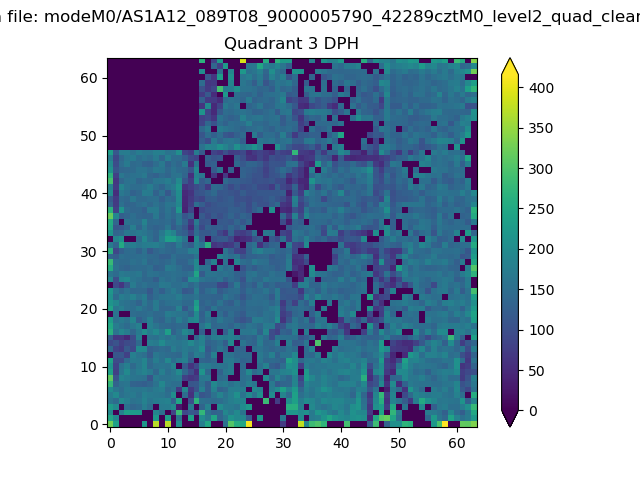 |
 |
Quadrant C |
| Plot type | Count rate plots | Images |
|---|---|---|
| Comparison with Poisson distribution Blue bars denote a histogram of data divided into 1 sec bins. Red curve is a Poisson curve with rate = median count rate of data. |
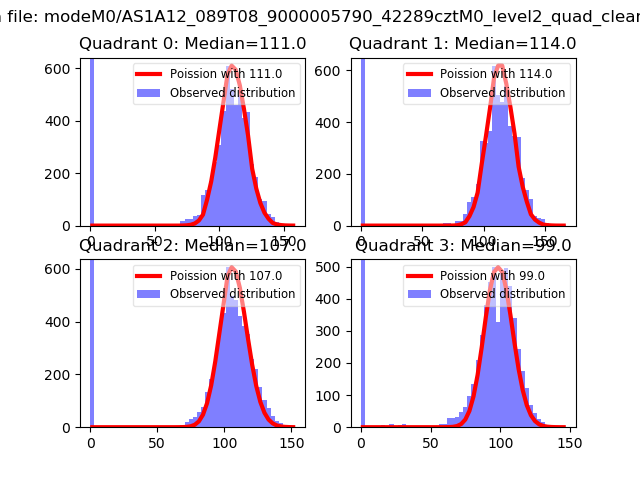 |
 |
| Quadrant-wise count rates Data is divided into 100 sec bins |
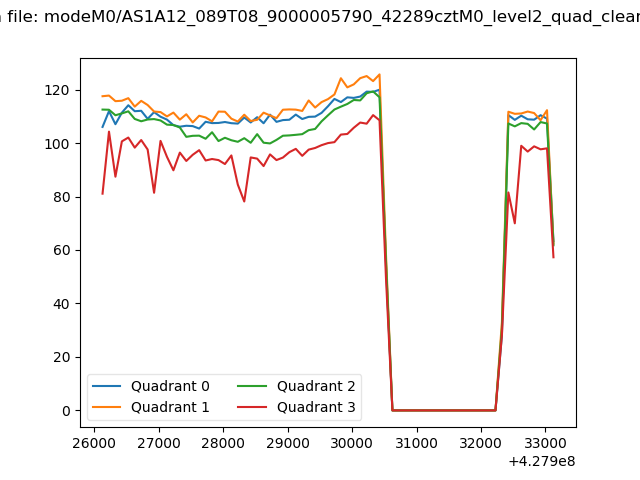 |
|
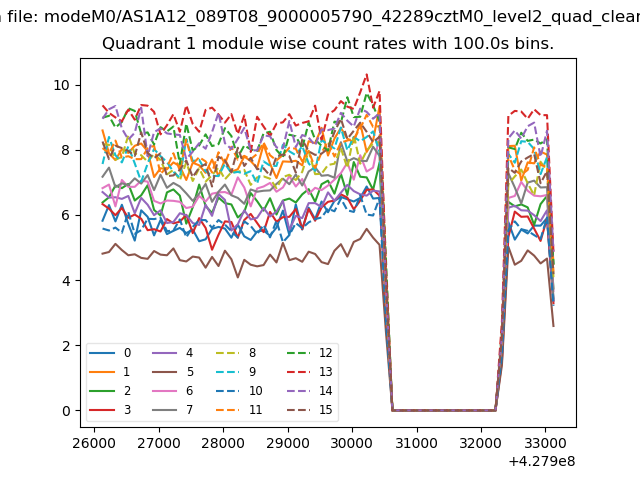
| Module-wise count rates for Quadrant A Data is divided into 100 sec bins |
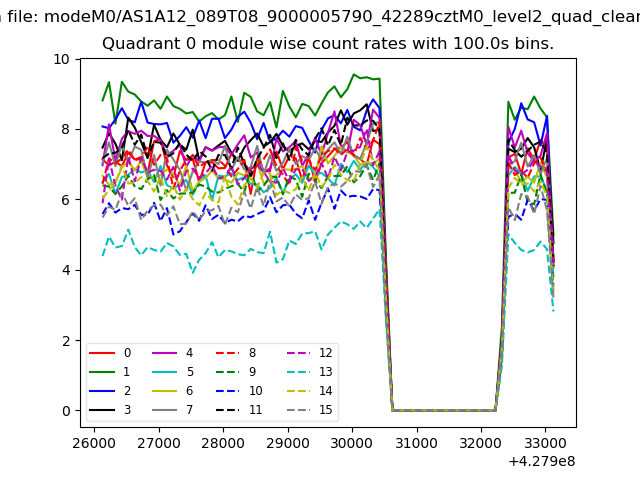 |
 |
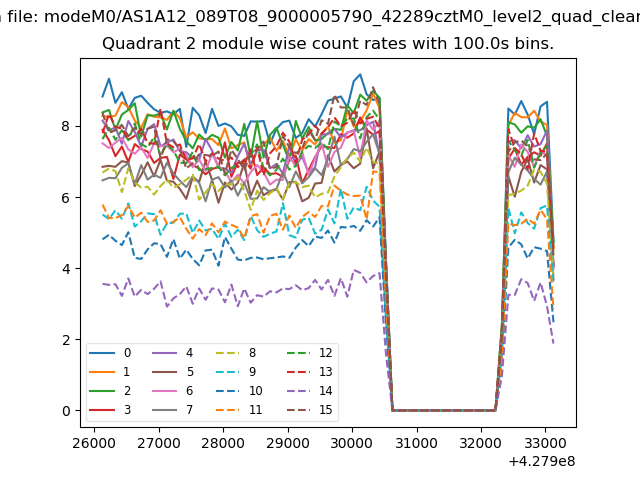
| Module-wise count rates for Quadrant B Data is divided into 100 sec bins |
 |
 |
| Module-wise count rates for Quadrant C Data is divided into 100 sec bins |
 |
 |
| Module-wise count rates for Quadrant D Data is divided into 100 sec bins |
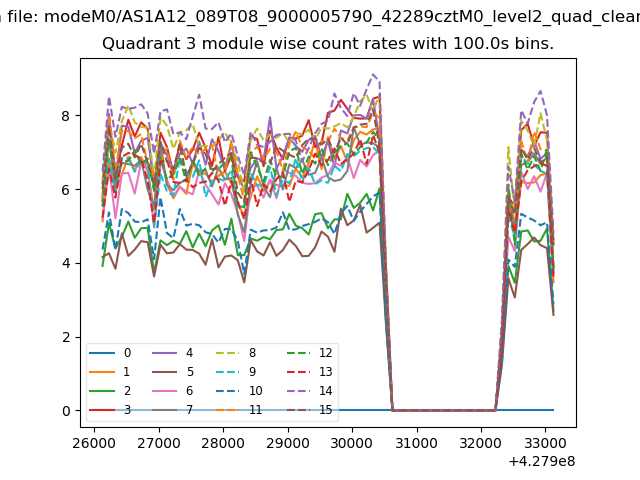 |
 |
| Parameter | Plot |
|---|---|
| CZT HV Monitor | 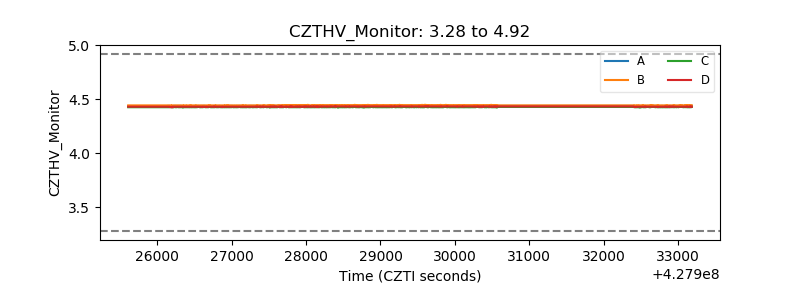 |
| D_VDD | 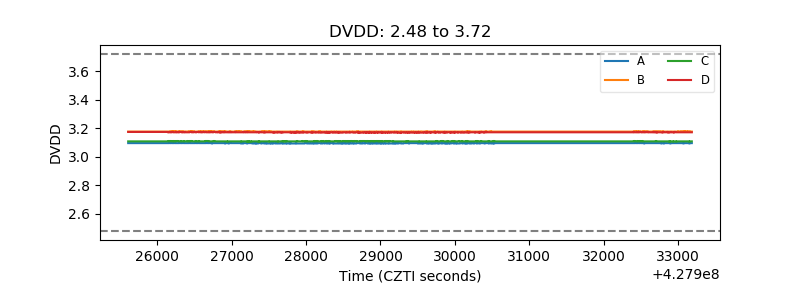 |
| Temperature 1 | 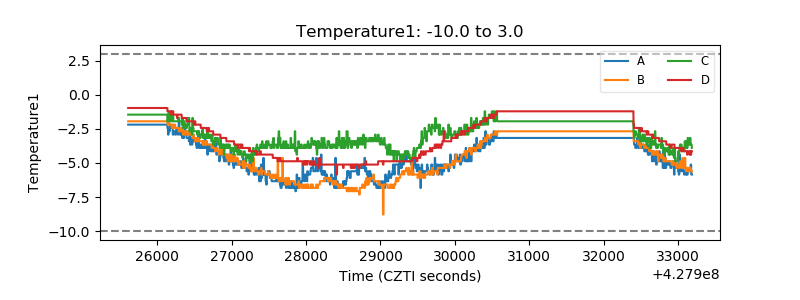 |
| Veto HV Monitor | 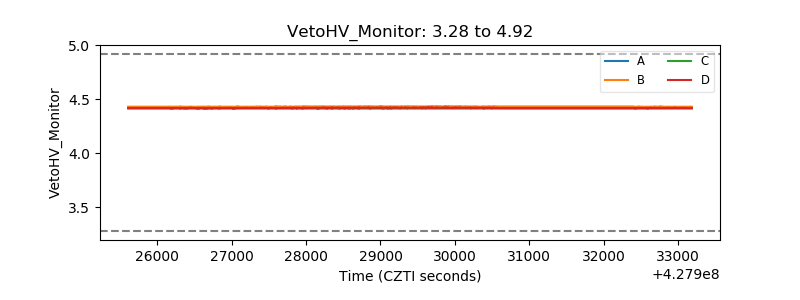 |
| Veto LLD | 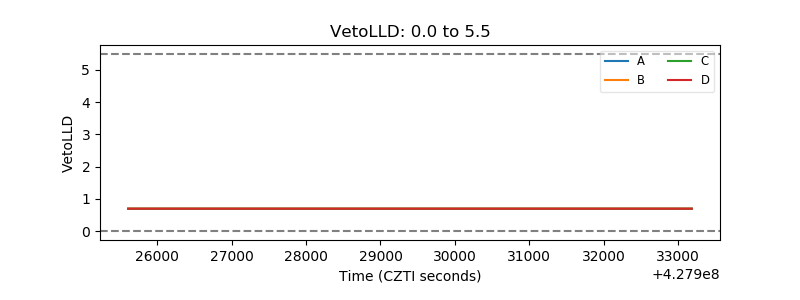 |
| Alpha Counter | 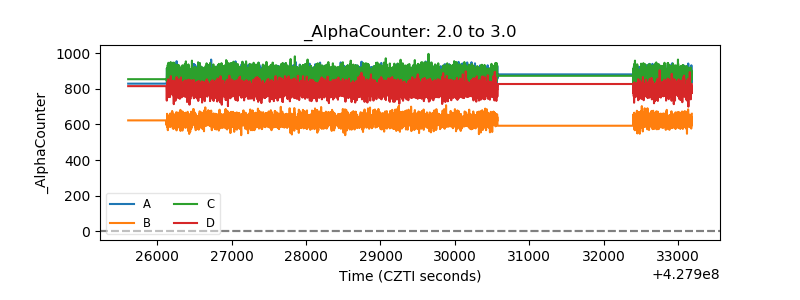 |
| _CPM_Rate | 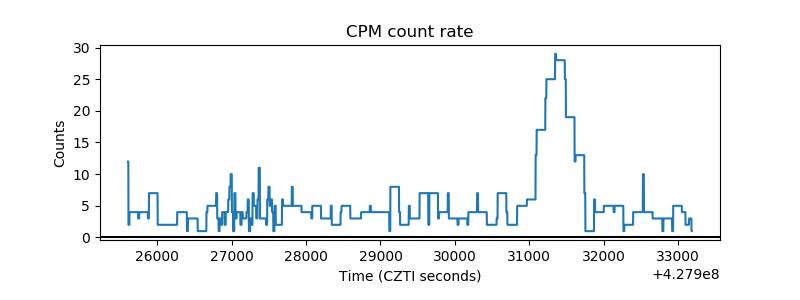 |
| CZT Counter | 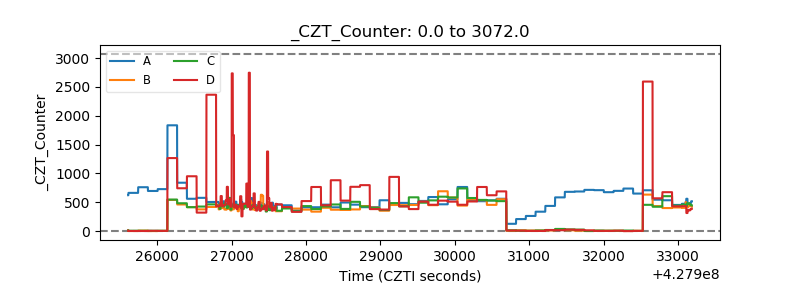 |
| +2.5 Volts monitor | 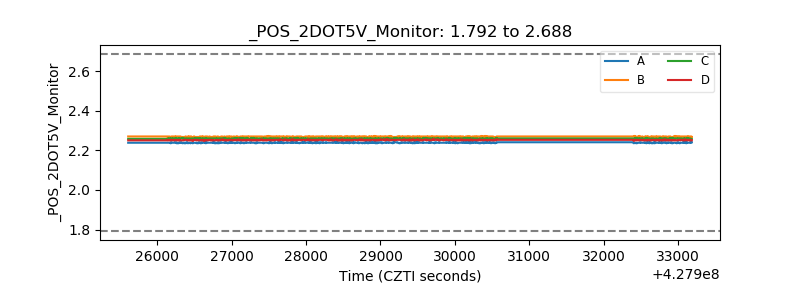 |
| +5 Volts monitor | 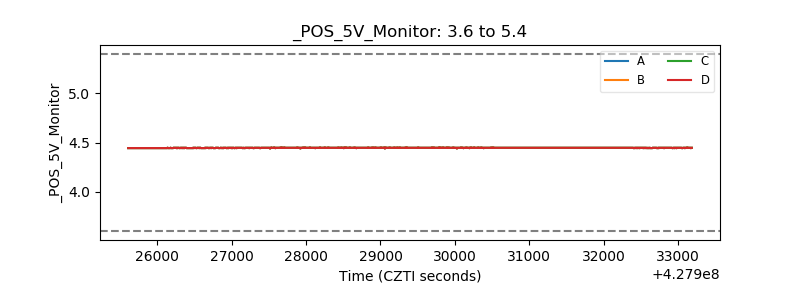 |
| _ROLL_ROT | 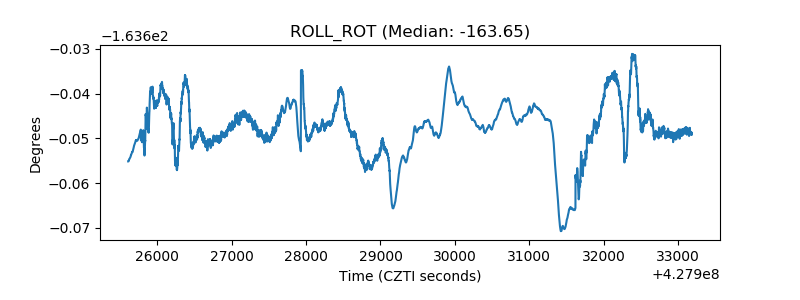 |
| _Roll_DEC | 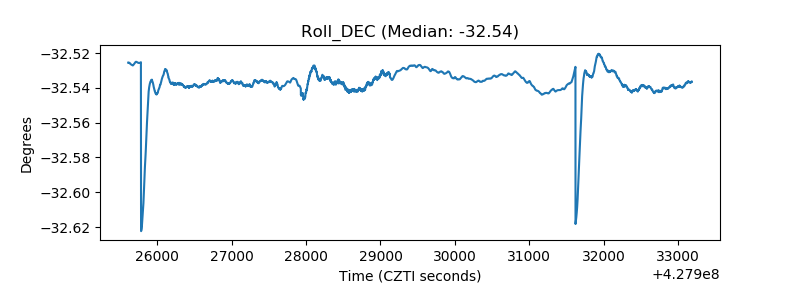 |
| _Roll_RA | 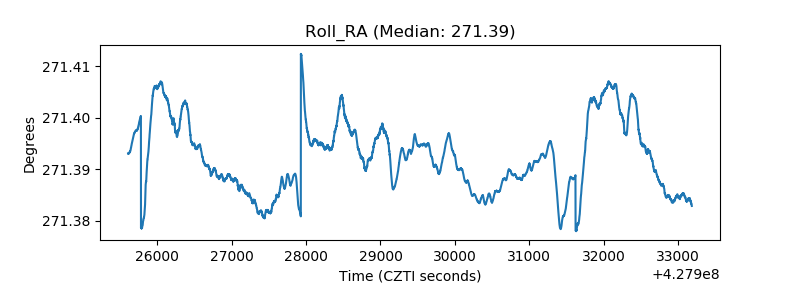 |
| Veto Counter | 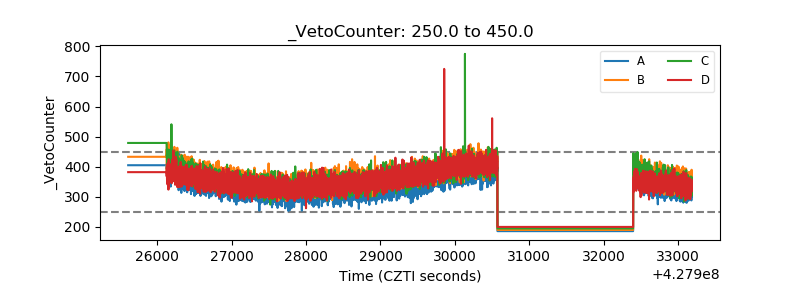 |