| Param | Original file | Final file |
|---|---|---|
| Filename | modeM0/AS1A12_089T08_9000005790_42295cztM0_level2.fits | modeM0/AS1A12_089T08_9000005790_42295cztM0_level2_quad_clean.evt |
| Size (bytes) | 366,917,760 | 97,954,560 |
| Size | 349.9 MB | 93.4 MB |
| Events in quadrant A | 3,381,545 | 652,186 |
| Events in quadrant B | 2,873,007 | 676,564 |
| Events in quadrant C | 2,865,707 | 641,922 |
| Events in quadrant D | 3,990,838 | 572,482 |
| Mode M0 | |||
|---|---|---|---|
| Quadrant | BADHDUFLAG | Total packets | Discarded packets |
| A | 0 | 13513 | 2 |
| B | 0 | 12620 | 2 |
| C | 0 | 12339 | 2 |
| D | 0 | 16034 | 2 |
| Mode SS | |||
|---|---|---|---|
| Quadrant | BADHDUFLAG | Total packets | Discarded packets |
| A | 0 | 126 | 0 |
| B | 0 | 126 | 0 |
| C | 0 | 126 | 0 |
| D | 0 | 126 | 0 |
| Mode M9 | |||
|---|---|---|---|
| Quadrant | BADHDUFLAG | Total packets | Discarded packets |
| A | 0 | 31 | 0 |
| B | 0 | 31 | 0 |
| C | 0 | 31 | 0 |
| D | 0 | 31 | 0 |
| Quadrant | Total seconds | Saturated seconds | Saturation percentage |
|---|---|---|---|
| A | 6049 | 32 | 0.529013% |
| B | 6050 | 24 | 0.396694% |
| C | 6050 | 15 | 0.247934% |
| D | 6049 | 235 | 3.884940% |
Noise dominated data is calculated using 1-second bins in cleaned event files. If a bin has >2000 counts, and if more than 50% of those come from <1% of pixels, then it is considered to be noise-dominated and hence unusable.
| Quadrant | # 1 sec bins | Bins with >0 counts | Bins with >2000 counts | High rate bins dominated by noise | Noise dominated (total time) | Noise dominated (detector-on time) | Marked lightcurve |
|---|---|---|---|---|---|---|---|
| A | 9125 | 6051 | 15 | 15 | 0.16% | 0.25% | 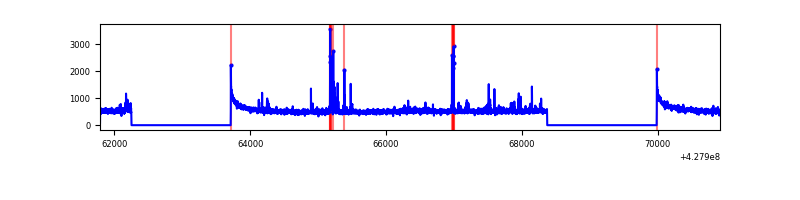 |
| B | 9126 | 6052 | 8 | 8 | 0.09% | 0.13% | 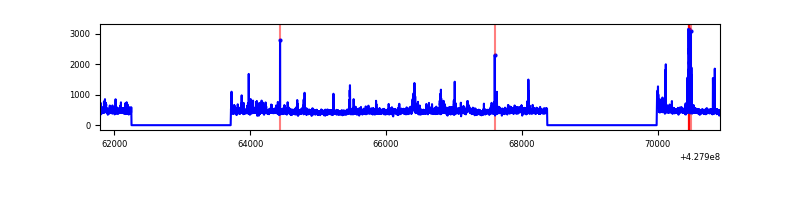 |
| C | 9126 | 6052 | 9 | 9 | 0.10% | 0.15% | 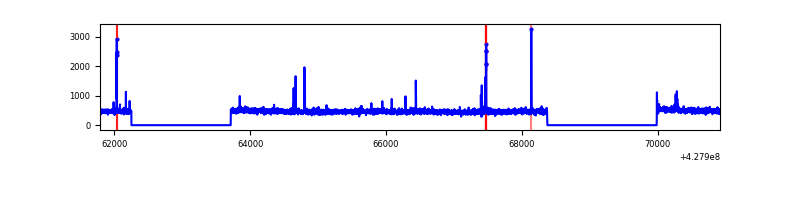 |
| D | 9125 | 6051 | 184 | 184 | 2.02% | 3.04% | 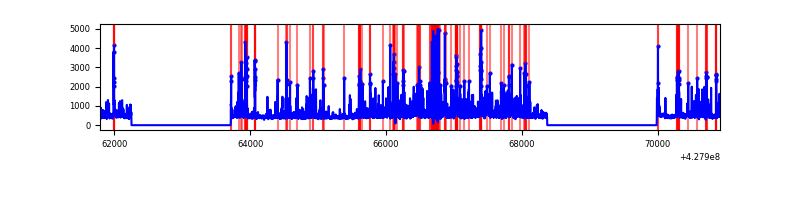 |
Top three noisy pixels from each quadrant. If the there are fewer than three noisy pixels in the level2.evt file, extra rows are filled as -1
| Pixel properties | Quadrant properties | ||||||
|---|---|---|---|---|---|---|---|
| Quadrant | DetID | PixID | Counts | Sigma | Mean | Median | Sigma |
| A | 10 | 83 | 627300 | 4609.61 | 663 | 649 | 135.9 |
| A | 7 | 3 | 92174 | 673.25 | 663 | 649 | 135.9 |
| A | 13 | 248 | 67874 | 494.5 | 663 | 649 | 135.9 |
| B | 3 | 112 | 47773 | 364.69 | 663 | 645 | 129.2 |
| B | 0 | 229 | 42695 | 325.39 | 663 | 645 | 129.2 |
| B | 4 | 171 | 41353 | 315.01 | 663 | 645 | 129.2 |
| C | 15 | 214 | 254148 | 1681.18 | 648 | 651 | 150.8 |
| C | 12 | 249 | 53434 | 350.05 | 648 | 651 | 150.8 |
| C | 7 | 247 | 13330 | 84.09 | 648 | 651 | 150.8 |
| D | 1 | 52 | 847419 | 5432.95 | 635 | 617 | 155.9 |
| D | 12 | 6 | 213737 | 1367.35 | 635 | 617 | 155.9 |
| D | 2 | 249 | 189424 | 1211.36 | 635 | 617 | 155.9 |
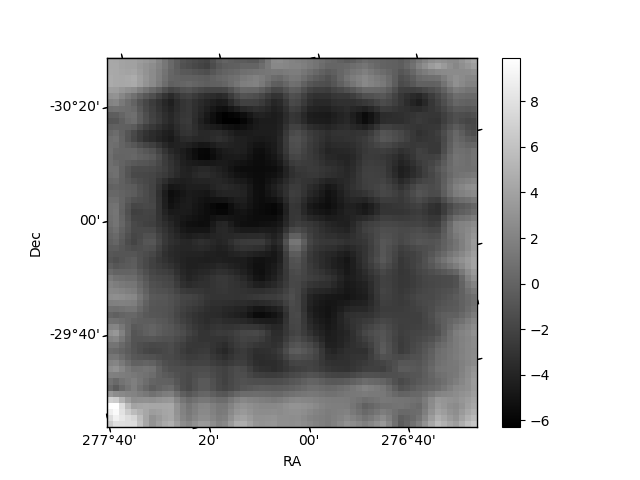
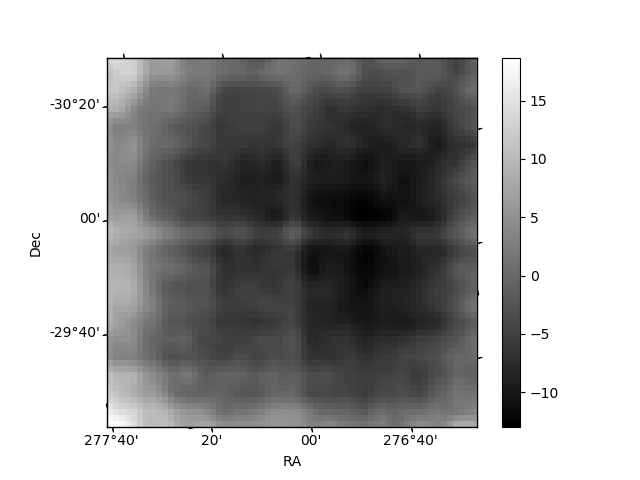
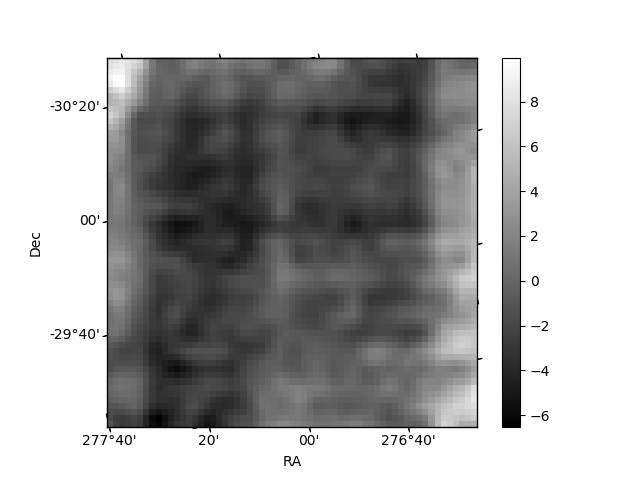
Histogram calculated using DETX and DETY for each event in the final _common_clean file
| Quadrant A | 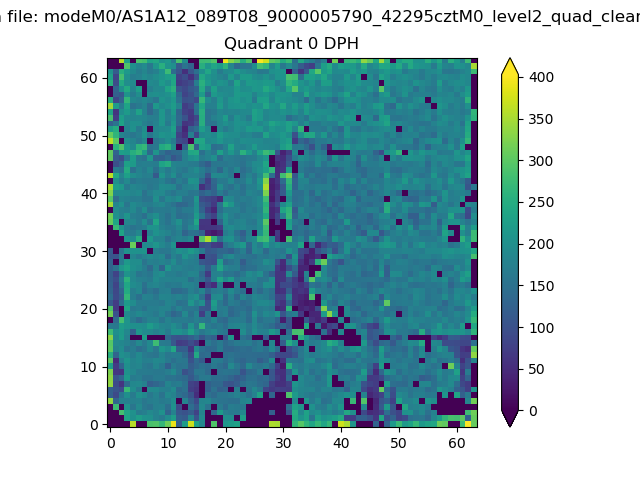 |
 |
Quadrant B |
|---|---|---|---|
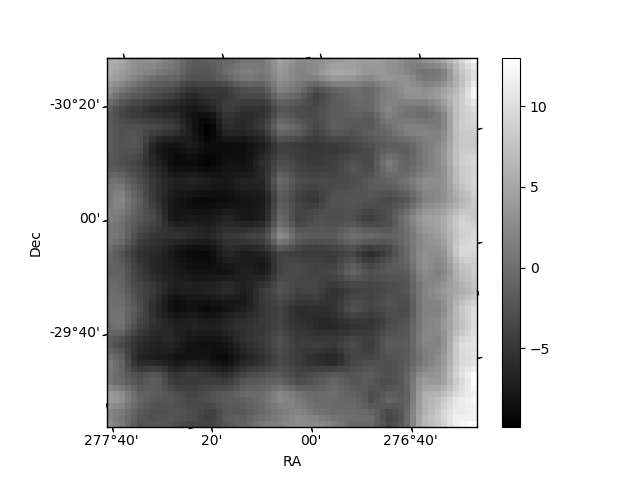
| Quadrant D |  |
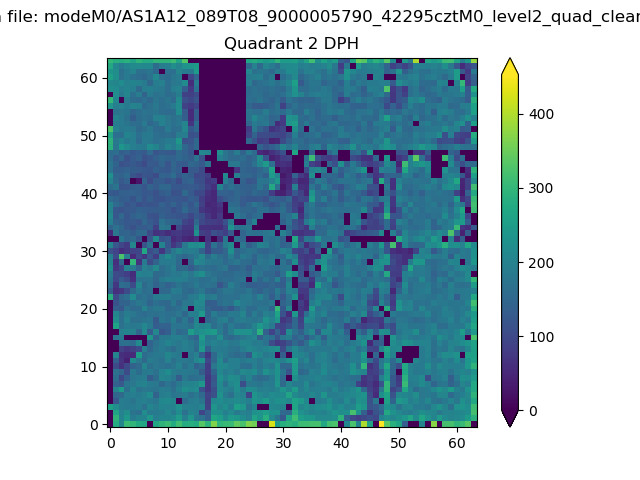 |
Quadrant C |
| Plot type | Count rate plots | Images |
|---|---|---|
| Comparison with Poisson distribution Blue bars denote a histogram of data divided into 1 sec bins. Red curve is a Poisson curve with rate = median count rate of data. |
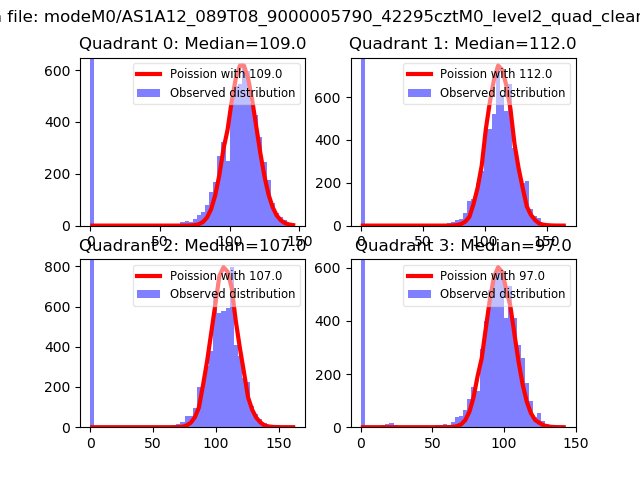 |
 |
| Quadrant-wise count rates Data is divided into 100 sec bins |
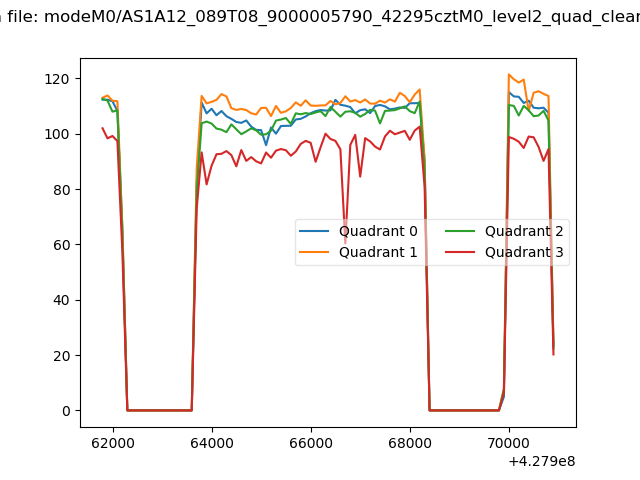 |
|
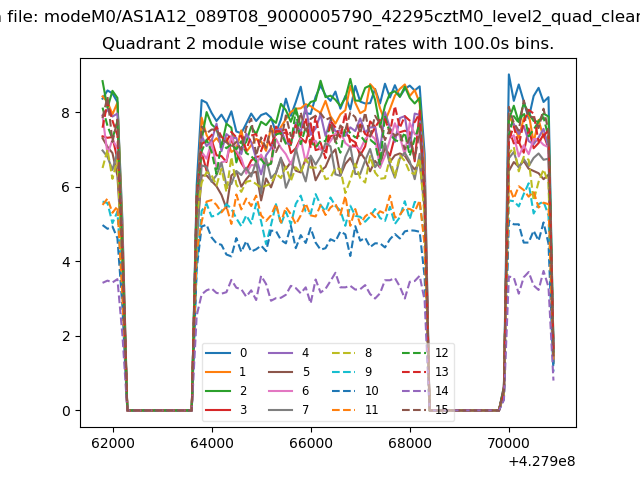
| Module-wise count rates for Quadrant A Data is divided into 100 sec bins |
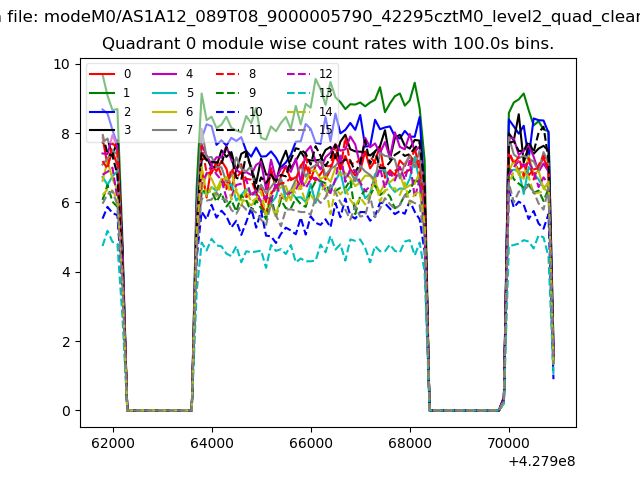 |
 |
| Module-wise count rates for Quadrant B Data is divided into 100 sec bins |
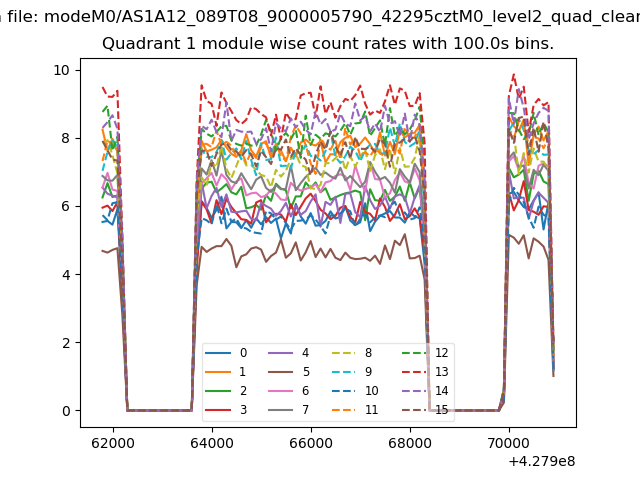 |
 |
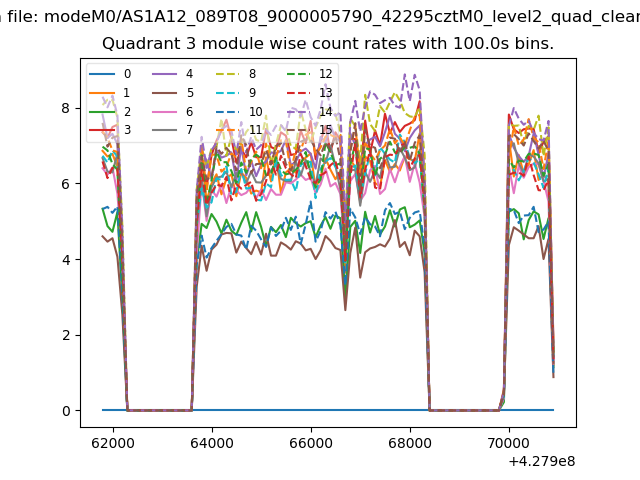
| Module-wise count rates for Quadrant C Data is divided into 100 sec bins |
 |
 |
| Module-wise count rates for Quadrant D Data is divided into 100 sec bins |
 |
 |
| Parameter | Plot |
|---|---|
| CZT HV Monitor |  |
| D_VDD | 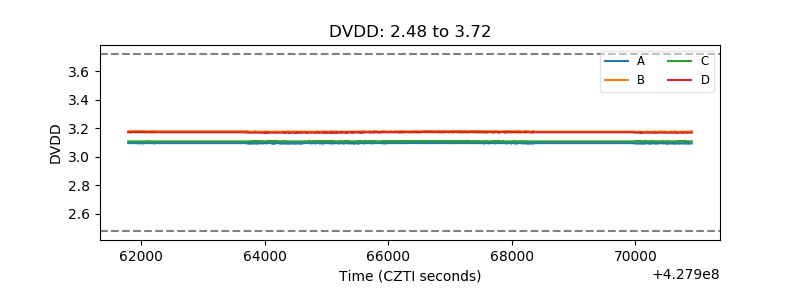 |
| Temperature 1 | 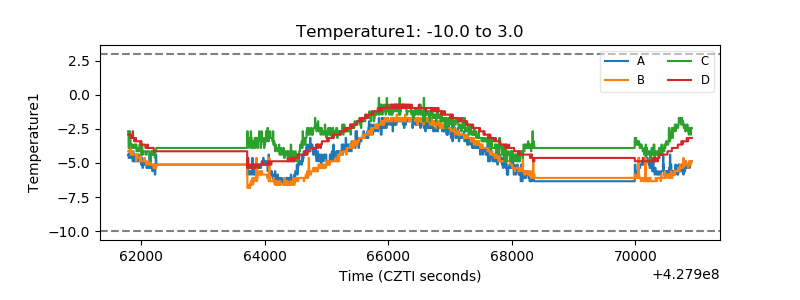 |
| Veto HV Monitor | 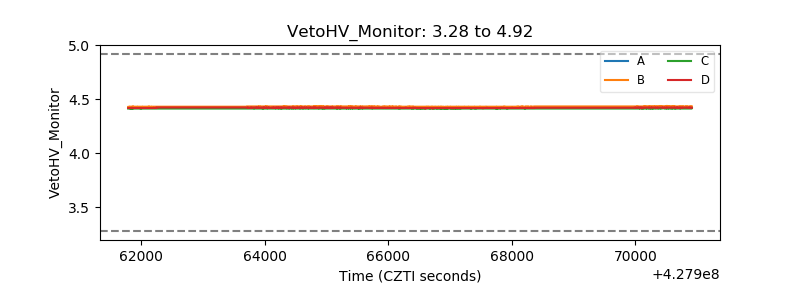 |
| Veto LLD | 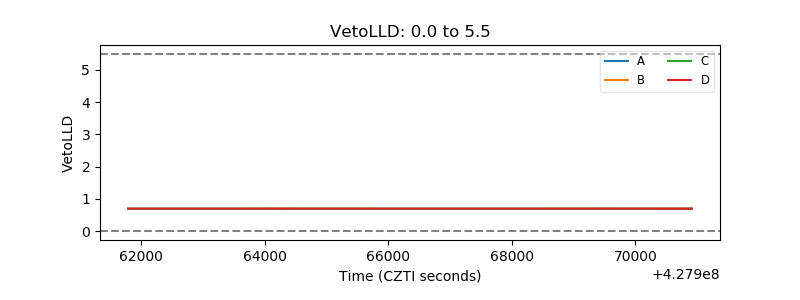 |
| Alpha Counter | 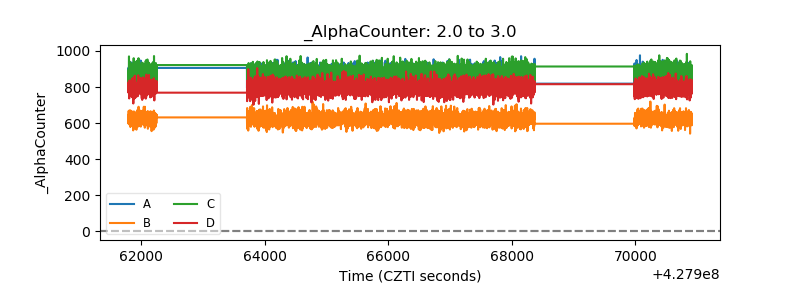 |
| _CPM_Rate | 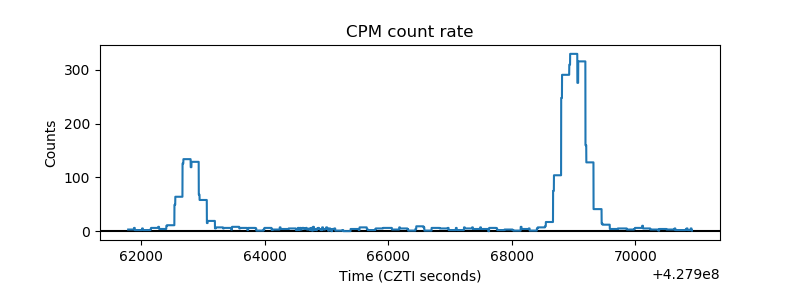 |
| CZT Counter | 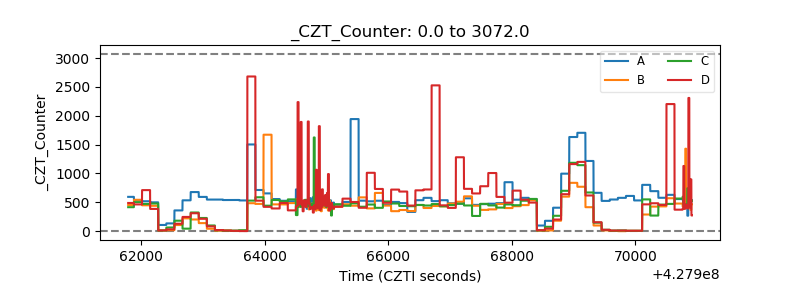 |
| +2.5 Volts monitor | 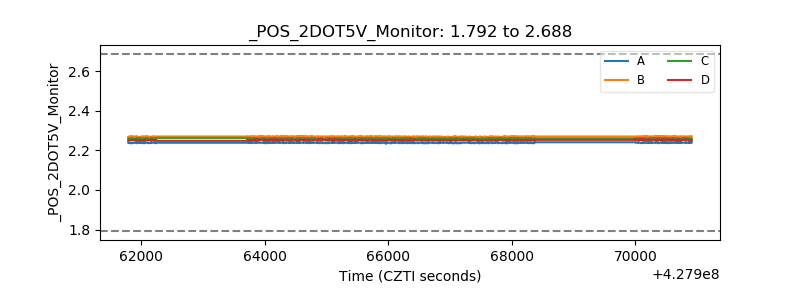 |
| +5 Volts monitor | 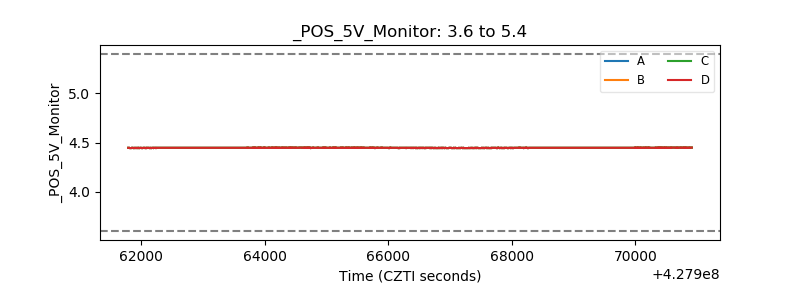 |
| _ROLL_ROT | 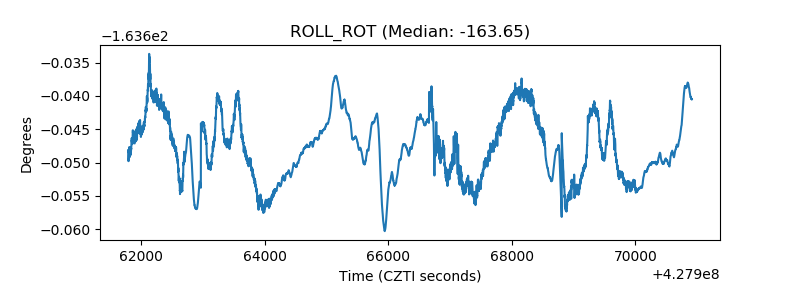 |
| _Roll_DEC | 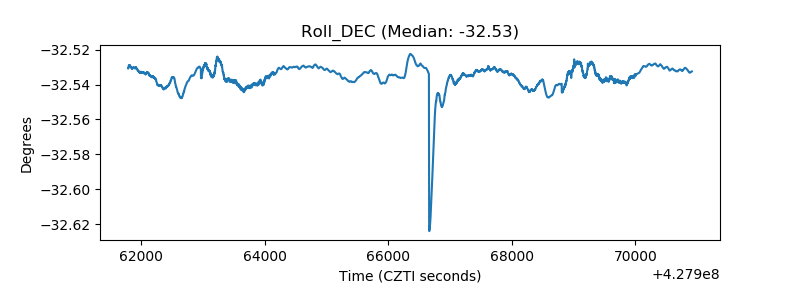 |
| _Roll_RA | 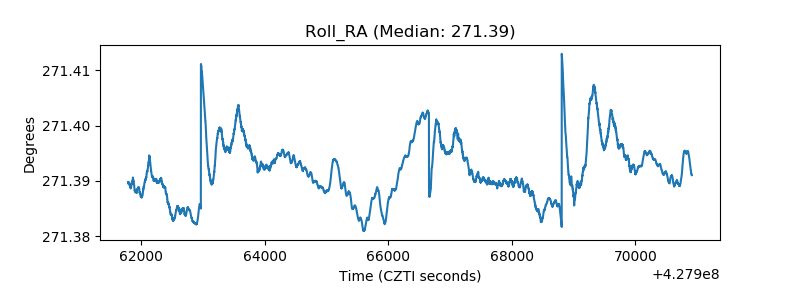 |
| Veto Counter | 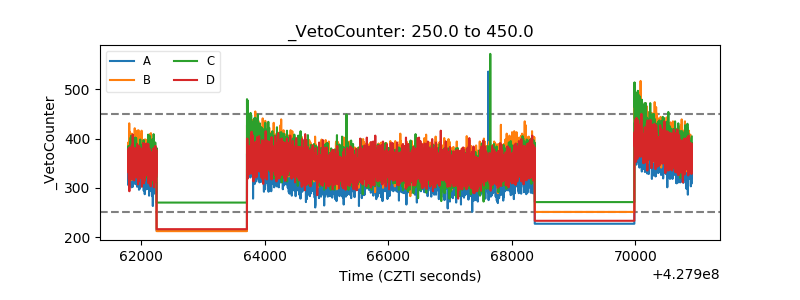 |