| Param | Original file | Final file |
|---|---|---|
| Filename | modeM0/AS1A12_089T08_9000005790_42296cztM0_level2.fits | modeM0/AS1A12_089T08_9000005790_42296cztM0_level2_quad_clean.evt |
| Size (bytes) | 319,331,520 | 90,043,200 |
| Size | 304.5 MB | 85.9 MB |
| Events in quadrant A | 2,965,359 | 600,343 |
| Events in quadrant B | 2,563,227 | 622,439 |
| Events in quadrant C | 2,536,526 | 594,008 |
| Events in quadrant D | 3,335,466 | 532,356 |
| Mode M0 | |||
|---|---|---|---|
| Quadrant | BADHDUFLAG | Total packets | Discarded packets |
| A | 0 | 11942 | 2 |
| B | 0 | 11232 | 2 |
| C | 0 | 10907 | 2 |
| D | 0 | 13506 | 2 |
| Mode SS | |||
|---|---|---|---|
| Quadrant | BADHDUFLAG | Total packets | Discarded packets |
| A | 0 | 110 | 0 |
| B | 0 | 110 | 0 |
| C | 0 | 110 | 0 |
| D | 0 | 110 | 0 |
| Mode M9 | |||
|---|---|---|---|
| Quadrant | BADHDUFLAG | Total packets | Discarded packets |
| A | 0 | 29 | 0 |
| B | 0 | 30 | 0 |
| C | 0 | 30 | 0 |
| D | 0 | 30 | 0 |
| Quadrant | Total seconds | Saturated seconds | Saturation percentage |
|---|---|---|---|
| A | 5389 | 23 | 0.426795% |
| B | 5389 | 24 | 0.445352% |
| C | 5389 | 7 | 0.129894% |
| D | 5389 | 141 | 2.616441% |
Noise dominated data is calculated using 1-second bins in cleaned event files. If a bin has >2000 counts, and if more than 50% of those come from <1% of pixels, then it is considered to be noise-dominated and hence unusable.
| Quadrant | # 1 sec bins | Bins with >0 counts | Bins with >2000 counts | High rate bins dominated by noise | Noise dominated (total time) | Noise dominated (detector-on time) | Marked lightcurve |
|---|---|---|---|---|---|---|---|
| A | 7091 | 5390 | 8 | 8 | 0.11% | 0.15% | 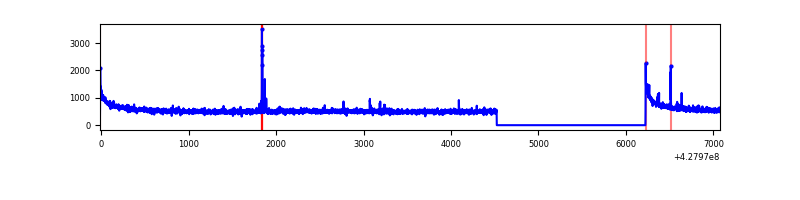 |
| B | 7091 | 5390 | 9 | 9 | 0.13% | 0.17% | 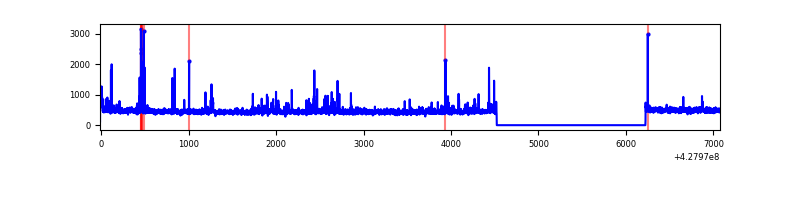 |
| C | 7091 | 5390 | 1 | 1 | 0.01% | 0.02% | 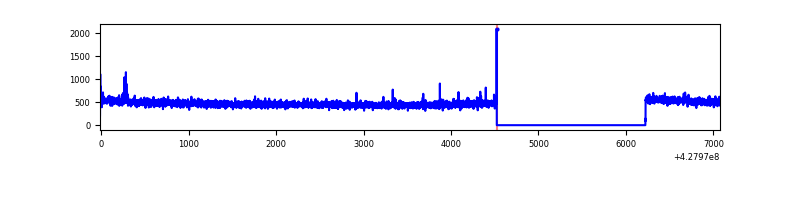 |
| D | 7091 | 5390 | 113 | 113 | 1.59% | 2.10% | 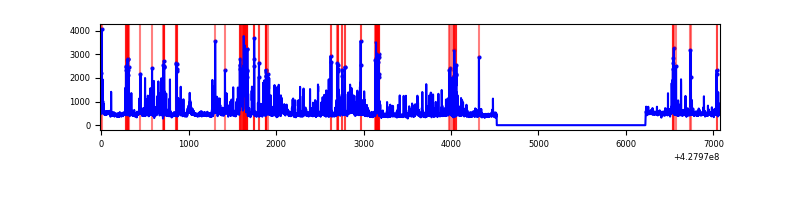 |
Top three noisy pixels from each quadrant. If the there are fewer than three noisy pixels in the level2.evt file, extra rows are filled as -1
| Pixel properties | Quadrant properties | ||||||
|---|---|---|---|---|---|---|---|
| Quadrant | DetID | PixID | Counts | Sigma | Mean | Median | Sigma |
| A | 10 | 83 | 560561 | 4528.57 | 603 | 590 | 123.7 |
| A | 13 | 248 | 29803 | 236.25 | 603 | 590 | 123.7 |
| A | 2 | 79 | 21735 | 171.0 | 603 | 590 | 123.7 |
| B | 4 | 171 | 54089 | 456.44 | 599 | 582 | 117.2 |
| B | 3 | 112 | 51114 | 431.06 | 599 | 582 | 117.2 |
| B | 0 | 245 | 25101 | 209.16 | 599 | 582 | 117.2 |
| C | 15 | 214 | 226990 | 1656.86 | 586 | 590 | 136.6 |
| C | 12 | 249 | 11366 | 78.86 | 586 | 590 | 136.6 |
| C | 15 | 159 | 7969 | 54.0 | 586 | 590 | 136.6 |
| D | 1 | 52 | 410617 | 2887.68 | 580 | 562 | 142.0 |
| D | 12 | 233 | 205225 | 1441.27 | 580 | 562 | 142.0 |
| D | 12 | 6 | 183974 | 1291.62 | 580 | 562 | 142.0 |
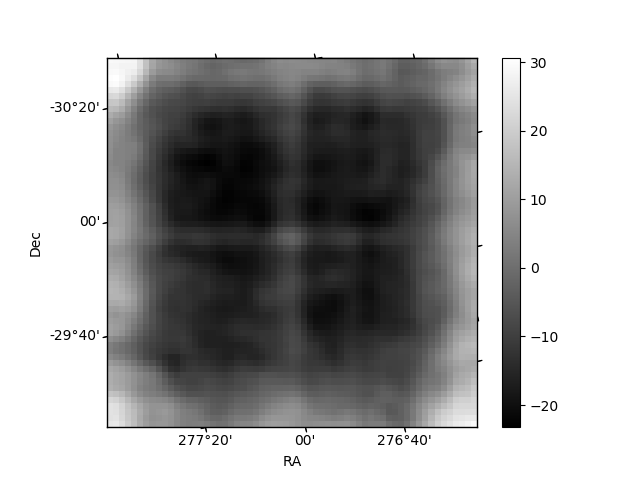
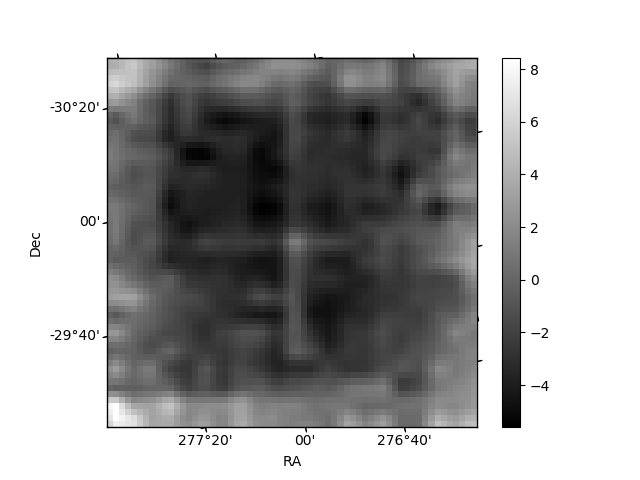
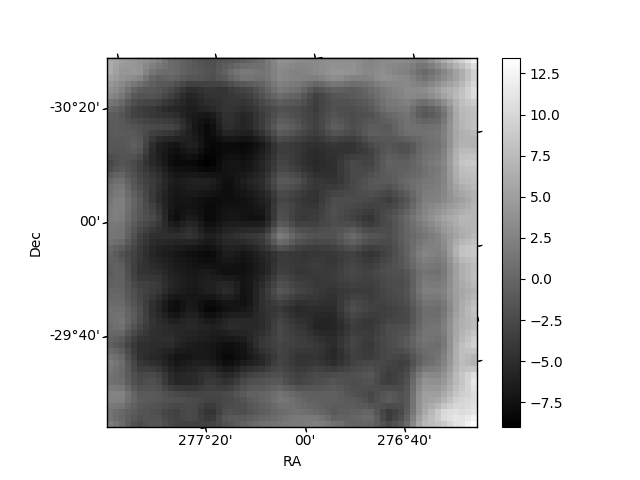
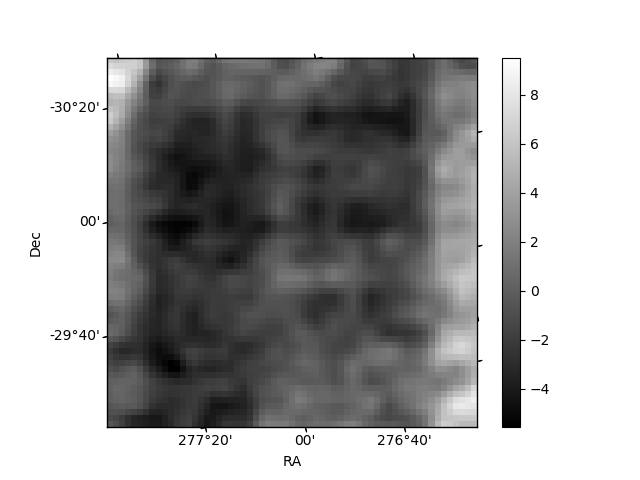
Histogram calculated using DETX and DETY for each event in the final _common_clean file
| Quadrant A | 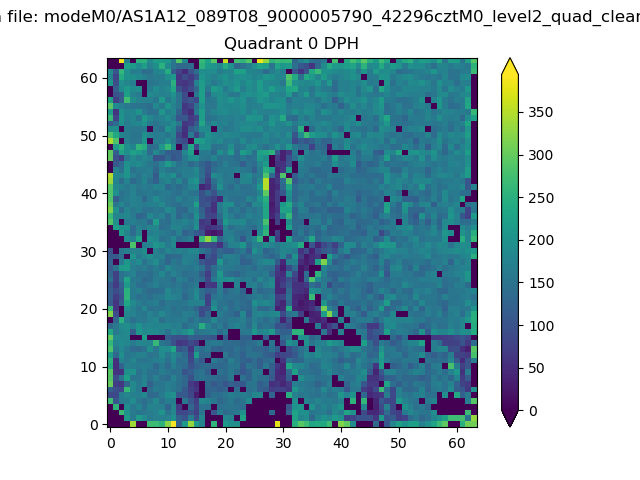 |
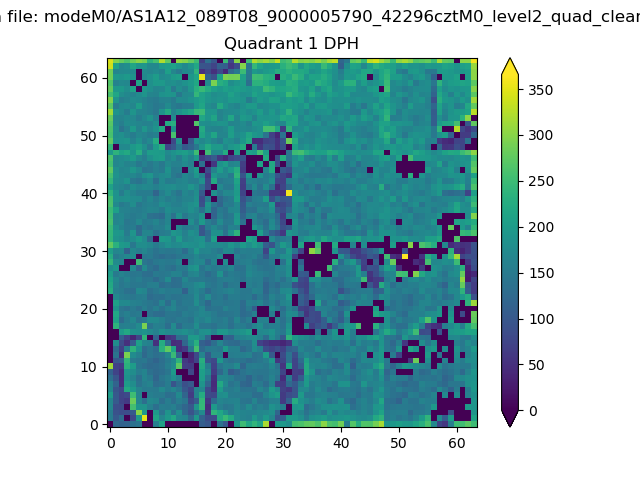 |
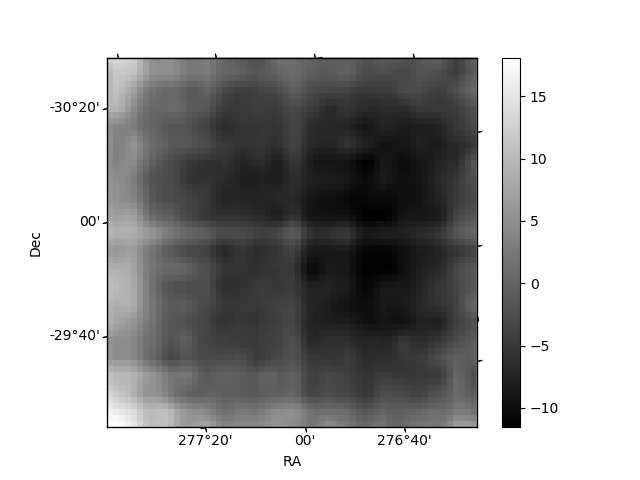
Quadrant B |
|---|---|---|---|
| Quadrant D | 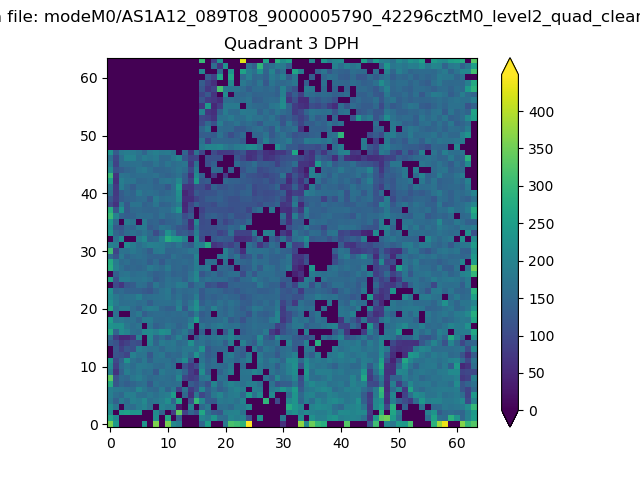 |
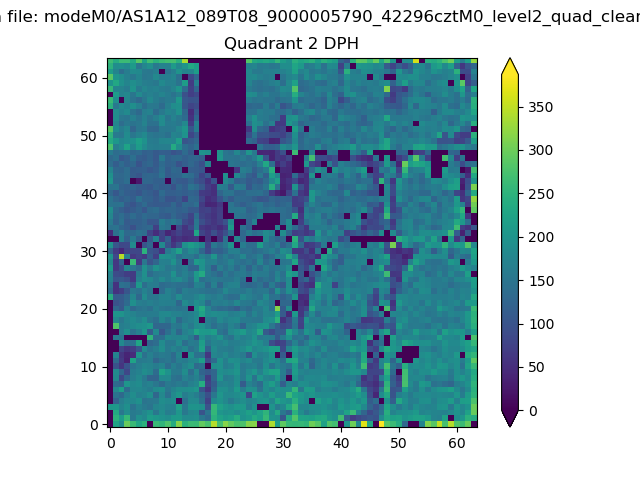 |
Quadrant C |
| Plot type | Count rate plots | Images |
|---|---|---|
| Comparison with Poisson distribution Blue bars denote a histogram of data divided into 1 sec bins. Red curve is a Poisson curve with rate = median count rate of data. |
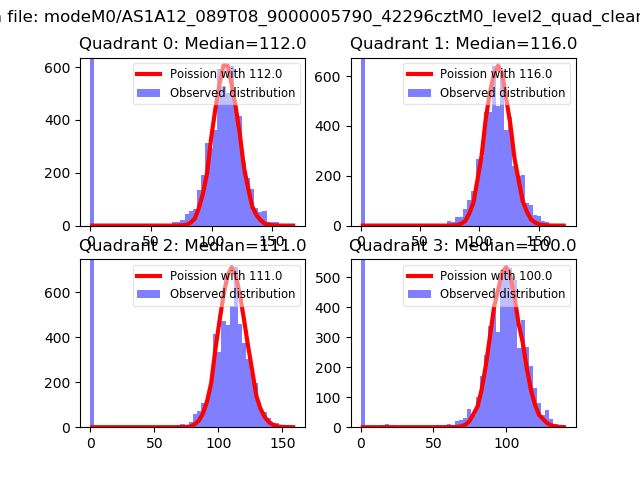 |
 |
| Quadrant-wise count rates Data is divided into 100 sec bins |
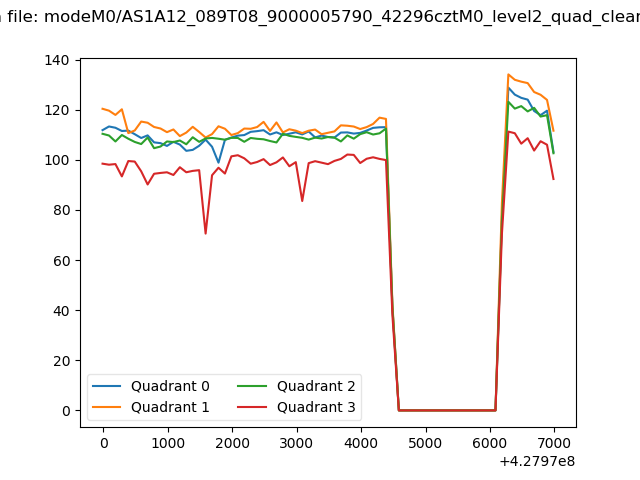 |
|
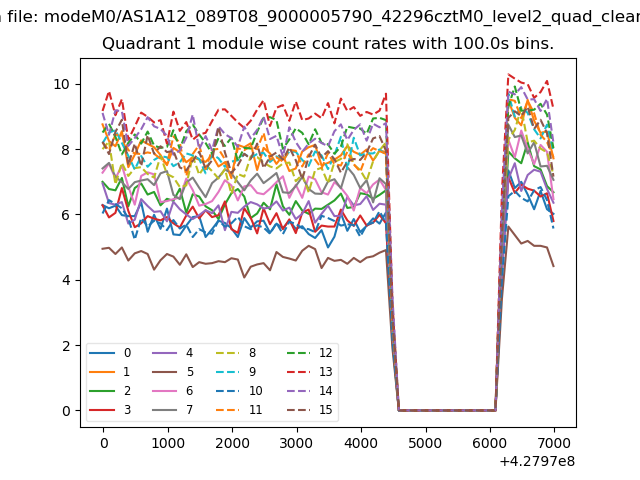
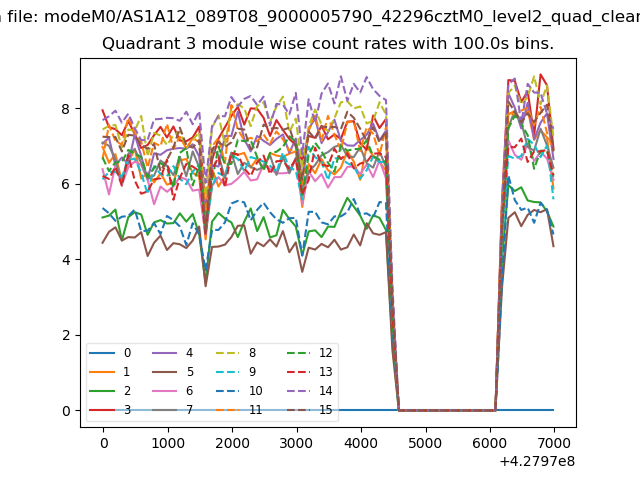
| Module-wise count rates for Quadrant A Data is divided into 100 sec bins |
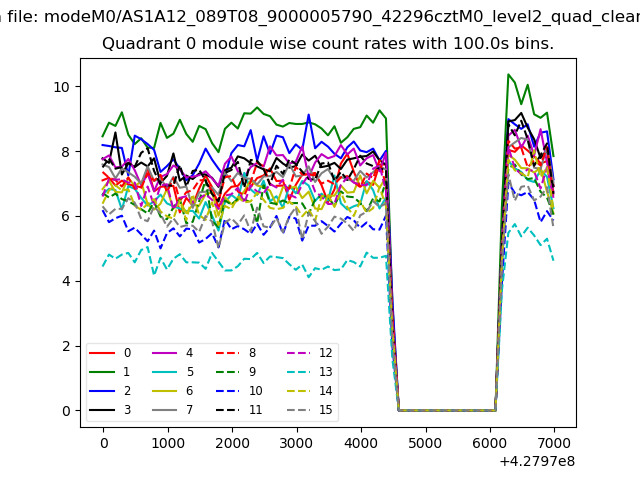 |
 |
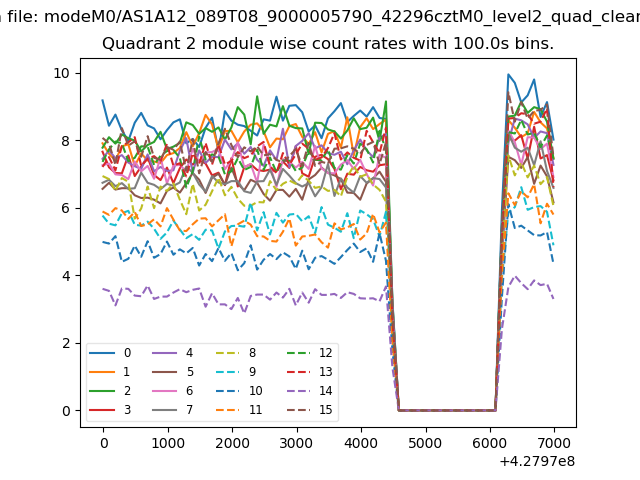
| Module-wise count rates for Quadrant B Data is divided into 100 sec bins |
 |
 |
| Module-wise count rates for Quadrant C Data is divided into 100 sec bins |
 |
 |
| Module-wise count rates for Quadrant D Data is divided into 100 sec bins |
 |
 |
| Parameter | Plot |
|---|---|
| CZT HV Monitor | 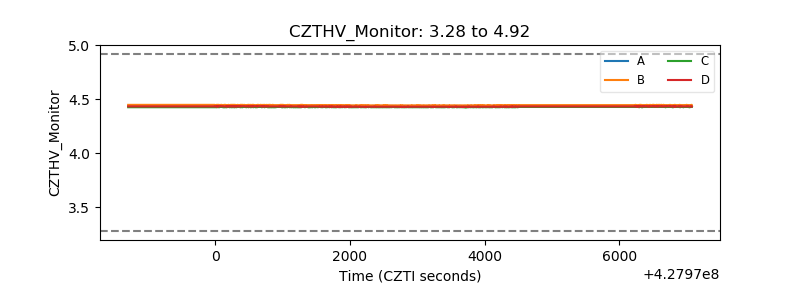 |
| D_VDD | 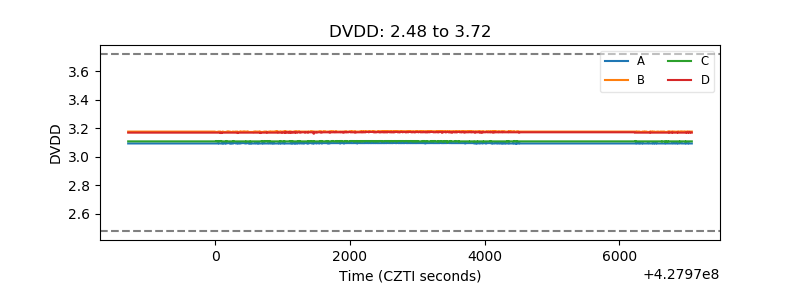 |
| Temperature 1 | 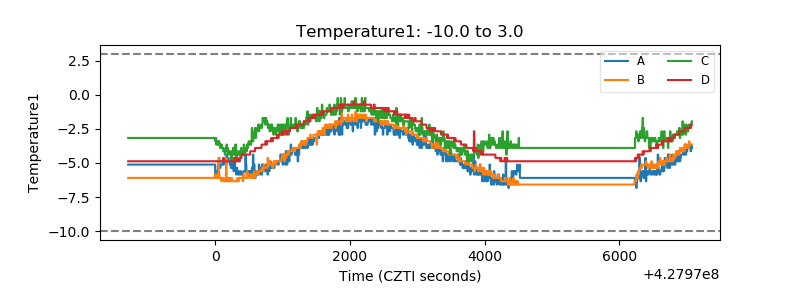 |
| Veto HV Monitor | 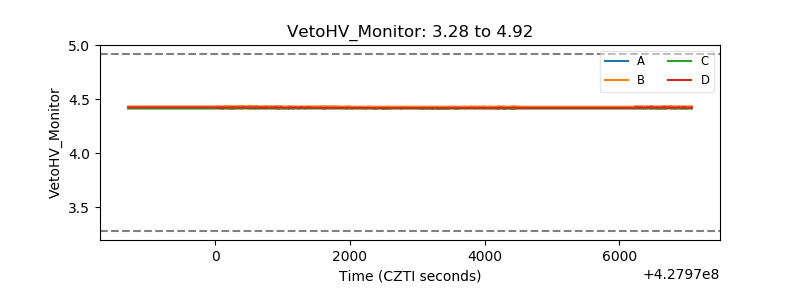 |
| Veto LLD | 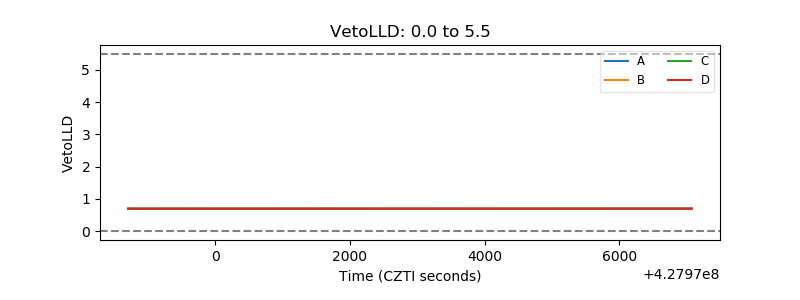 |
| Alpha Counter | 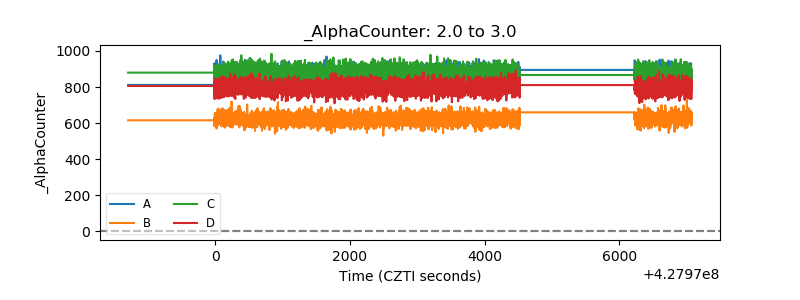 |
| _CPM_Rate | 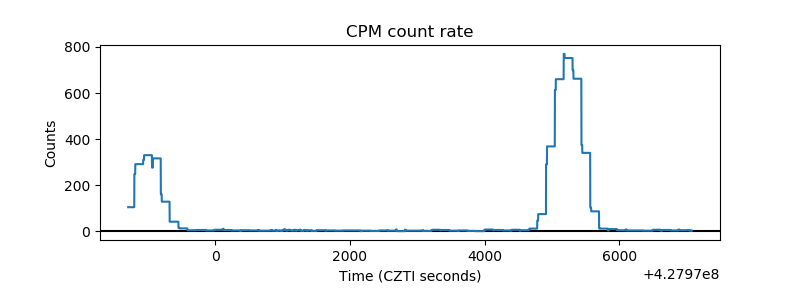 |
| CZT Counter | 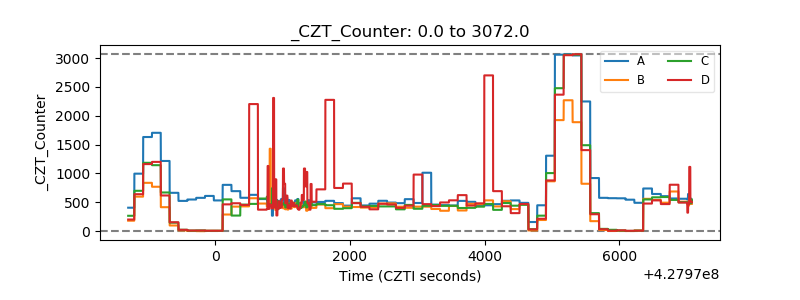 |
| +2.5 Volts monitor | 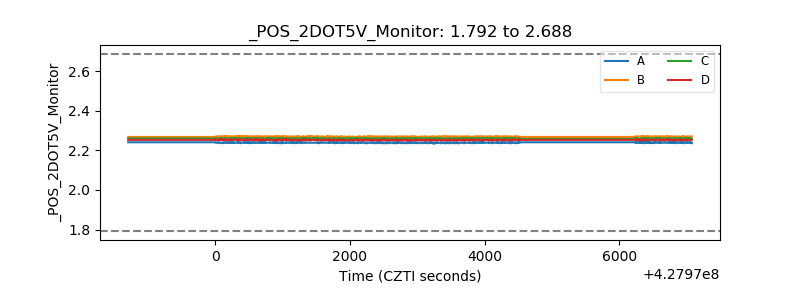 |
| +5 Volts monitor | 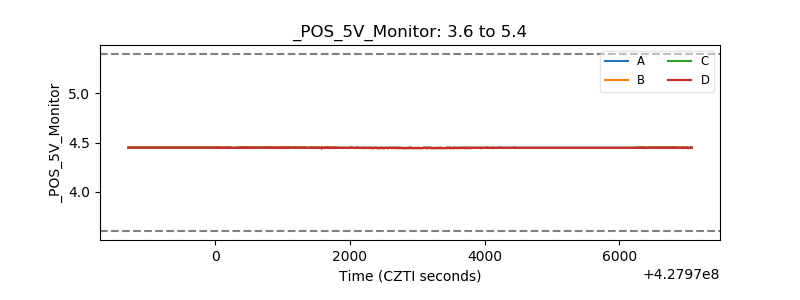 |
| _ROLL_ROT | 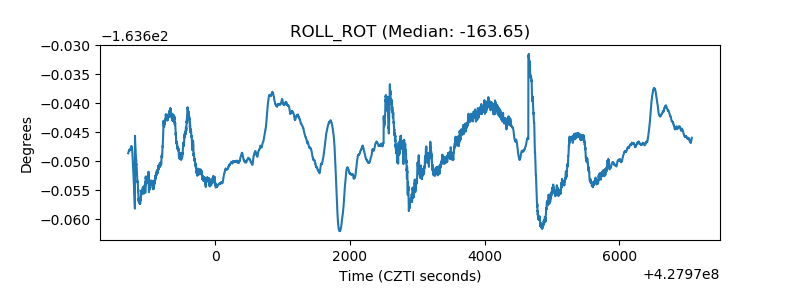 |
| _Roll_DEC | 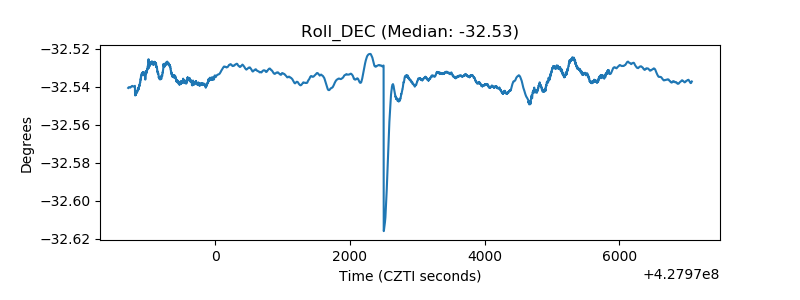 |
| _Roll_RA | 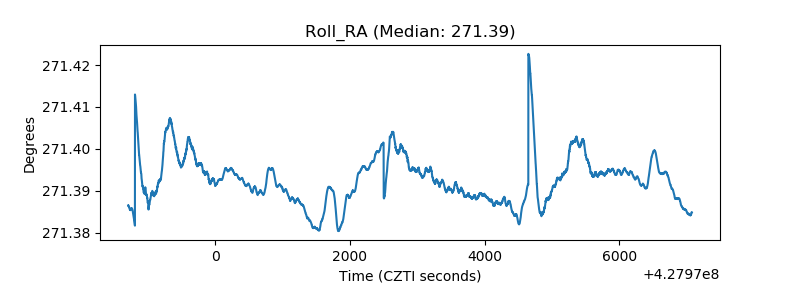 |
| Veto Counter | 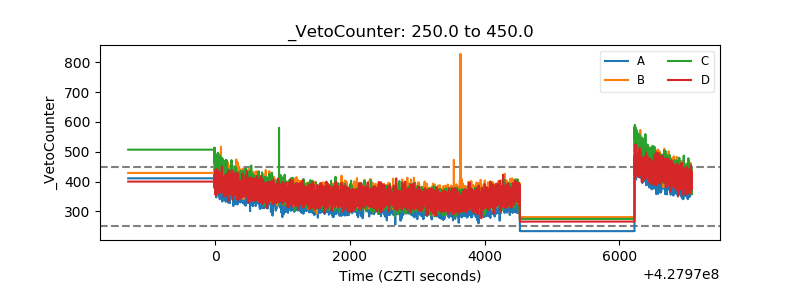 |