| Param | Original file | Final file |
|---|---|---|
| Filename | modeM0/AS1A12_089T08_9000005790_42298cztM0_level2.fits | modeM0/AS1A12_089T08_9000005790_42298cztM0_level2_quad_clean.evt |
| Size (bytes) | 353,551,680 | 102,677,760 |
| Size | 337.2 MB | 97.9 MB |
| Events in quadrant A | 3,256,560 | 691,539 |
| Events in quadrant B | 2,991,958 | 712,890 |
| Events in quadrant C | 2,813,652 | 681,781 |
| Events in quadrant D | 3,567,697 | 612,380 |
| Mode M0 | |||
|---|---|---|---|
| Quadrant | BADHDUFLAG | Total packets | Discarded packets |
| A | 0 | 13159 | 3 |
| B | 0 | 12640 | 2 |
| C | 0 | 12013 | 2 |
| D | 0 | 14478 | 2 |
| Mode SS | |||
|---|---|---|---|
| Quadrant | BADHDUFLAG | Total packets | Discarded packets |
| A | 0 | 122 | 0 |
| B | 0 | 122 | 0 |
| C | 0 | 122 | 0 |
| D | 0 | 122 | 0 |
| Mode M9 | |||
|---|---|---|---|
| Quadrant | BADHDUFLAG | Total packets | Discarded packets |
| A | 0 | 35 | 0 |
| B | 0 | 35 | 0 |
| C | 0 | 35 | 0 |
| D | 0 | 35 | 0 |
| Quadrant | Total seconds | Saturated seconds | Saturation percentage |
|---|---|---|---|
| A | 5874 | 16 | 0.272387% |
| B | 5875 | 30 | 0.510638% |
| C | 5875 | 4 | 0.068085% |
| D | 5875 | 171 | 2.910638% |
Noise dominated data is calculated using 1-second bins in cleaned event files. If a bin has >2000 counts, and if more than 50% of those come from <1% of pixels, then it is considered to be noise-dominated and hence unusable.
| Quadrant | # 1 sec bins | Bins with >0 counts | Bins with >2000 counts | High rate bins dominated by noise | Noise dominated (total time) | Noise dominated (detector-on time) | Marked lightcurve |
|---|---|---|---|---|---|---|---|
| A | 9428 | 5876 | 4 | 4 | 0.04% | 0.07% | 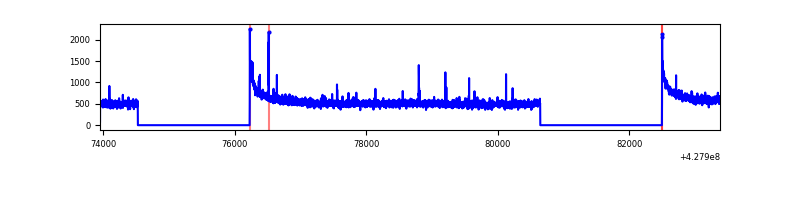 |
| B | 9429 | 5877 | 19 | 19 | 0.20% | 0.32% | 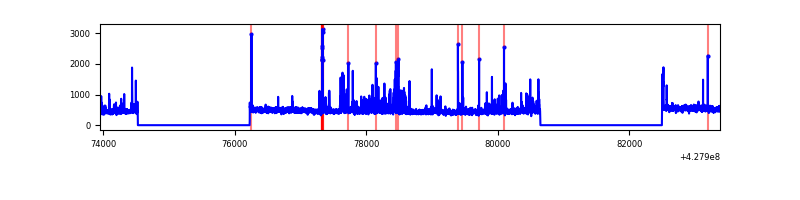 |
| C | 9429 | 5877 | 1 | 1 | 0.01% | 0.02% | 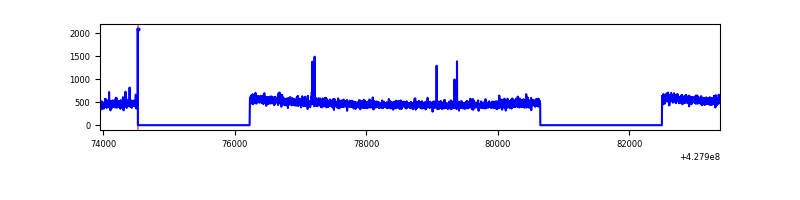 |
| D | 9429 | 5877 | 139 | 139 | 1.47% | 2.37% | 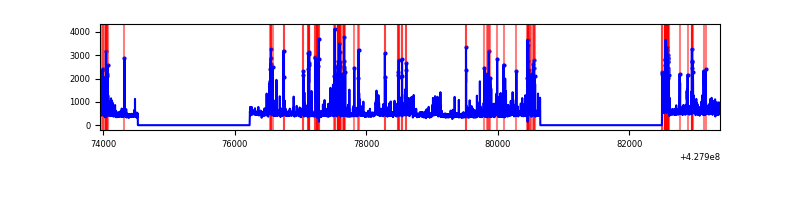 |
Top three noisy pixels from each quadrant. If the there are fewer than three noisy pixels in the level2.evt file, extra rows are filled as -1
| Pixel properties | Quadrant properties | ||||||
|---|---|---|---|---|---|---|---|
| Quadrant | DetID | PixID | Counts | Sigma | Mean | Median | Sigma |
| A | 10 | 83 | 596492 | 4303.13 | 677 | 666 | 138.5 |
| A | 7 | 3 | 15997 | 110.72 | 677 | 666 | 138.5 |
| A | 13 | 254 | 9663 | 64.98 | 677 | 666 | 138.5 |
| B | 4 | 171 | 179988 | 1386.61 | 671 | 654 | 129.3 |
| B | 5 | 255 | 60988 | 466.5 | 671 | 654 | 129.3 |
| B | 3 | 112 | 45464 | 346.47 | 671 | 654 | 129.3 |
| C | 15 | 214 | 243498 | 1599.41 | 654 | 658 | 151.8 |
| C | 12 | 249 | 18576 | 118.01 | 654 | 658 | 151.8 |
| C | 13 | 61 | 4492 | 25.25 | 654 | 658 | 151.8 |
| D | 1 | 52 | 340903 | 2147.09 | 648 | 629 | 158.5 |
| D | 12 | 233 | 226520 | 1425.35 | 648 | 629 | 158.5 |
| D | 12 | 6 | 122172 | 766.92 | 648 | 629 | 158.5 |
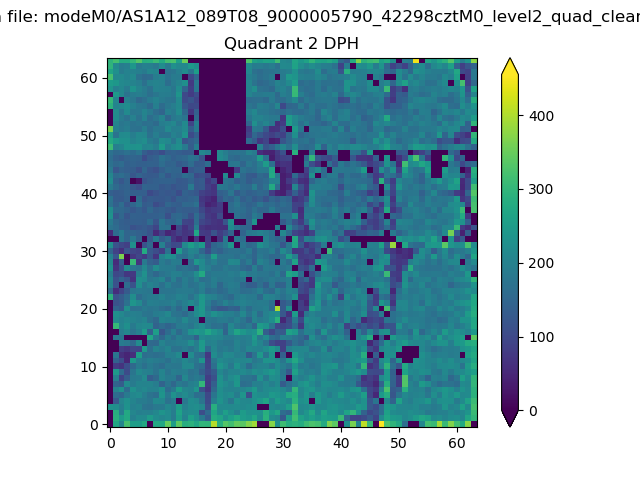
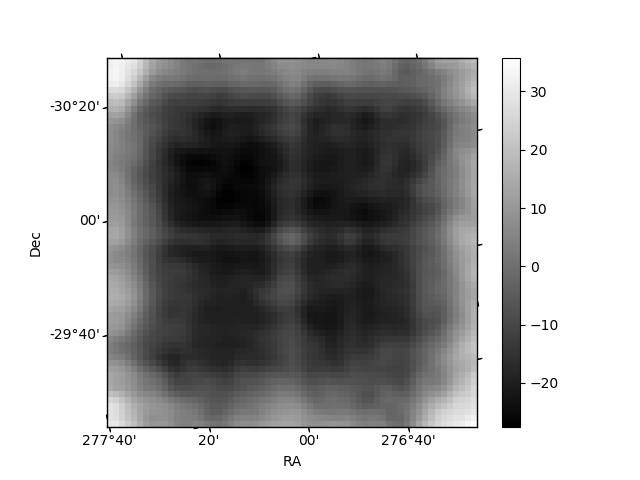
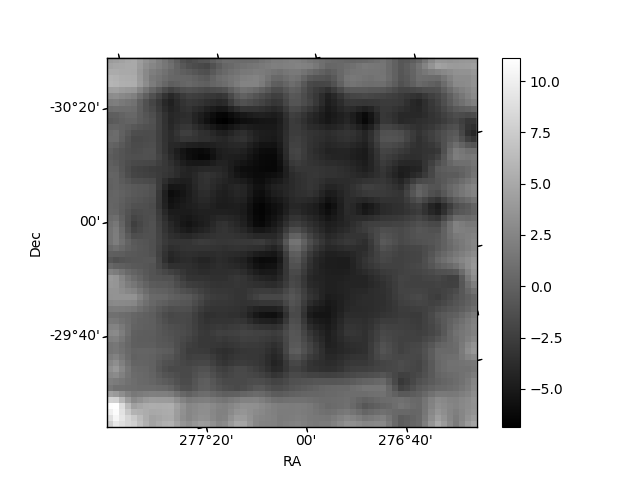
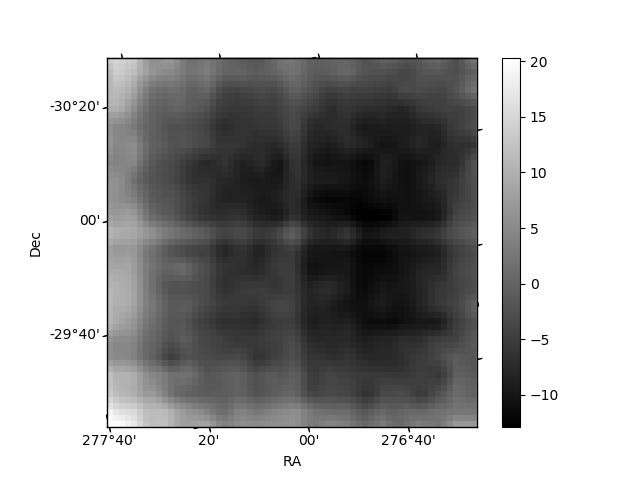
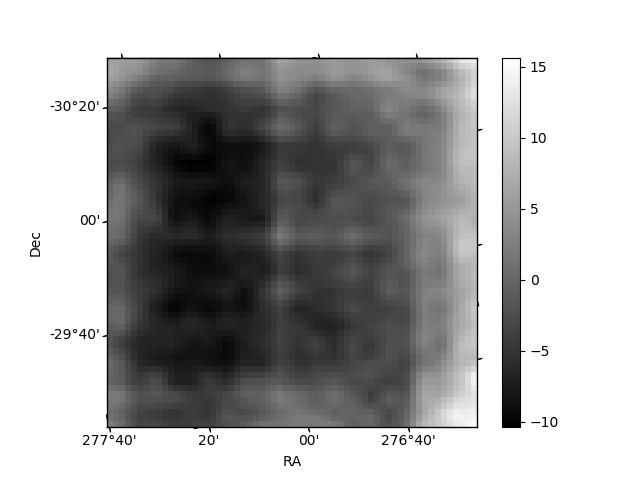
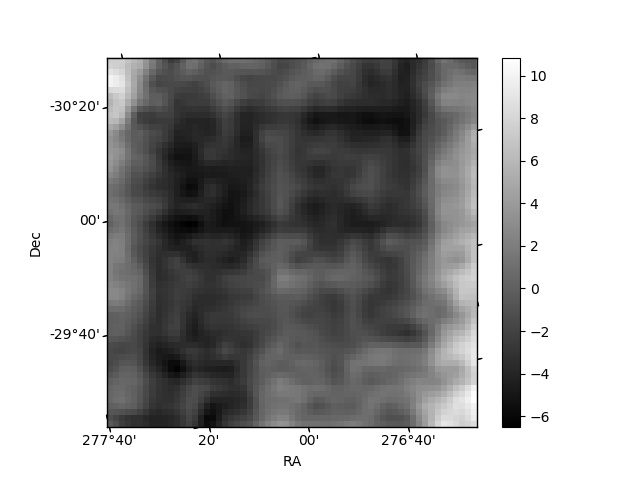
Histogram calculated using DETX and DETY for each event in the final _common_clean file
| Quadrant A | 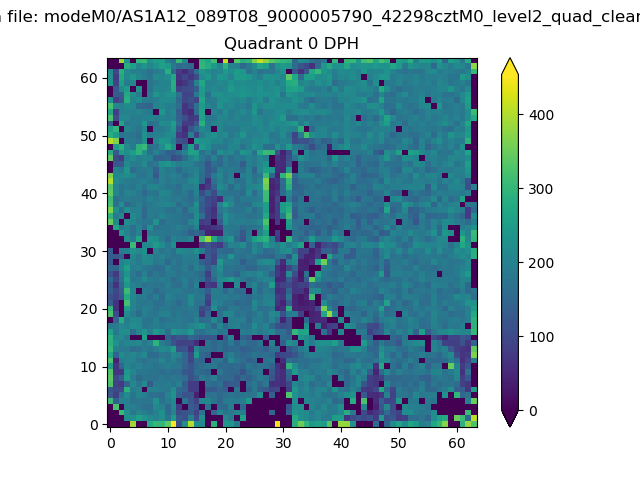 |
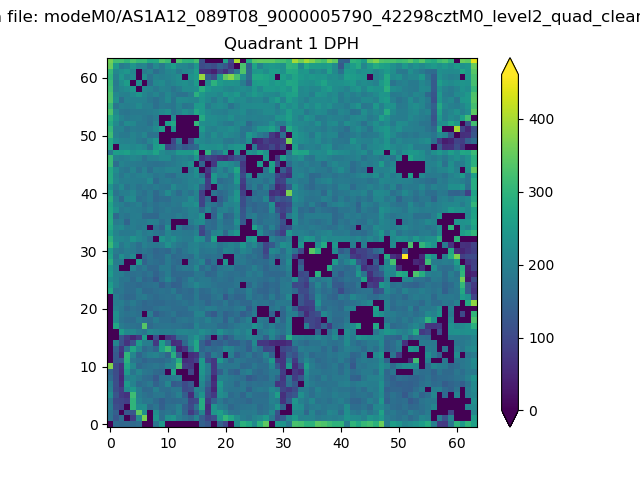 |
Quadrant B |
|---|---|---|---|
| Quadrant D | 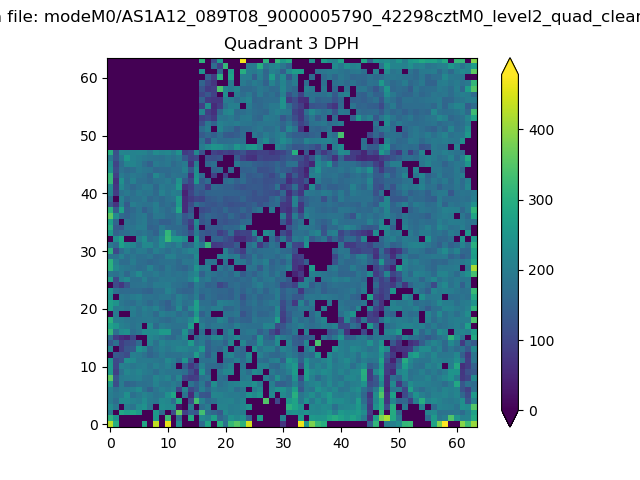 |
 |
Quadrant C |
| Plot type | Count rate plots | Images |
|---|---|---|
| Comparison with Poisson distribution Blue bars denote a histogram of data divided into 1 sec bins. Red curve is a Poisson curve with rate = median count rate of data. |
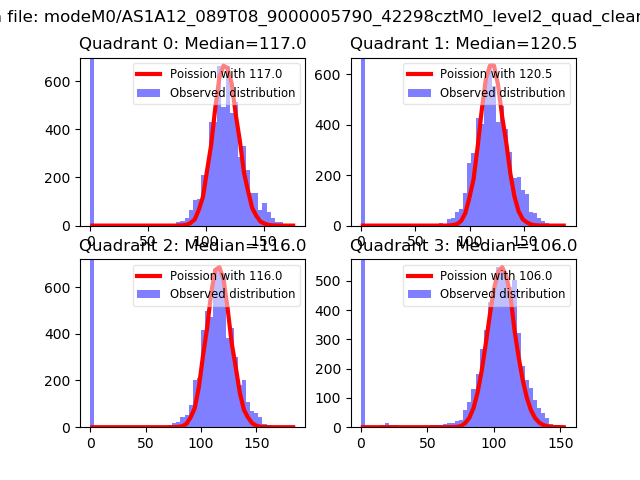 |
 |
| Quadrant-wise count rates Data is divided into 100 sec bins |
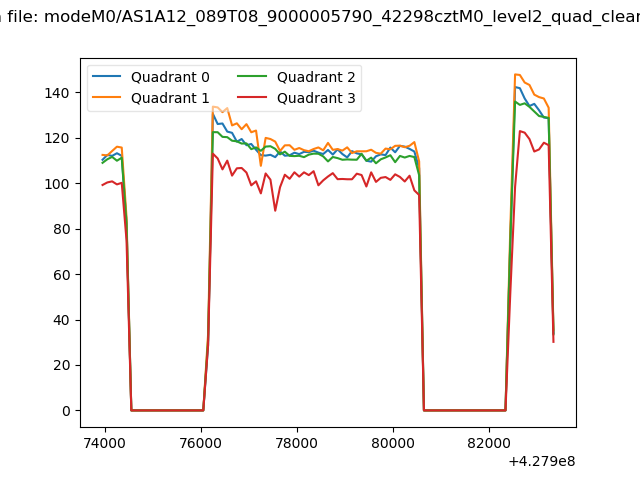 |
|
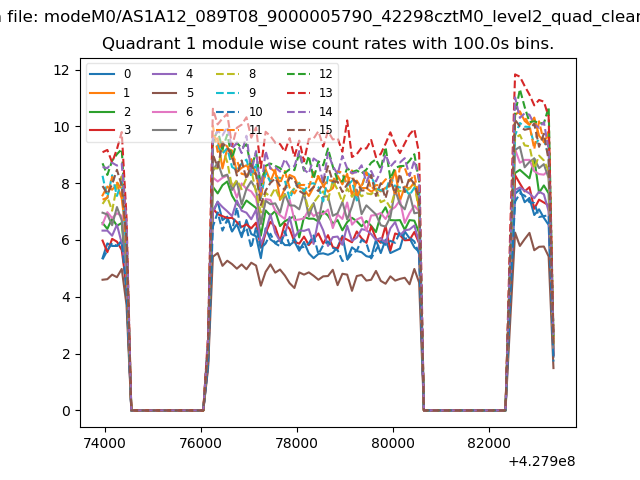
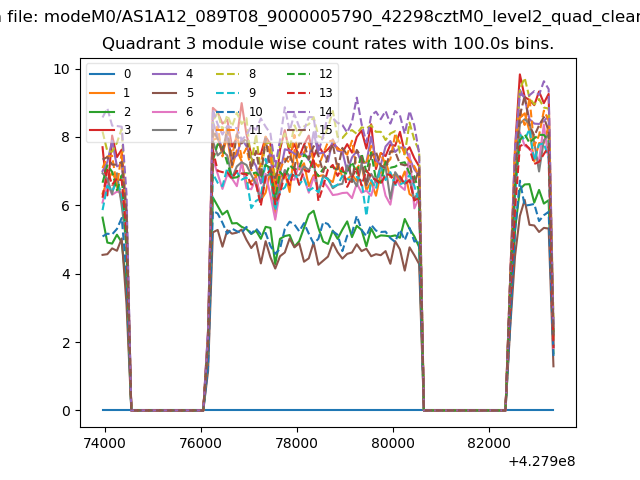
| Module-wise count rates for Quadrant A Data is divided into 100 sec bins |
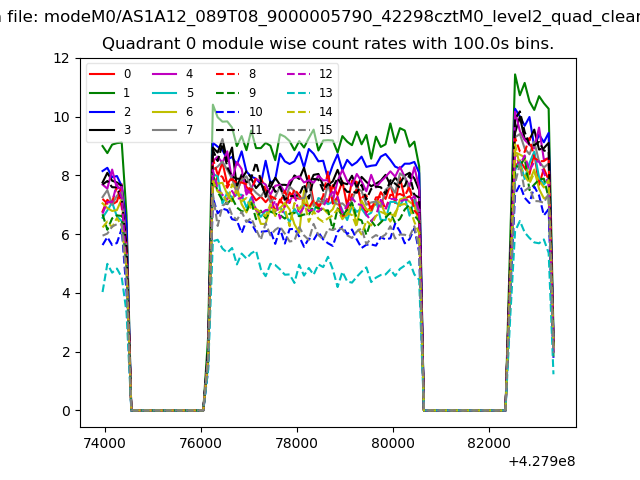 |
 |
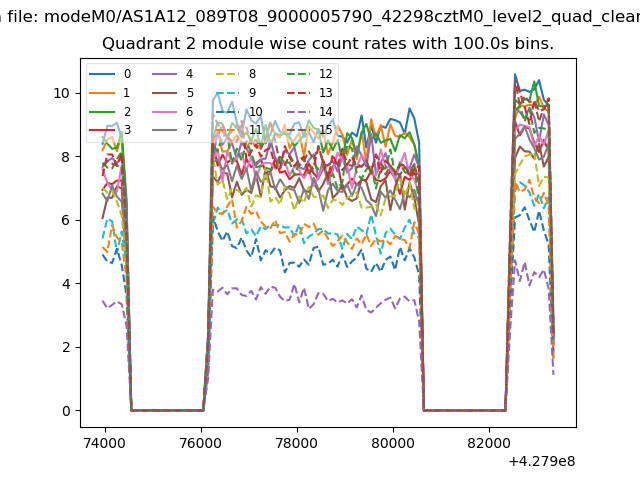
| Module-wise count rates for Quadrant B Data is divided into 100 sec bins |
 |
 |
| Module-wise count rates for Quadrant C Data is divided into 100 sec bins |
 |
 |
| Module-wise count rates for Quadrant D Data is divided into 100 sec bins |
 |
 |
| Parameter | Plot |
|---|---|
| CZT HV Monitor | 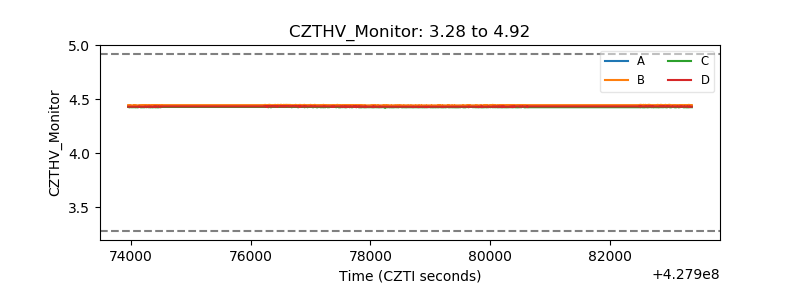 |
| D_VDD | 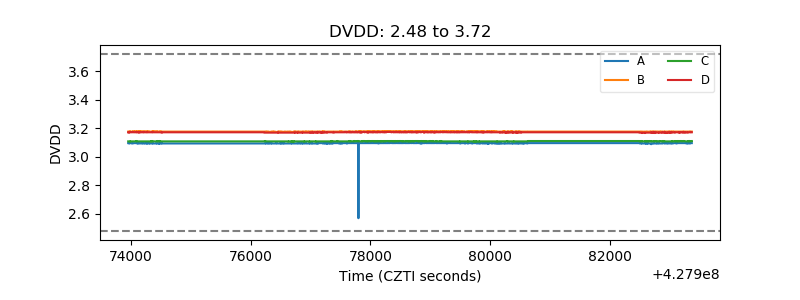 |
| Temperature 1 | 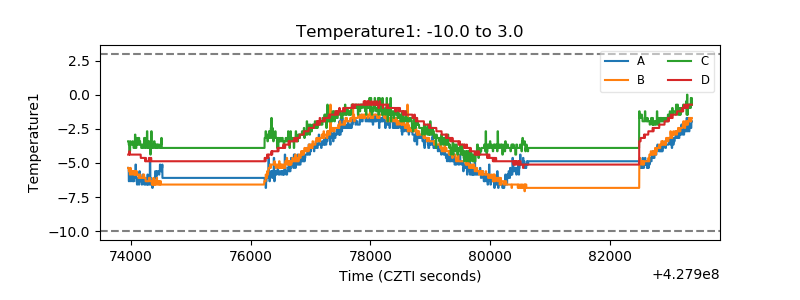 |
| Veto HV Monitor | 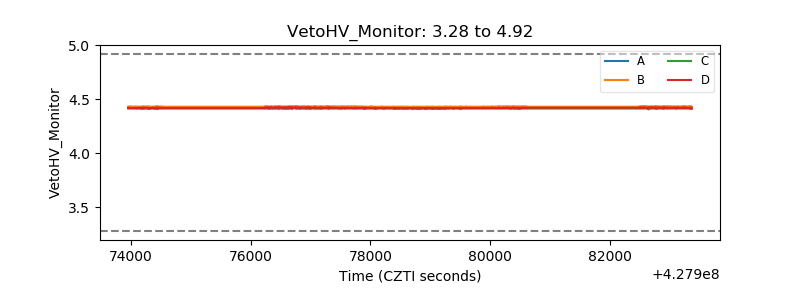 |
| Veto LLD | 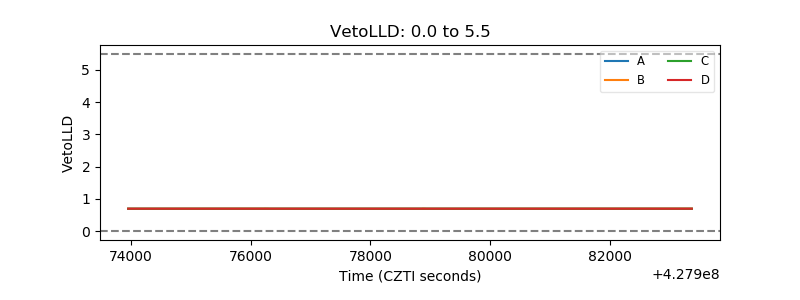 |
| Alpha Counter | 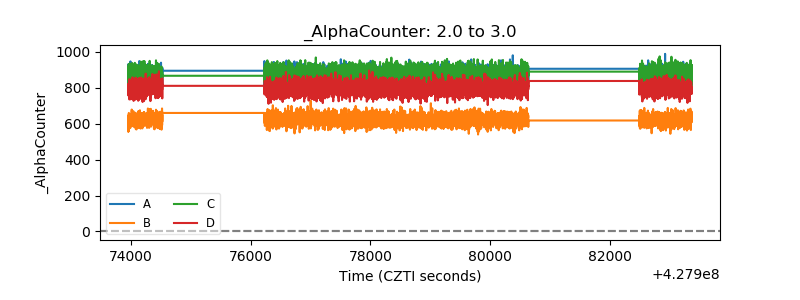 |
| _CPM_Rate | 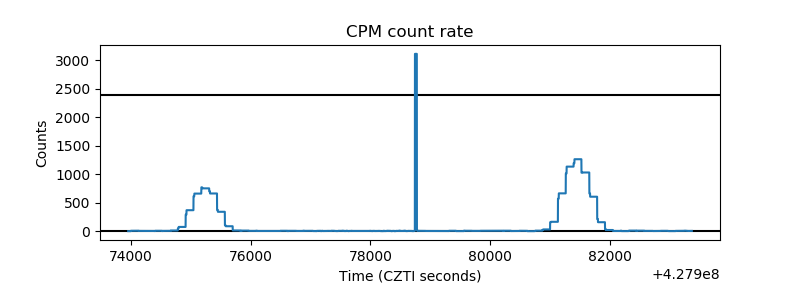 |
| CZT Counter |  |
| +2.5 Volts monitor | 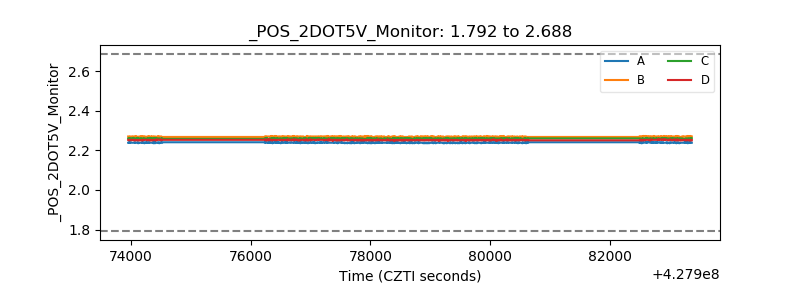 |
| +5 Volts monitor | 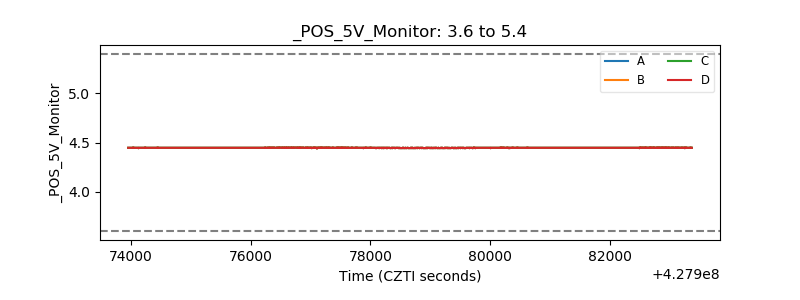 |
| _ROLL_ROT | 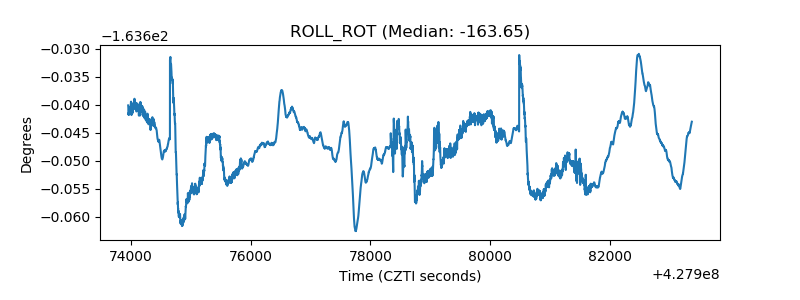 |
| _Roll_DEC | 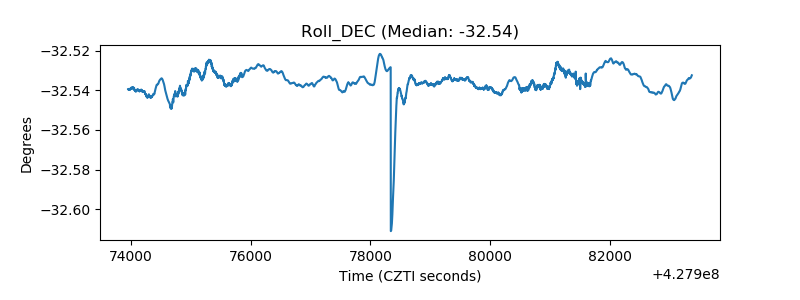 |
| _Roll_RA | 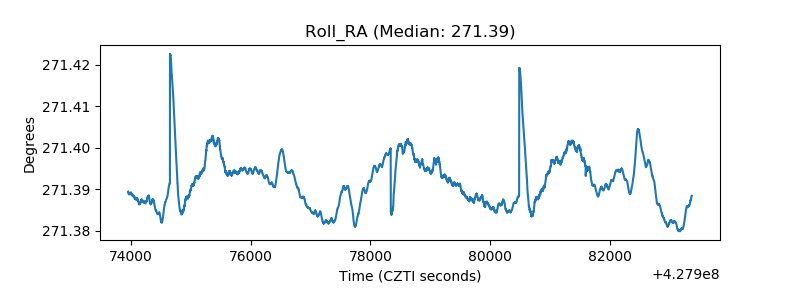 |
| Veto Counter | 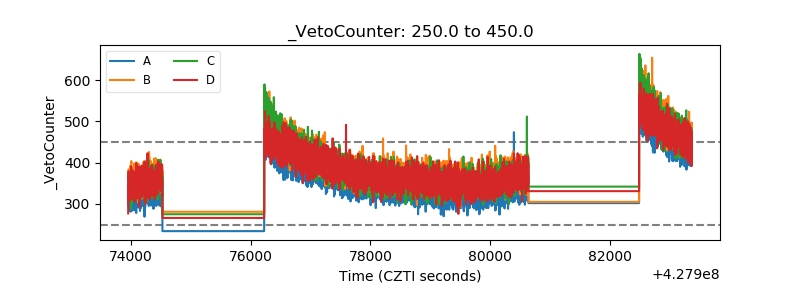 |